


The Week Ahead - 1/12/24
A comprehensive look at the upcoming week for US economics, equities and fixed income

If you're a new reader or maybe one who doesn’t make it to the end feel free to take a second to subscribe now (although then you’re missing my hard hitting analysis!). It’s free!
Or please take a moment to invite others who might be interested to check it out.
Also please note that I do often add to or tweak items after first publishing, so it’s always safest to read it from the website where it will have any updates.
As a reminder, some things I leave in from prior weeks for reference purposes, because it’s in-between updates, I want to be able to reference it in future weeks, etc.. Anything not updated this week is in italics. As always apologize for typos, errors, etc., as there’s a lot here, and I don’t really have time to do a real double-check (and it’s a staff of 1).
Note: I’m finding less and less time to complete this, so it’s probably messier than usual, I apologize. I’m working on ways to cut this down.
The Week Ahead
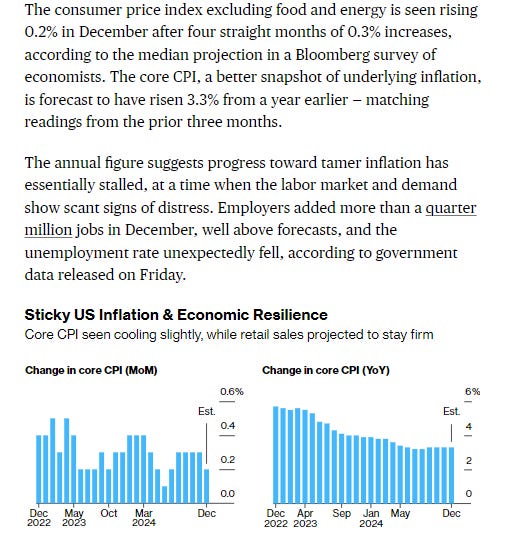
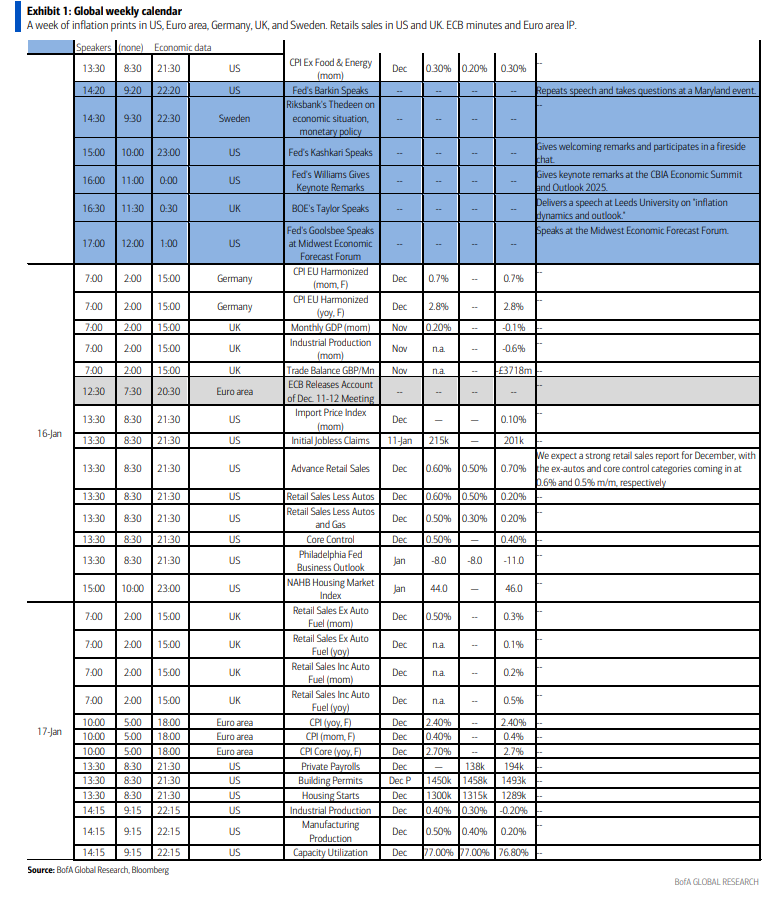
As we turn the page from a first week of the month to the second, the US economic calendar follows its normal flow which turns from the labor market to inflation with the trio of early-month inflation reports (we don’t get PCE prices, the Fed’s favorite gauge until late in the month) in CPI, PPI, and import prices. Coming on the heels of the strong employment report and jump in UofMich inflation expectations, hot inflation prints will almost certainly add fuel to the fire of the bond selloff and shrinking Fed rate cut expectations (and stoke rate hike concerns).
Of course, that’s just part of the data. We’ll get another widely watched data release in the December retail sales report (even though it only represents around 30% of total consumption) as well as the NFIB small business sentiment, NAHB homebuilder sentiment, industrial production, housing starts and permits, and the normal weekly reports. Also (note listed on the calendar are the NY Fed consumer survey on Monday (I’ll be interested to see if we see the same uptick in inflation expectations as we saw with UMich) and the Fed Beige Book on Wed. So plenty to keep us busy.
But, wait, there’s more… We’ll also continue to get Fed speakers, with BoA listing four although we heard from Schmid, Barkin, and Goolsbee last week, so really the only interesting one is Williams (who is an influential voice as the NY Fed Pres but hasn’t said much in his appearances over the last year). There are always more though, so we’ll see who pops up.
One thing we won’t get are any non-bill (>1yr) US Treasury auctions. In fact, depending on when the Treasury hits the debt ceiling, we might not see any until that’s raised.
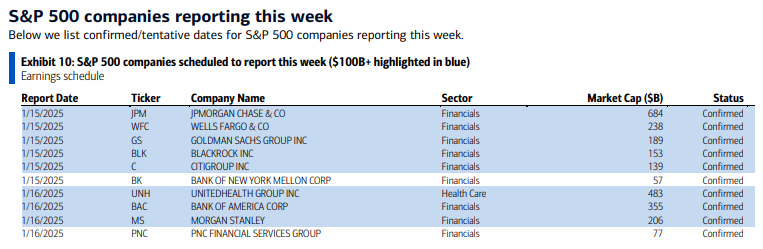
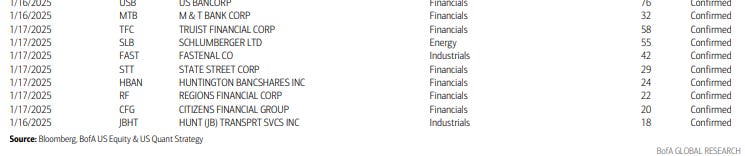
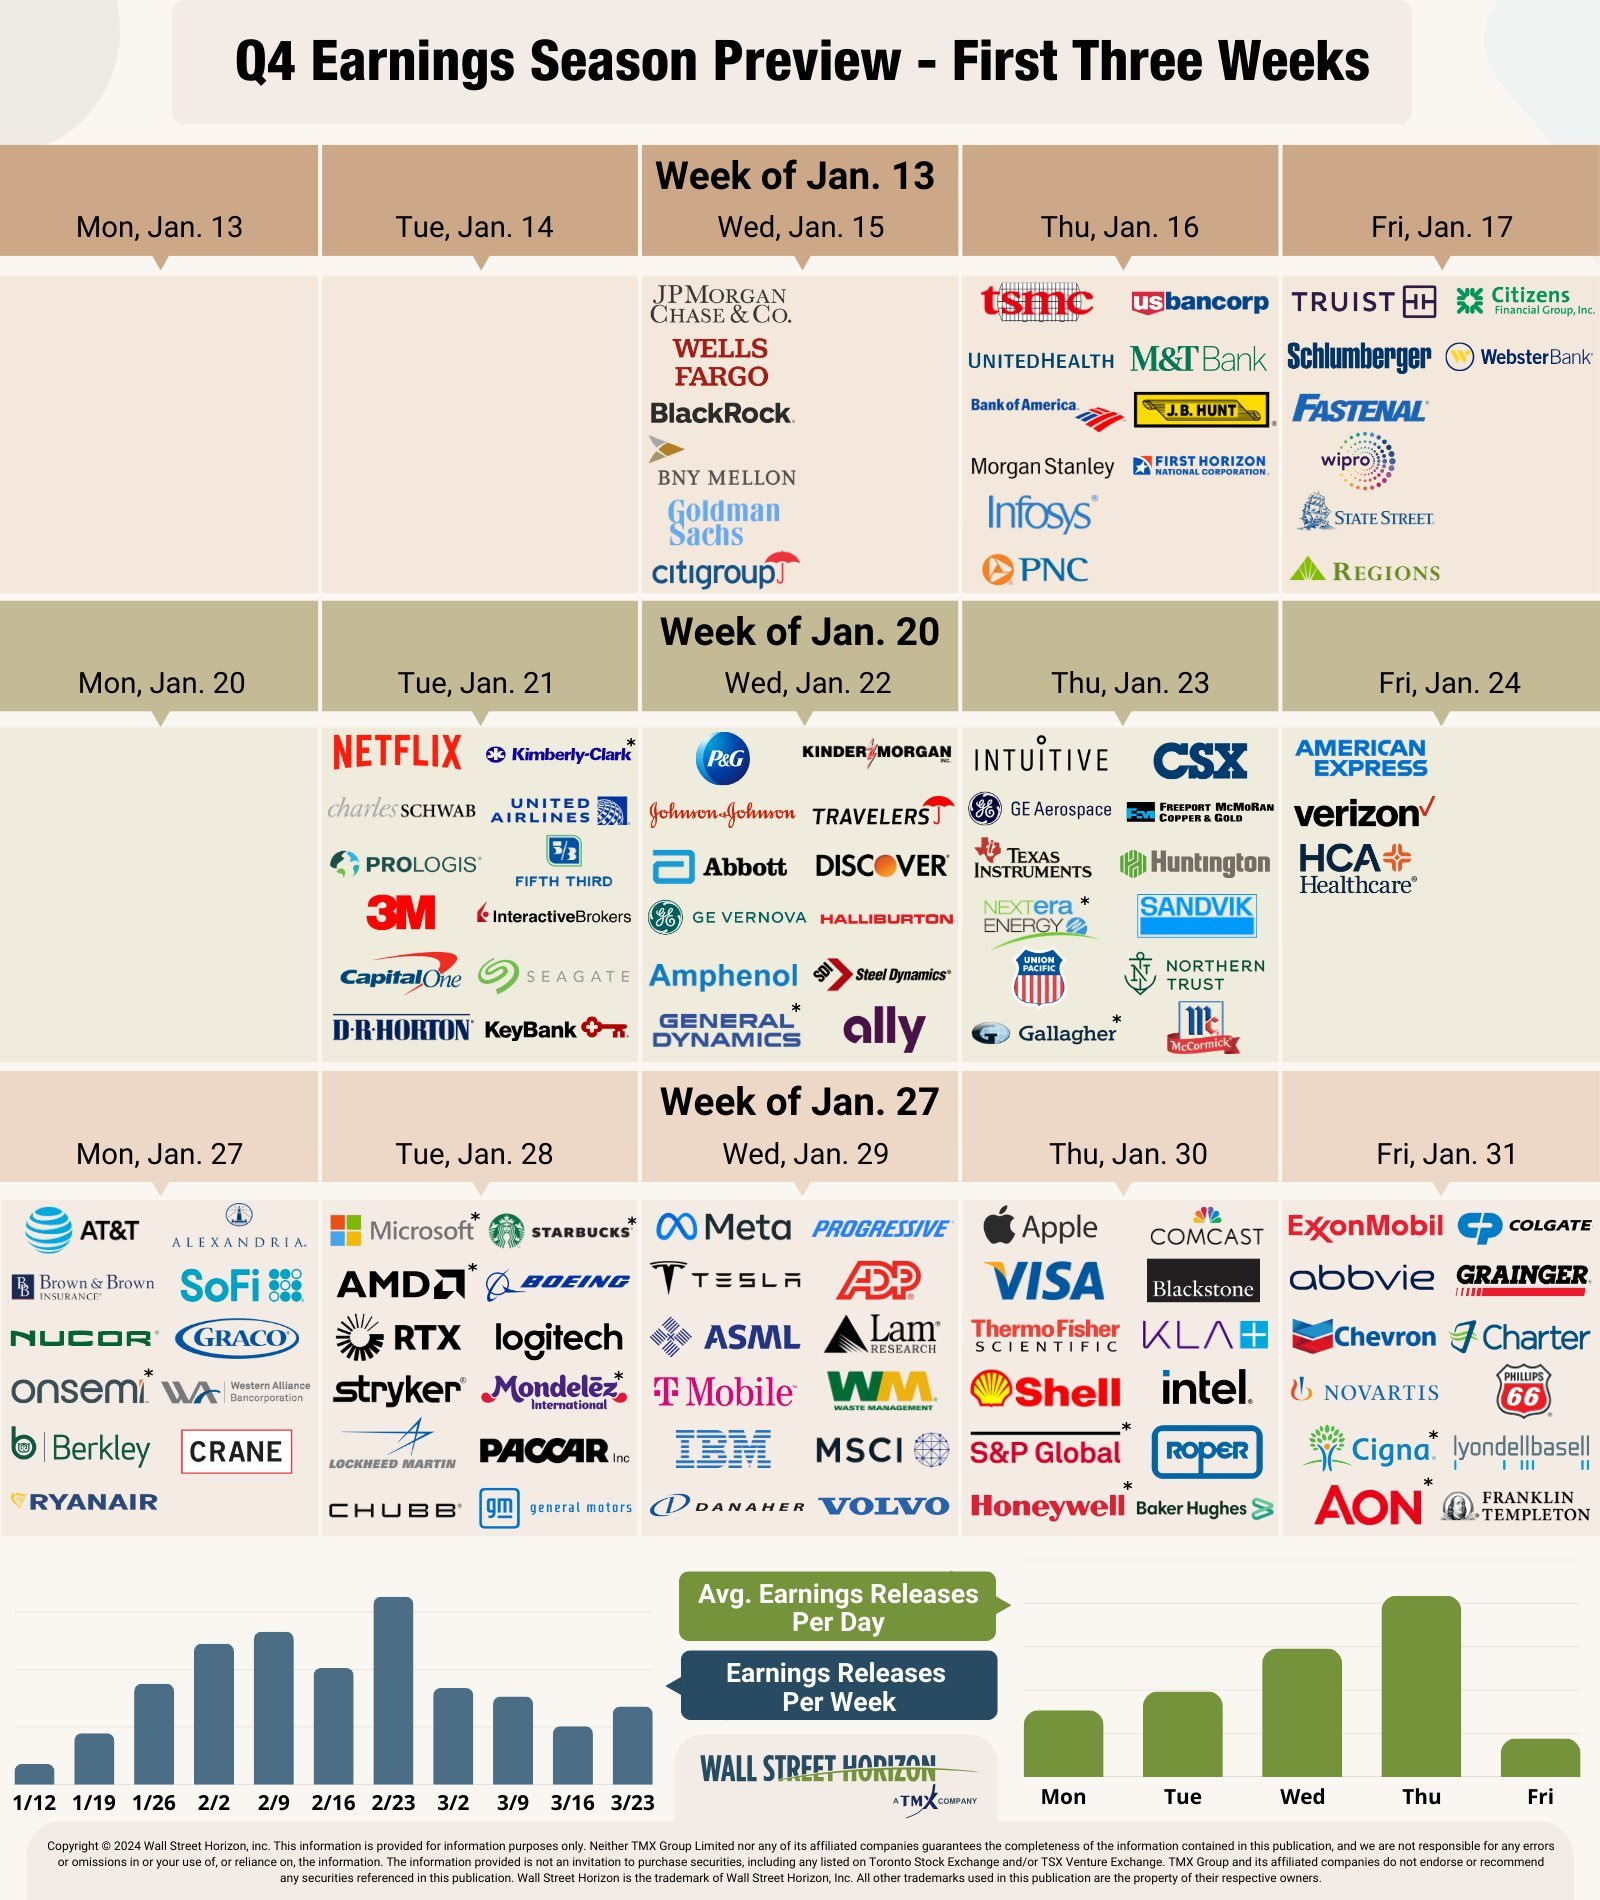
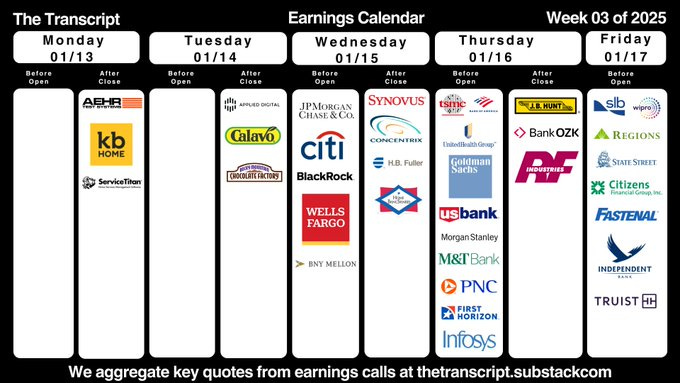
But 4Q earnings will see the "unofficial" start of the season with the big banks on Wednesday. In all we’ll have 20 (according to BoA) SPX components reporting this week, with eight >$100bn (JPM, WFC, GS, BLK, C, UNH, BAC & MS).
It’s also Jan options expiration FWIW (which is not much).


From Seeking Alpha (links are to their website, see the full earnings calendar):
Earnings spotlight: Tuesday, January 14 - Applied Digital (APLD).
Earnings spotlight: Wednesday, January 15 - JPMorgan Chase, Wells Fargo, Goldman Sachs, Citigroup, and Kinder Morgan (KMI).
Earnings spotlight: Thursday, January 16 - UnitedHealth, Bank of America (BAC), Morgan Stanley (MS), PNC Financial Services Group (PNC), and US Bancorp (USB).
Earnings spotlight: Friday, January 17 - Truist Financial (TFC), Schlumberger (SLB), Fastenal (FAST), State Street (STT), and Regions Financial (RF).


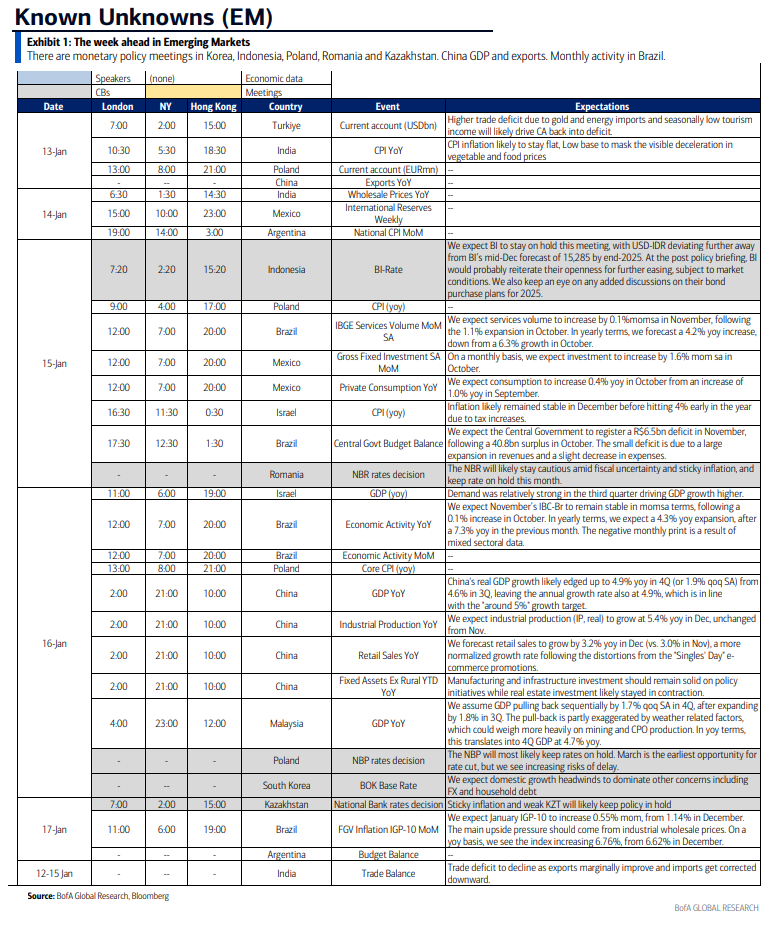
Ex-US, inflation is also a focus in the UK, India, Brazil, and Argentina among many countries releasing reports. We’ll also get growth figures from China and Germany, trade figures from across Asia, and policy decisions from South Korea, Poland, and Indonesia among others. France Prime Minister Francois Bayrou will lay out his policy agenda to parliament on Tuesday, including details on the budget.

In Canada, US President-elect Trump’s threatened tariffs will be the overriding focus, with outgoing Prime Minister Justin Trudeau convening provincial premiers to discuss responses and Energy Minister Jonathan Wilkinson visiting Washington in a last-ditch bid to avert the crisis.
In Asia, the week brings trade figures from across the region, providing a snapshot of commerce at the end of 2024 before any potential tariffs are announced by the US. The flow of data from China continues, with key economic readings including gross domestic product late in the week. The region’s biggest economy will be the main focus, kicking off with trade balance and export data for December, with analysts expecting to see activity remaining firm as global customers placed orders ahead of potential US levies. India, Indonesia and Singapore also release trade figures, while South Korea supplies trade price data which should provide an indication of demand.
In central banking, South Korea officials are expected to cut the main lending rate for the third time in a row. The economic outlook there has dimmed amid political turmoil, slowing domestic demand and expectations of a slide in exports, which drive growth. Indonesia’s central bank also announces its latest rate decision after holding at the prior meeting.
China caps the week with a slew of data. Home prices likely continued their slide — though perhaps at a slower pace. Industrial production probably held firm and retail sales accelerated on the back of stimulus measures. GDP is set to show the economy managed to hit the “around 5%” annual growth target for 2024, something President Xi Jinping already announced at the end of December. China’s Ministry of Commerce said Sunday that the country will “vigorously” boost consumption and stabilize foreign trade and investment this year. Amid the deluge, Australia releases a number of labor market figures and joins Thailand in providing a look at consumer confidence. Malaysia reports advance GDP, which is expected to show a slower fourth quarter. And Indian consumer prices are seen weakening slightly.
The UK will be in the spotlight again after a week when a global bond selloff threatened to upend the Labour government’s whole approach to the public finances. With consumer-price gains deemed by investors to be persistent, data for December on Wednesday will draw attention. Inflation probably accelerated slightly further above the Bank of England’s 2% goal, to 2.7%, though the gauge focusing on services may show slowing. Given the market backdrop, any BOE remarks will be closely monitored. Deputy Governor Sarah Breeden is scheduled to speak on Tuesday with fellow policymaker Alan Taylor on the calendar for the following day. In Europe’s other current fiscal hotspot, France, Prime Minister Francois Bayrou will lay out his policy agenda to parliament on Tuesday, including details on the budget. Data on Wednesday in Germany will probably confirm a second consecutive annual contraction in 2024. It’s also the first hint from within the G-7 of its performance in the final quarter of the year. Euro-zone numbers include industrial production on Wednesday and a final reading of inflation on Friday. A few European Central Bank appearances are scheduled, including Vice President Luis de Guindos and chief economist Philip Lane, while the account of the Dec. 11-12 monetary-policy meeting is down for Thursday.
Two rate decisions are scheduled:
On Wednesday, Romania’s central bank is expected to leave borrowing costs unchanged to assess the inflation outlook and economic prospects with a tense political situation in the background.
Poland’s central bank will announce its decision the following day, most likely with no change. Governor Adam Glapinski will brief reporters on Friday.
Further afield, will be consumer-price reports on Wednesday from Israel, Russia, and Nigeria.
In Latin America, Brazilian inflation and rate expectations will likely push higher in the central bank’s weekly survey. Local analysts have marked up their year-end 2025 forecasts for the two metrics by 40 basis points and 150 basis points, respectively, in just four weeks. Markets are pricing in a year-end key rate that’s roughly 100 basis points higher than economists. The central bank next meets Jan. 28-29. Brazil’s piping-hot economy looks to finally be cooling under the weight of tight financial conditions, though. Month-on-month GDP-proxy figures for November may turn negative as the year-on-year reading drops from October’s 7.31% pace.The week also sees Argentina release December inflation data that’s expected to show the annual print slowing for an eighth month to just under 120%, after peaking at almost 290% in April. Economists surveyed by the central bank see it ending 2025 at 25.9% before declining further to 15.3% in 2026 and 10% in 2027.
And here’s BoA’s cheat sheets.


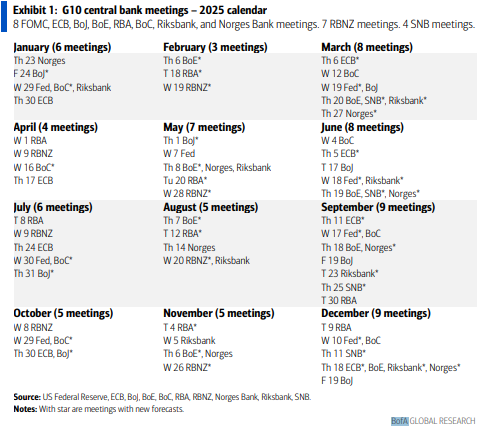
And here’s calendars of 2025 major central bank meetings.

Market Drivers
So let’s go through the list of items that I think are most important to the direction of equity markets:
Fed/Bonds
As noted previously this was one of the sections that had grown unwieldy, so I’ve really pared it down. Given I provide daily updates on Fed expectations, Fedspeak, and analyst thoughts on the Fed, it’s duplicative (and time consuming) to gather it all again so, again, I encourage you to look at those (the daily posts) for updates. I will just give more of a quick summary.
I noted three weeks ago,
just a few cuts before a prolonged hold would be consistent with the 90’s “soft landing” experience, and it’s certainly not implausible that inflation gets “stuck” around current levels and growth and labor markets remain in good enough shape keeping the Fed to just one or two (or I guess no) cuts in 2025, but I think it’s also not unlikely that we see continued softening in labor markets and the economy, and with just 18% of investors expecting a recession in 2025, it feels like a growth scare and a quicker path of Fed rate cuts is underpriced.
And I noted last week “a weak/strong NFP could be impactful” and as noted at the top, coupled with a jump in inflation expectations (and a drumbeat of hawkish Fed speakers during the week), markets moved to more fully price the “90’s ‘soft landing’ experience” seeing rate cut expectations dialed back to perhaps one cut (with pricing for none shooting higher as did pricing for a possible hike). I continue to think we’re pushing too far in the direction of no cuts, but until inflation shows some signs of resuming its descent or the labor market shows renewed signs of weakening (which at this point would take more than one month’s data) that’s where I think pricing will stick. So the inflation prints this week are important, but will be taken within that context.
Looking at the Treasury markets, the 2/10 curve was up +5bps w/w to +0.37% Fri just a little off the peak of +0.39% Wed according to the St. Louis Fed, the highest since May ‘22. I had said 4 weeks ago “this should steepen further following the FOMC meeting I think,” and it has certainly done so, but I still think has more to go given the richness in 2yr yields (more below).

As a reminder, historically when the 2/10 curve uninverts following a long period of inversion the economy is either in a recession or within a few months of one. Given we just got a 3.1% GDP for 3Q and are currently estimating around 2% for 4Q, it seems like the days of the 2/10 curve as an infallible recession indicator may be numbered.
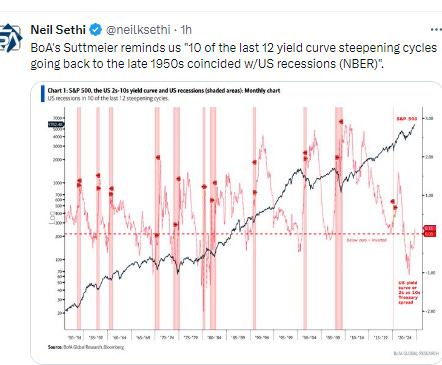

The 3mos/10yr yield curve (considered a better recession signal than 2/10’s w/the last four recessions on average coming a few months after the curve uninverted (prior to that it generally uninverted after a recession had already started)) now the steepest since Oct ‘22 at 0.41% (now up +1.54% since Sept 11th). It uninverted Dec 12th.


In that regard (the richness of 2yr yields) the 2yr yield was up +9bps Fri (so up more than the 10yr) to 4.38%, now the highest since July. I say “notably” because it is now above the current Fed Funds effective rate, meaning the 2yr is pricing a higher chance for net rate hikes than cuts over the next 2 years. I have mentioned before I find this level very rich, as I think a cut is more likely than no cuts (as do Fed Funds futures markets), and definitely more likely than a hike, but I guess we’ll see.

Long term inflation expectations (as measured by the 5-yr, 5-yr forward rate (exp'd inflation starting in 5 yrs over the following 5 yrs), specifically mentioned by Powell at the Nov FOMC press conference (he said the metric was “right where it’s been, consistent with 2% PCE inflation”), up to the highest since Oct +7bps w/w to 2.35% on Thursday (+6bps since the Nov FOMC).

With both nominal 10yr Treasury yields increasing a little more than inflation expectations, 10yr real rates pushed to new 14-mth highs (and before that 2007) at +2.29%, +5bps w/w, well above the 2010-2020 peak of 1% (but down slightly from the post-pandemic peak Oct ‘23 of 2.5%).

10yr real rates using 5-yr, 5-yr forward inflation expectations (subtracted from the 10yr nominal yield) similarly edged higher to the highest since Oct ‘23 (and before that 2007)) at 2.34%, well above the 2013-2020 average of around 0.5% (but down slightly from the post-pandemic peak of 2.5% in October '23).

And as a reminder according to BoA the importance of real rates on equity returns has seen the largest increase in the factors they track over the past 5 yrs and explains a larger proportion of stock returns (83% correlation) in their data (to 2006), with the dollar close behind the most correlated (76%) since 2015.
Shorter-term real yields (Fed Funds - core PCE) fell following the FOMC rate cut to 1.82%, the least since Sep ‘23 and down from 2.70% in June (which was the highest since 2007), but still well above anytime in the 2010-2020 period. [this will be updated end of Jan w/PCE]
And the real prime rate (using core PCE) continues to edge lower from the 5.9% in June, which was the highest since Sep 2007. Now down -90bps at 5.0%, still though more than double the 10yr pre-pandemic avg. [this will be updated end of Jan w/PCE]
And looking out longer term, one thing to note is the FOMC’s long run projection for the endpoint of the Fed Funds rate (the “neutral rate”) is now the highest since Sep 2018 at 3.0% (and not unlikely to go higher as I said earlier this yr). [This won’t get updated again until March].
The ACM model of the 10yr term premium (which is solely based on interest rates) hit +0.62% as of Jan 2nd, the highest on this model since May 2015. It’s now +73bps since the FOMC did the 50bps cut in Sept.
I had been a broken record since the Spring that I thought at some point (I thought most likely around the election) the term premium pushing up longer duration yields could resurface as an issue perhaps cause some mild equity indigestion as it did in Oct of last yr, and while the market initially ignored it, it seems to be a factor in the recent weakness over the past month.
https://en.macromicro.me/charts/45452/us-10-treasury-term-premium

FWIW the the St. Louis Fed 10yr term premium estimate (which runs a week behind and is based off the Kim and Wright (2005) model (which differs from other models in that it incorporates non-yield curve factors such as inflation & GDP) shows an even higher term premium as of Jan 3rd at 0.70%, down -1bps from Dec 27th when it hit the highest since May 2011 on this model, and up +68bps since Sept.

The extended discussion on term premium (what it is, why it’s important, etc.), can be found in this section in the Feb 4th Week Ahead.
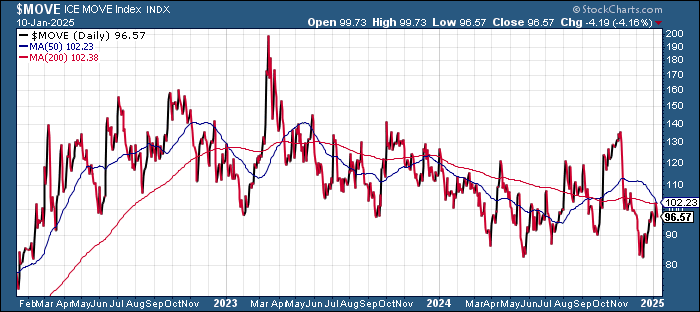
As the MOVE index of expected 30-day bond volatility was little changed w/w, remaining a little closer to the lows of 2024 than the highs despite the continued upward move in yields.
With bond volatility little changed (at least according to the MOVE index), 30yr mortgage spreads edged lower -5bps to 2.28%, just 2bps above the least since June ‘22. They remain around +55 bps above the 2010-2020 avg level, but well off the 3.1% peak in June ‘23.

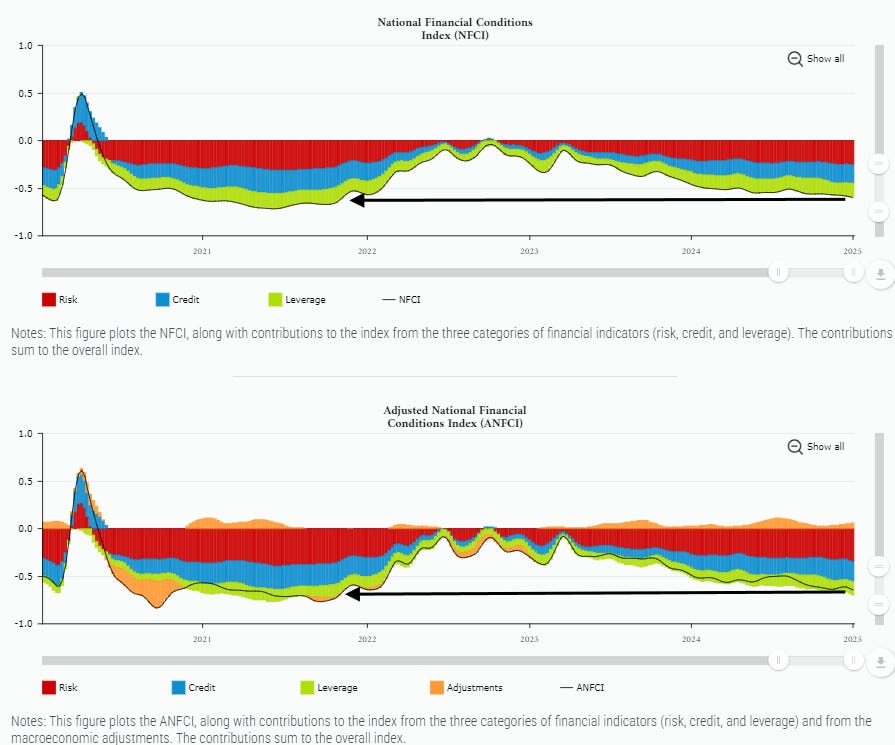
Chicago Fed National Financial Conditions Index and its adjusted counterpart (which attempts to remove the correlation between the various indicators due to broad changes in economic conditions, both of which are very comprehensive each w/105 indicators) in the week through Jan 3rd despite the continued rise in real rates saw both edge lower, the least since Nov ‘21.
https://www.chicagofed.org/research/data/nfci/current-data
As the Fed continues to drain liquidity from the system via QT, I think it’s important to watch for stresses which give an early warning signal that they are perhaps going to far as they did in 2018 which led to a near bear market. One area I am monitoring is reverse repos (which is an overnight secured place institutions (mostly money markets and banks) can park excess funds to accrue some interest designed by the Fed originally to keep excess liquidity from pulling down rates too much in other short term markets). RRP grew rapidly in 2021 & 2022 as money was pumped into the system but since May ‘23 has been steadily drained down by the Fed’s QT program and higher bond issuance with banks discouraged by regulatory rules from taking up the increased Treasury supply.
In particular, the continued sizeable issuance of T-bills (<1 yr duration) of around $800bn/month (accentuated by the $60bn in balance sheet runoff (meaning the Fed has reduced its buying of maturing Treasuries by that amount which the private market has to fill)) drained ~$1.75 trillion from RRP in the year through March 1st. From then until early July RRP levels had remained relatively stable in the $375-$500bn range, but since early July they resumed their decline (in fits and starts), hitting new lows on Dec 20th at $98bn, the least since Apr ‘21 on the back of the Fed cutting RRP rates to the low end of the Fed Funds band which made parking funds there (versus lending overnight to other institutions or buying T-Bills) less attractive in line with their desire to sop up most of this “excess liquidity” (as they have described it).
As noted previously, after RRP surged the last 2 weeks of the year as banks looked to “window dress” their books, hitting $473bn Dec 31st, the most since June 28th (Q2 end), that has come off quite a bit but not quite down to where it was before the YE rebuild at $178bn as of Friday (-$95bn w/w). Still I expect this to continue its decline as long as the Treasury is conducting Treasury auctions (it will have to stop at some point in January when it runs up against the debt limit) given the Fed has made parking funds in RRP less favorable. But for now, it seems there is a cushion to absorb issuance (in addition to the normal buyers).


As noted previously, despite the drawdown in RRP Dallas Fed Pres Laurie Logan (who is an important voice given her extensive experience in the NY Fed's markets group) has said she believes current liquidity is “more than ample” (and the current NY Fed Pres Williams said something similar two weeks ago) and said she's looking for RRP to fall to "negligible" levels. As I said then “she's the expert so I'll defer to her, but I continue to be on the lookout for funding stresses now that RRP has crossed below $100bn, and I still think at zero RRP the Fed may need to stop QT to avoid another liquidity shortage as they did in late 2018.”
And as noted previously, BoA, who had previously estimated that RRP would fall to zero in Oct has pushed that out now to Jan ‘25. For more on BoA’s forecasts for RRP to drop to near zero ($60bn) by Oct you can follow the link and look in this section (but it’s mostly due to RRP yields falling below those of money markets and will be soaked up by bonds (from Fed QT), the Treasury (with a higher TGA), and currency growth (in dollars). If bank reserves increase that would also pull from RRP. They see it building again into early 2025 (which is what we saw) before declining again towards zero.
Also, we’ll have to see how the debt ceiling impacts things. With T-Bill issuance likely to be paused sometime in January (Janet Yellen said last week that “extraordinary measures” would start in January), until the debt ceiling is raised the likely consequence is a build in RRP as money markets, etc., need another home for their short-term lending. This was what BoA predicted back in Sept. Their analysis has been pretty accurate (they saw RRP falling to $185bn by YE (about where it is now).
In that regard, I’ll highlight the below link that I’ve left in for reference regarding the impact of the debt ceiling not being raised on time (this upcoming week which as noted will see the TGA draw start sometime in January). I hope it doesn’t take until July, but if it does go on for a few months, when auctions restart they will need to be resized to “catch up” which will see the influx of liquidity pulled back out. That didn’t really cause any issues when it happened May 2023 (the last late debt ceiling extension), but we also had a lot more liquidity in the system (RRP levels were at record highs above $2tn (arrow) but they fell sharply from there, down around -$1.7tn over the next 10 months). We have nothing like that amount of “free liquidity” this time around.
For more on BoA pushing back their est for the end of QT to Mar ‘25 from YE ‘24 “which could create a funding blind spot for the Fed” in the event the debt limit (which expires at YE) is not resolved you can follow this link and look in this section. In summary their thinking is that, similar to earlier this year, the Treasury’s depletion of its General Account (TGA) will offset what would otherwise be a continued drawdown of liquidity. That will keep liquidity stable but will rapidly reverse once the debt limit is ultimately raised (which BoA est’s will again be in July as they assume Congress will take it to the very last second as is their habit), which could lead to a funding squeeze. However if the debt limit is raised in advance, the liquidity issue will come quickly as noted above, and we could very easily find ourselves in another 2018 scenario (which resulted in a near bear market).
And after bank reserves fell sharply to a 4-yr low of $2.89tn the previous week to fund the buildup in RRP (which BBG thought was due mostly to banks “window dressing” their books by pulling back on intra-bank lending and instead putting into the “safer” RRP program), as expected that more than reversed last week with bank reserves jumping +$440bn to $3.33bn, the most since Sept.
I’ve noted previously that it seems that as long as reserves remain above the $3tn level (which is where we saw indigestion in the credit markets in March ‘23 (which contributed to the banking issues (SVB, etc.)), it seems they indicate more than sufficient liquidity in the system.
Overall, bank reserves are just -$30bn below June 1, 2022 levels ($3.36tn), when the Fed started QT, a better result than even the most optimistic estimates at the time.

For background on various estimates of when reserves will be “too low” see the Feb 4th Week Ahead.
Getting back to rates, I said 9 months ago 2-year Treasuries were a good buy at 5%, and as I noted once the Fed started its cutting cycle the ship has likely sailed on seeing those yields anytime soon (meaning years). In terms of 10’s I had advised then grabbing some at 4.7% which I had thought seemed like something we wouldn’t see anytime soon, but as I noted three weeks ago
the Fed saying the ‘recalibration phase has ended’ along with concerns about sticky inflation cropping back up and now questions about the inflationary impact of some of Donald Trump’s policies, has seen rates just about back there. I still am not sure we see 5% absent another ‘something new’ (like the Fed becoming even more aggressive (for example due to Dec’s data coming in hot (payrolls and CPI/PCE prices)).
And we once again did get “something new” in the strong payrolls print (which came along with an unexpected jump in consumer inflation expectations). That has pushed 10-yrs above the 4.7% level, perhaps now on their way to 5%. There are a lot of institutions that have said they’re buyers at that level, so we’ll see what happens if we get there. I certainly will be picking some up. That said, IF the Fed is truly done with the rate cutting cycle (which I don’t expect), then the 10yr yield should really be somewhere in the 5.3-5.5% range.
In terms of much lower yields, as I said 13 weeks ago, we have probably seen the lows until we get a recession:
“while we didn’t quite see 3.5%, I think 3.6% is close enough, and I think we might have been at or near the lows at this point, particularly as the Fed has been raising their neutral rate estimate. If the endpoint for Fed Funds is around 3% (or higher) then it’s hard to see the 10yr trading much lower absent a recession. Similarly 2yrs at 3.6% seem to be very rich and almost certainly too low absent a recession consistent with my statement last week.” In short I’d expect to see 4% on these before we see 3.2%:
At around 3.6% on both the 2 & 10yrs absent a recession I think there’s not much value in either (I’d rather park my cash in short term Treasuries (0-3mths) or safe dividend paying stocks with a track record of growth (dividend aristocrats, etc.) at these levels.
Last week I did add a little more to to 2yrs which are now trading above the Fed Funds rate (meaning they are pricing net hikes over the next two years), and I will step up my buying of 10yrs if they do make it to 5%.
For all the old “final hike” and “first cut” materials, you can reference the Feb 4th blog post.
BoA updated their FOMC Dove-Hawk Chart. Note it’s missing Hammack in ‘26 (Cleveland and Chicago vote every 2 yrs), but otherwise looks right. Also note that Philadelphia Fed Pres' Harker’s term is up next year (which is why they don’t have a name for Philadelphia), something I didn't realize.
I think this now needs some dramatic changes with Hammack (who dissented voting for no cut in Dec) clearly one of the most hawkish members, Daly at best a Centrist as she sees only 2 cuts in 2025, and perhaps Collins as well. Goolsbee is clearly the most dovish of the members currently.

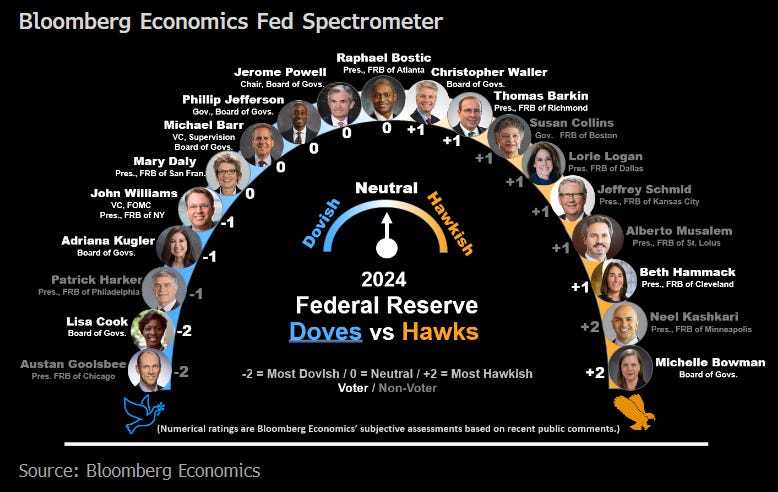
And I came across one from BBG. I think it’s pretty accurate except Kashkari is definitely not that hawkish (he was calling for a December cut in early November):
Earnings
As a reminder, I have removed most of the background material, which you can get in the Feb 4th blog post. As you know I’ve moved on to 4Q and beyond. You can reference this post from 12/1/24 for stats on 3Q.
From Factset:
Expectations for SPX Q4 earnings as compiled by Factset fell two tenths w/w to +11.7% (down -2.8% since the start of the quarter, less than the 5 & 10yr avgs (-3.3% & -3.2%) for this period). This would be the most growth in three years and would mark the 6th consec quarter of earnings growth.


As I note each quarter though, it’s normal for there to be a “beat” which sees actual earnings surpass estimates as of the end of the quarter (only 3 times in the past 40 quarters has that not happened (Q1 ‘20, Q3 ‘22, Q4 ‘22) according to Factset. That was +11.9%.
The 10-yr avg has seen a lift of +5.4%, 5-yr is better at +7.1%, but the past 1-yr has only been +2.2%. That would mean even at the low end earnings growth would end up over +14%, at the high end around +19% (!).
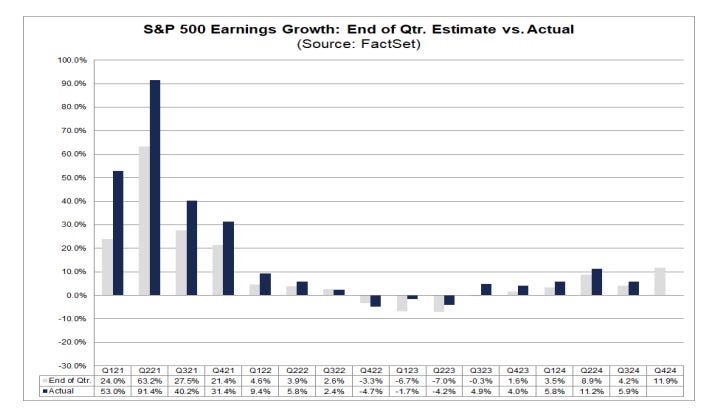
Looking more specifically at Q4, according to Factset, just 5 industries are responsible for most of the exp'd earnings growth in Q4: Banks (187% exp'd growth), Semiconductors & Semiconductor Equipment (34%), Pharmaceuticals (64%), Interactive Media & Services (25%), and Broadline Retail (48%). "Excluding these five industries, the estimated earnings growth rate for the S&P 500 for the fourth quarter would fall to 1.6% from 12.0%."
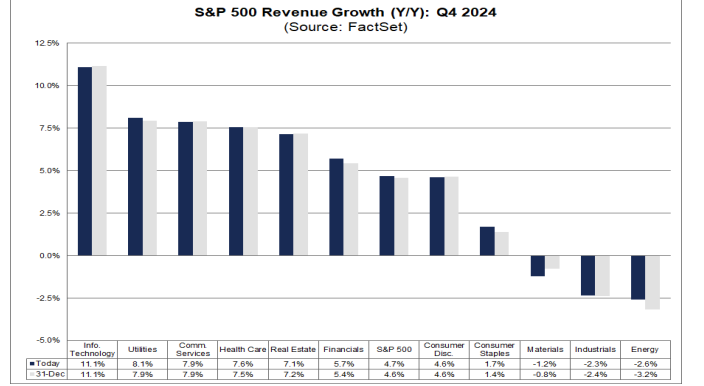
In terms of Q4 revenues, Factset says SPX co’s are expected to see revenue growth of 4.7% y/y (+0.1% w/w), down from +5.2% on Sept 30. It would mark the 17th consecutive quarter of revenue growth for the index.
In terms of profit margins, Factset says SPX co’s are expected to report net profit margin of 12.0% for Q4, which is below the previous quarter’s net profit margin of 12.2%, but above the year-ago net profit margin of 11.2% and the 5-year average of 11.6%.


2025 quarter-by-quarter earnings expectations on net increased this week but not uniformly. Q1 ‘25 fell one tenth to +11.8% (-2.3% last 10 wks) but Q2 ‘25 was unch at +11.6% (-1.7% last 10 wks), Q3 was up a tenth to +15.3%, and Q4 up a big six tenths to +17.2%.

Despite Q4 earnings expectations falling two tenths, FY ‘24 exp's were basically unchanged at $239.33 (a penny above the lows of the year), now representing +9.4% growth. Looking further back, though, it remains down just around -2.5% from July 1, 2023, much better than the typical -6% or so drop we historically see.
2025 earnings expectations improved +14 cents to $275.19 (now +14.8% growth), now up +65 cents from the recent low 6 wks ago which was the least since February.

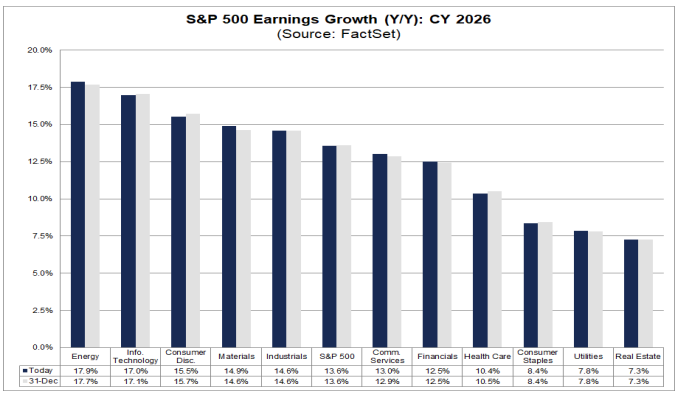
FWIW 2026 earnings are exp’d to grow 13.6%.
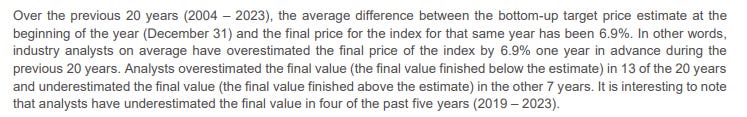
In terms of the +14.8% earnings growth exp’d for 2025 Factset notes it will be a record at $275.19, although also notes that there is on average over the past 25 yrs a -6.3% deterioration from where it starts the year ($275.05) w/analysts overestimating in 17 of those yrs (which would equate to $257.72). But it should be noted that average includes 4 outlier years (2001, 2008, 2009 & 2020) where the overestimation was b/w 27-43% due to recessions. Excluding those, the difference is just -1.1% (which would equate to $272.02).
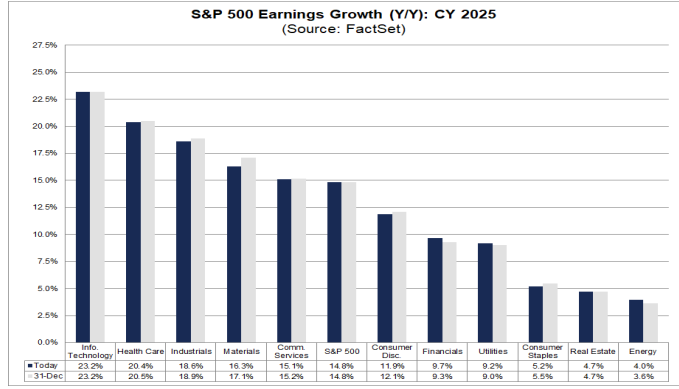
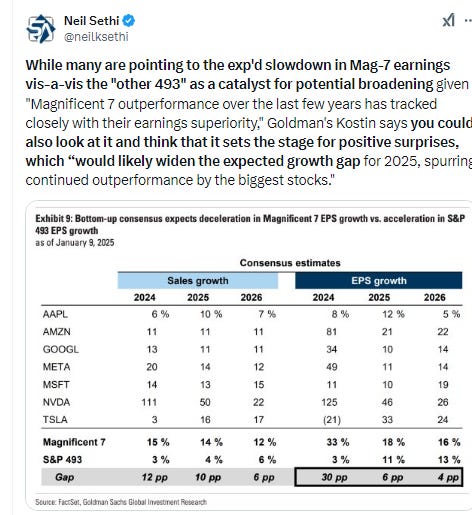
Factset also notes that “"analysts believe earnings growth for companies outside the 'Magnificent 7' will improve significantly in 2025. While analysts expect the 'Magnificent 7' companies to report earnings growth of 21% in 2025, they expect the other 493 companies to report earnings growth of 13%...a substantial improvement to ...just over 4% earnings growth for these same companies for CY 2024."
In terms of exp’d 2025 revenues, analysts are looking for 5.8%, above the 10-year average of 5.1% (2014 – 2023). Ten of the eleven sectors are projected to report year-over-year growth in revenues, led by the Information Technology sector. The Energy sector is the only sector expected to report a year-over-year decline in revenues.
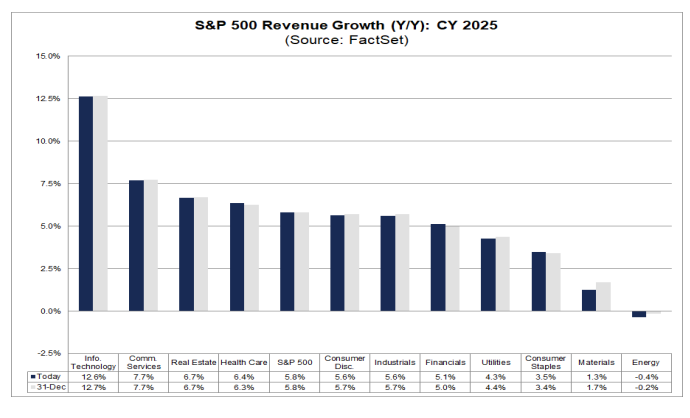
They also see at a record profit margins at 13%, well above the 10-yr average of 10.8% and the highest since Factset started tracking the metric in 2008 (previous high was 12.6% in 2021).
In terms of how markets are handled earnings beats & misses for 3Q, looking 2 days before to 2 days after an earnings release, Factset saw beats rewarded more than average at +1.6% vs 5yr avg of +1%, and misses punished more than average (-3.1% vs 5yr avg of -2.3%).
Factset’s analysis of analyst bottom-up SPX price targets for the next 12 months as of Thursday was up another +22pts w/w to 6,755 (+14.1%), now up ~1,720 points over the past 41 weeks.
Materials (+23.8% down from +25.8% last week) remains with the largest upside seen by analysts followed by Health Care (+20.0% (down from 20% last week but up from +13.1% six weeks ago before the “Kennedy” selloff)), while Consumer Discr remains as the sector expected to see the smallest price increase (+5.1% up though from -3.3% three weeks ago (the first negative in over a year)).
As a reminder the last 20 yrs they have been on avg +6.3% too high, but note they underestimated it five of the past six years (including 2024).

In terms of analyst ratings, buy and hold ratings continue to dominate at 54.5% & 39.7% (from 54.2 & 39.9% respectively last wk (sell ratings unch at 5.8%)). That 54.5% in buy ratings is down from 57.5% in Feb ‘22.
Energy (63%), Communication Services (62%), and Information Technology (62%) sectors have the highest percentages of Buy ratings, while Consumer Staples (41%) has the lowest percentage of Buy ratings. Industrials and Utilities have the most sell ratings (8%).

And some other earnings stuff:


Economy
Over the past 2+ years part of my earnings optimism has been due to the economy holding up better than expected. While earnings only track the economy loosely (and markets look forward 6-12 months), there is a clear correlation between recessions, lower earnings, and lower stock prices (although stock prices (being as noted forward looking) generally fall in advance of the recession and bottom 6-9 months before the end of the recession). So if you can see a recession coming it is helpful, although very difficult (especially ahead of the market). You can reference this Week Ahead (see the Economy section) for a lot of material on how every recession is preceded by talk of a “soft landing” as close as a month before the start. On the IRA infrastructure act, the November 26 report has good info on how that should be supportive at least through the end of this year. That report also has the notes about how small caps have shorter debt maturity profiles and more of it.
As I’ve been stating since I switched to the Week Ahead posts in mid-2022, the indicators to me are consistent with solid (which at times has been robust) economic growth, and I have been a broken record that I “certainly [did] not think we’re on the verge of a recession (although as noted above every recession starts out looking like just some economic softening).” As some background,
several months ago I added: “That said, I’ve also noted over the past __ weeks or so [it got to 22], we have clearly started to see some moderation in key areas like consumption, manufacturing, construction, exports and housing.” Following that was a stretch of 10 weeks were I changed that to describe “the data [as] fairly strong, more consistent with what we’d been seeing at the start of the year.” That took a turn 6 weeks ago with some weaker than expected data, although as I caveated some of it was impacted by hurricanes or strikes and others like GDP and personal spending while softening remained at robust levels, but the “slew of data” three weeks ago confirmed my statement that “what I can say with confidence is all of this evidences an economy that is slowing from elevated levels but continues to grow at or above trend.”
This week the data was a bit stronger, particularly the employment report, although notably it was all services and government jobs with goods jobs falling outside of construction. Still it showed solid wage incomes which is one of the keys to the US economy. We also saw strong services PMIs, business spending (core capital goods orders ex-defense & aircraft), job openings (although quits and hires fell to multi-year lows), imports and exports, and low jobless claims. While there are enough caveats to say it doesn’t really yet represent a reacceleration of the economy, it certainly doesn’t look like one that is seeing materially softness either
So I don’t really see any changes to my overall takeaway on the economy from 15 weeks ago, “the situation continues to seem like manufacturing is subdued but trying to bottom, housing perhaps has inflected off the bottom [although that has softened of late with the jump in mortgage rates (although perhaps now buyers have become “used to” higher interest rates)], labor markets (and the services sector and construction in particular) are solid with very healthy wage growth, and productivity appears to be robust (something I think you’re going to be hearing more and more about)…I continue to feel that any softening does not appear to be morphing into a recession.”
And as I said 20 weeks ago:
without question, the evidence is building that the days of >3% real GDP growth are behind us (although we got there in Q3), and we should be happy to settle into something more around trend (1-3% real (infl adjusted) growth). That though is far from a disaster. The important thing will be to see the softening level out (L-shape) rather than continue to fall turning the “soft landing” into a recession.
So far that’s what we’ve seen.
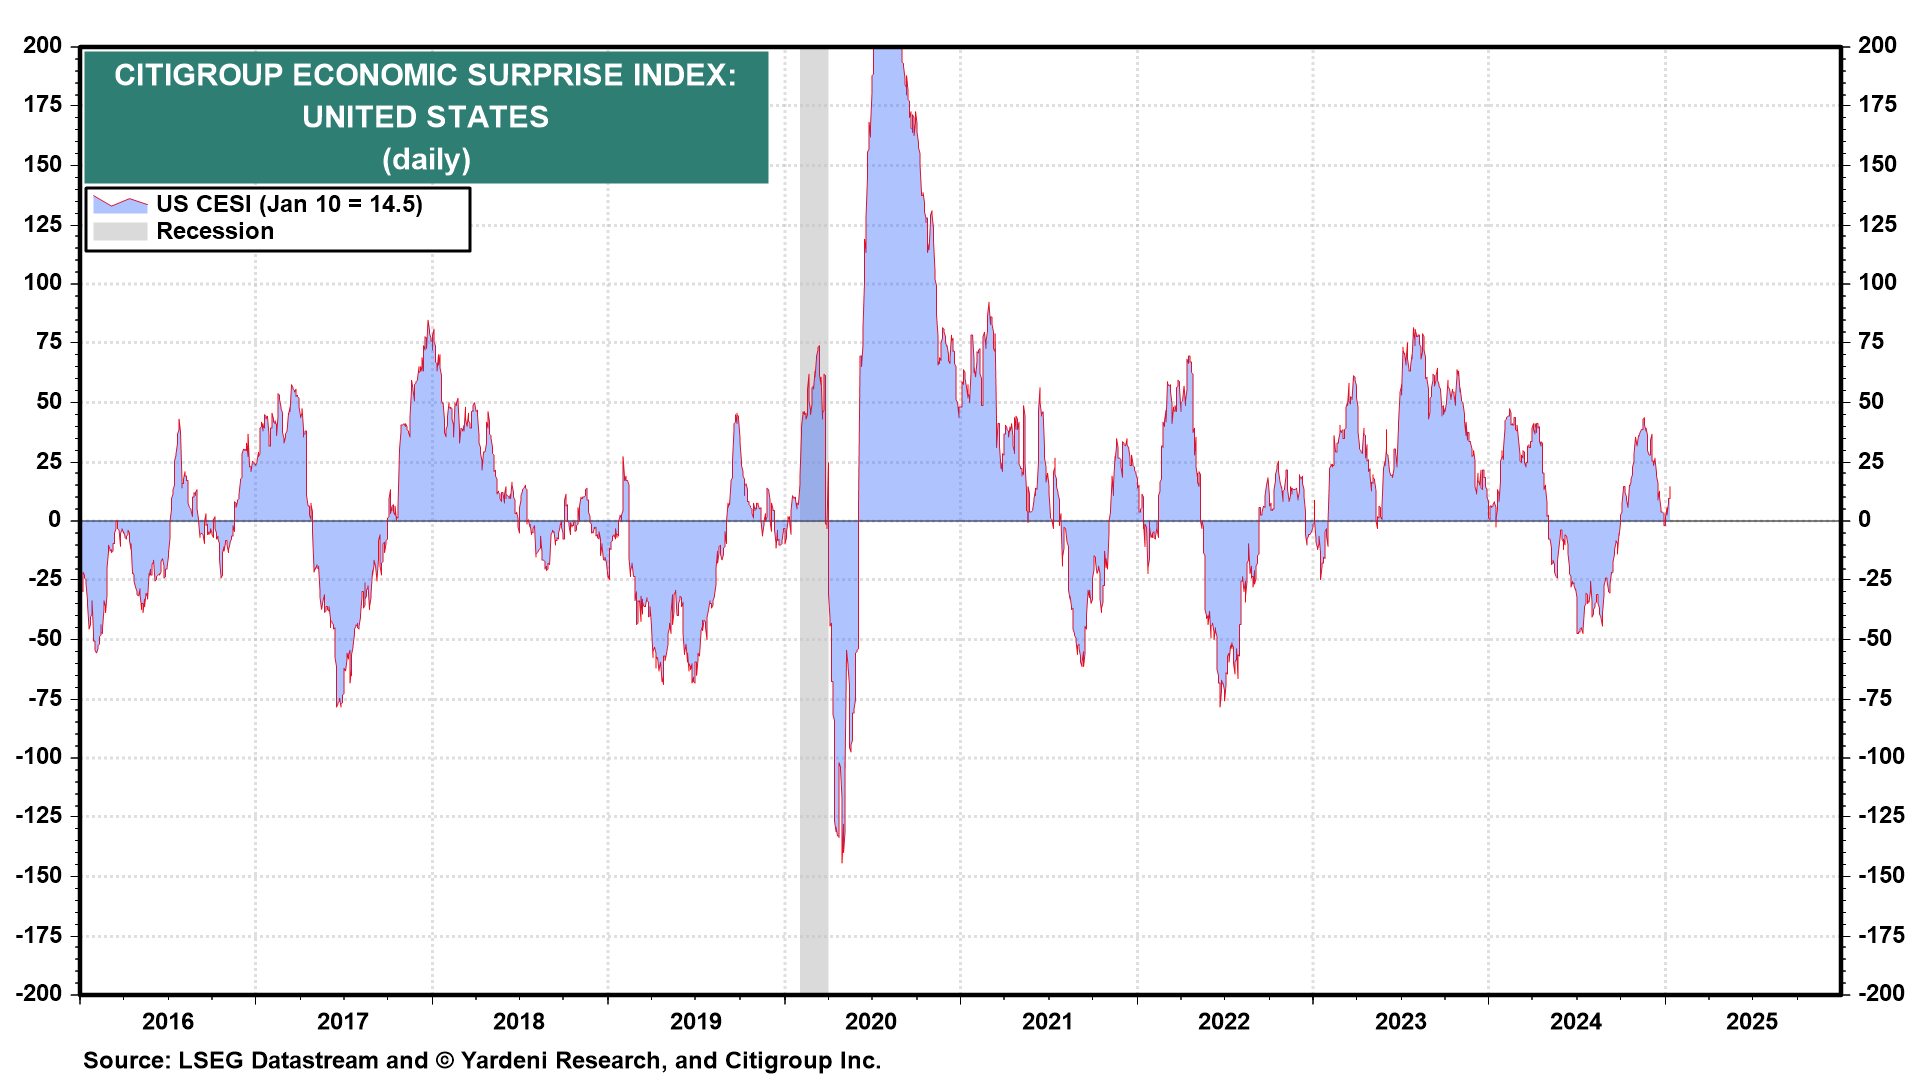
In that regard, the Citi Economic Surprise Index improved for a 2nd week +8.8pts to 14.5, the best in a month after falling for 6 weeks to the least since Sept and into negative territory on Dec 31st. It’s still down -28.8pts from the 43.3 five weeks ago, but now closer to the highs of 2024 (47.2 in Feb) than the lows (-47.5 in July).
https://yardeni.com/charts/citigroup-economic-surprise/
And GDP estimates are for now consistent with a no recession call (again though remembering GDP going into recessions generally doesn’t look like one is coming (it was up around 2% in Q2 & Q3 2008 well after the recession had started)). After Q3 was revised up to 3.1%, trackers for Q4 are mostly in agreement that we should see around 2% (trend) GDP growth again (with +2.7% from the Atlanta Fed (who has been pretty accurate, but jumps around a lot) as the highest).
Goldman (who was 3.0% for 3Q vs 2.8% actual 1st est) last I saw had their 4Q GDP estimate at +2.3%.

Atlanta Fed (who was right in line in its 3Q est of #GDP (and just a tenth off for 2Q from the 1st est)), saw its 4Q GDP estimate rise three tenths to 2.7% as of Thursday.


BoA (who as a reminder est’d 3.0% for 3Q vs 2.8% actual), finally updates their 4Q GDP tracking this week, dropping it three tenths from the last estimate Dec 23rd to 1.8%, the least since they started tracking in November. Their “official” house est is 2.0% y/y growth in 4Q.

NY Fed’s 4Q #GDP Nowcast (as a reminder, they had 2.91% for 3Q vs 2.8% 1st est) jumped this wk to 2.36% from 1.90%, mostly on the payrolls report (+0.20%) but also on the trade data (+0.16%). As a reminder, the NY Fed’s model is dynamic and so adjusts in real time as data evolves, and “parameter revisions” added +0.05%.
They raised their Q1 ‘25 GDP forecast even more to +2.74% from 2.11% on the same items.


And the St. Louis Fed GDP tracker, which outside of Q1 this yr (where it was the closest) has undershot actual real GDP since Q3 ‘22, jumped +0.70% to 1.91% for Q4 the closest it’s been to the other GDP trackers since it initiated its tracking.

The Weekly Econ Index from the @DallasFed (scaled as y/y rise for GDP), which runs a week behind other GDP trackers, saw a big drop of -0.69% to 2.01% in the week through Dec 28th although from an upwardly rev'd 2.70% the prior week (from +2.31% ) putting it back in the middle of its 2024 range (1.49 - 2.66%) that it left only twice (3 weeks ago at 2.77% & a month ago when it jumped to 3.21%)).
The 13-wk avg though edged up a tenth to 2.18%, evidencing overall economic momentum above trend.
https://www.dallasfed.org/research/wei

Other economy stuff:


Valuations
Like the other sections, I’ll just post current week items regarding the multiple. For the historical stuff, see the Feb 4th blog post.
With equity indices falling again this week, forward P/E’s did as well:
-The $SPX forward P/E down five tenths to 21.2 (down 1.1pts the last five weeks from the highest since mid-'21).
-Mid-caps (S&P 400) down a tenth to 15.8 (down -1.3pts the last six weeks from the highest since early-’21 (17.1)).
-Small caps (S&P 600) were down four tenths to 15.2 (now down -1.9pts the last six weeks from the highest since early-’21 (17.1)).
-Yardeni's “Megacap-8” (adds NFLX) P/E fell seven tenths for a 2nd week to 29.5, still +3.1 pts from the 26.4 it hit 16 weeks ago (which was the least of 2024) a little closer to the 31.5 it hit 23 wks ago (which was the highest since Jan ‘22)).
https://yardeni.com/charts/stock-market-p-e-ratios/

Other valuation stuff:


Breadth
Breadth reversed its two weeks of improvement to hit new multi-month lows on longer-term metrics, not quite as bad on shorter term.
The McClellan Summation Index ("what the avg stock is doing") turned back down after starting to hook higher the previous week now the least since Nov ‘23.

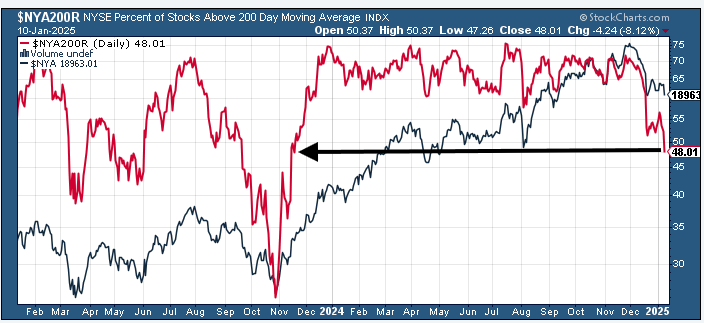
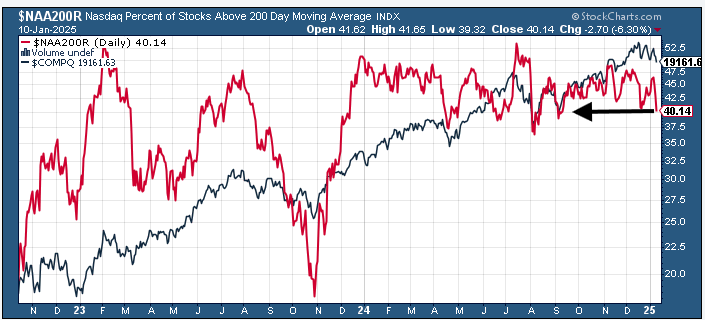
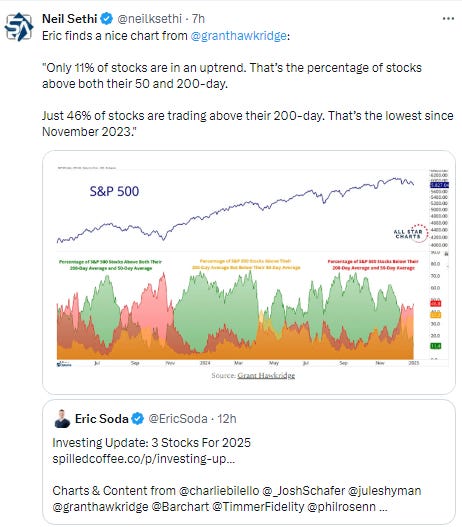
% of stocks over 200-DMAs turned back lower after seeing a 2-week bounce, now the least since Nov ‘23 on the NYSE and since Sept on the Nasdaq. The latter is better shape than the former, which is now under 50%, although both have now put in another lower high and are making lower lows.
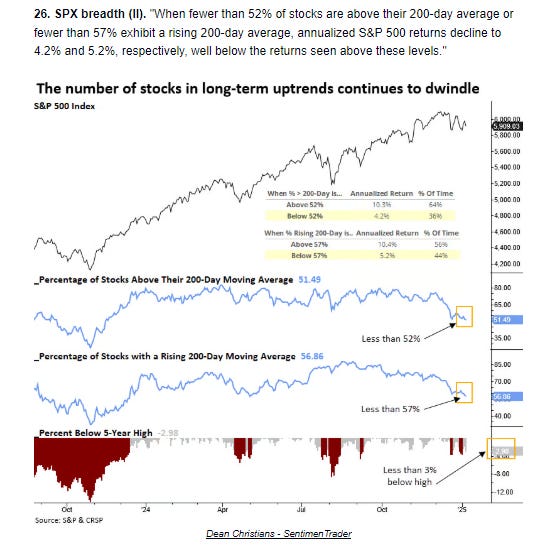

% of stocks above 50-DMAs, unlike those over 200-DMAs, haven’t broken their December lows although aren’t far away. Still a world away from where we were entering December.


% of stocks above 20-DMAs are further away from their December lows than those over 200 & 50-DMAs but outside of December are the weakest since August.


Value/Growth fell to the least since Jan ‘22 last week. I think at this point we can give up on using the action following Trump’s victory in 2016 (big jump before a big decline) as a playbook.

The equal-weighted SPX vs cap weighted ratio like value/growth fell towards its all-time lows last week, the least since July.

Stop me if you’re heard this before but IWM:SPY (small caps to large caps), fell back to near the least since July (which was the least since 2000).

Equity sector breadth based on CME Indices deteriorated actually improved w/w though with just 3 green sectors (up from 3), although no sector up over 1% (both were the previous week). Unlike the previous week where the megacap growth sectors showed relative weakness taking 3 of the bottom 5 spots, this week sectors were more distributed but still every red sector was down at least -0.7%, six down at least -1.9%, two down over -3% (Tech & RE).

SPX sector flag from Finviz consistent w/a little more green, but still plenty of red w/more than a few stocks bright red (-3% or more). But quite a few bright green (+3% or more).

Other breadth stuff:

Flows/Positioning
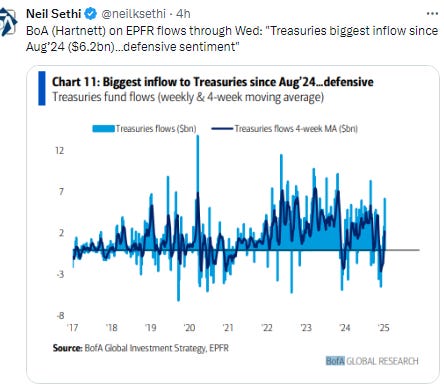
I didn’t have time to get into the fund flows data beyond what I posted on X during the week, but here’s what BoA had (basically big inflow to cash but also into equities (led by US (led by tech) but also China), bonds (broad based led by IG & Treasuries), and bitcoin):
$143.2bn to cash (biggest inflow since Apr’20), $25.6bn to equities, $21.6bn to bonds, $1.4bn to crypto, $0.5bn from gold.


ICI data on money market flows saw a +$66.1bn inflow in the week through Jan 8th, after ~+$962bn in 2024 and $1.15tn in 2023 with total MMF assets at $6.92tn, a record high. Both institutional (+$43.5bn) and retail (+$22.5bn) saw healthy inflows for a 3rd wk. In terms of totals, 60% is institutional, 40% retail.

Looking at CTA (trend follower) equity positioning, BoA says according to their models “trend followers may be in the process of unwinding S&P 500 and NASDAQ-100 longs with larger positioning remaining in the NASDAQ-100. Small caps were hit hard this week with the interest rate sensitive Russell 2000 declining by 3.5%. Our model indicates that that CTAs could be initiating Russell 2000 short positions soon.”
So, after being big sellers on the SPX & RUT four weeks ago, it looks like they might be returning to selling those (and perhaps turning short the RUT) as well as paring back their Nasdaq-100 (NDX) longs which they had held onto. The good news is it gives a lot of scope for buying at some point. The bad news is it will pressure prices in the short term.
Price trend strength remains strongest for the $NDX (61% down from 68%), versus the $SPX (43% down from 55%) and $RUT (just 4% down from 50% two weeks ago). #Japan’s #Nikkei225 continued to improve to 37% (from 8% four weeks ago) while the Euro #Stoxx50 is now 20% (from 12%). They see CTA’s following the direction of price in the latter two indices.

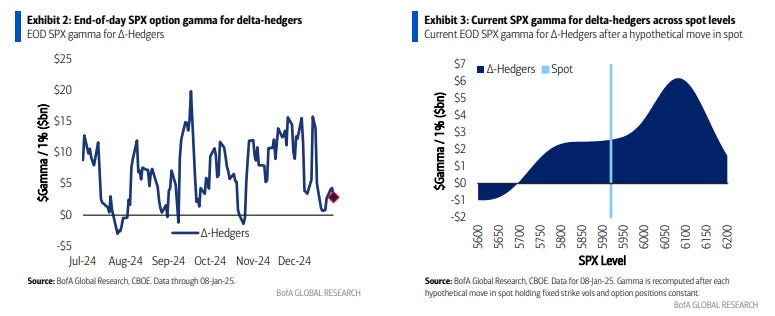
In terms of gamma positioning, BoA says after gamma fell sharply the previous week to just the 9th %ile, “SPX gamma has been positive but consistently minimal in size (e.g., gamma had a high of only $4.3bn this week).”
As I’ve noted weekly over the past year+, very high levels of gamma acted as a market stabilizer dampening volatility in both directions. When it’s fallen below $2bn or so we saw heightened volatility, and while it rarely was negative that was associated with even higher volatility. With gamma currently at the 21st %ile that is an improvement from the prior week, but still not providing much of a stabilizing force leaving the markets freer to move around (meaning higher volatility).
Also the “double hump” in BoA’s gamma estimates is gone, so now it’s mostly a story of positive moves in markets will build gamma (and stabilize volatility, which will feed further gains, etc.) while negative moves will draw down gamma leading to more volatility. A sharp move below 5700 will see gamma flip negative according to their estimates.
BoA est's that risk parity strategies were sellers of equities and bonds again last week, but they continue to add to commodities bringing allocations just above equities. Bonds continue to be heavily overweighted but as I suggested 12 wks ago, given the increase in bond volatility, that has been narrowing (which is likely adding to the pressure on bonds).
#oott

BoA est’s that volatility targeters (vol control), were little changed in their positioning for a second week after having been big sellers three weeks ago which took back most of the increase in positioning since October, consistent with my statement the past few weeks that “with equities remaining relatively volatile, I doubt we’ll see them rebuild much, if any.” That probably remains the case for the upcoming week.
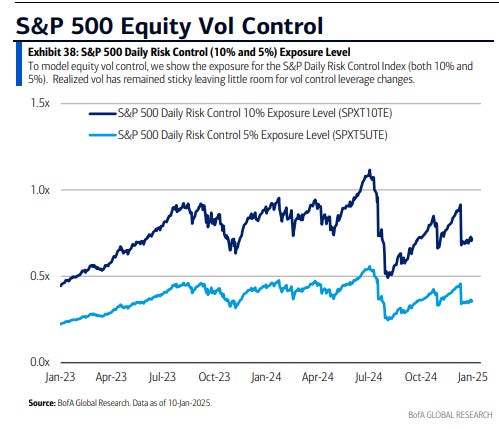
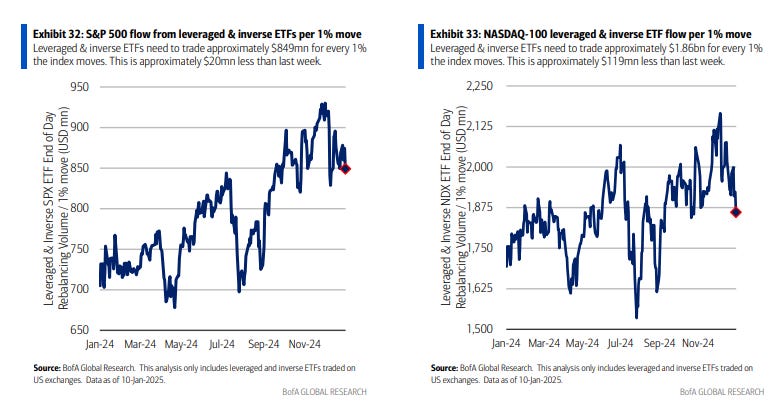
And BoA notes “the amount of both S&P 500 and NASDAQ-100 futures that leveraged & inverse ETFs would theoretically need to trade for each 1% [move] decreased with spot again "[last] week” with the SPX to the least since Nov & the NDX since Oct.

And after buybacks ended 2024 at a record, BoA sees some evidence of them slowing.


And some other notes on positioning:
Sentiment
Sentiment (which I treat separately from positioning) is one of those things that is generally helpful when its above average (“it takes bulls to have a bull market”, etc.) and when it’s at extreme lows. In between it doesn’t really tell you much. Three weeks I had noted “even before the selloff we saw sentiment fading back on some metrics, so I’d imagine when we get the readings this week, people will be much more cautious,” and since then we’ve broadly seen that. Not yet to where I’d say it’s a contrary tailwind, but getting there


The 10-DMA of the equity put/call ratio (black/red line) continued its choppy lift from around the lowest since July (which was the least since Apr ‘22) now the highest since mid-Nov indicating investors are becoming a little more interested in downside protection vs capturing upside returns.
When it’s increasing it normally equates to a consolidation in equities and increase in volatility and vice versa.


CNN Fear & Greed Index fell -5pts w/w to 27, the joint-least since Dec 19th, remaining just in “Fear,” but on the edge of “Extreme Fear” way below the 54 (“Neutral”) it was at a month ago. It was at 76 (“Extreme Greed”) a year ago.
Looking at the components:
Extreme Greed = None
Greed = junk bond demand
Neutral = market volatility (VIX & its 50-DMA);
Fear = 5-day put/call options (from Fear)
Extreme Fear = stock price strength (net new 52-week highs); stock price breadth (McClellan Volume Summation Index); market momentum (SPX >125-DMA) (from Fear); safe haven demand (20-day difference in stock/bond returns) (from Fear)
https://www.cnn.com/markets/fear-and-greed


BofA’s Bull & Bear Indicator (a global metric), saw its first rise in 13 wks, +0.2pts now from 3.2, which was nearly a 1-yr low, on “inflows to EM stocks, low 3.9% FMS cash levels, [and] hedge fund positioning in oil futures flipping bullish.”

Helene Meisler's followers turned to the most bearish in 7-mths after a 9-wk streak of bullishness, the longest stretch since 2021, at 53.7% voting next 100pts down, up from 37.3% the previous week (and 33.2% six weeks ago which was the least since Apr ‘21).
As a reminder this group is generally not a contrarian indicator, although they missed the December pullback.

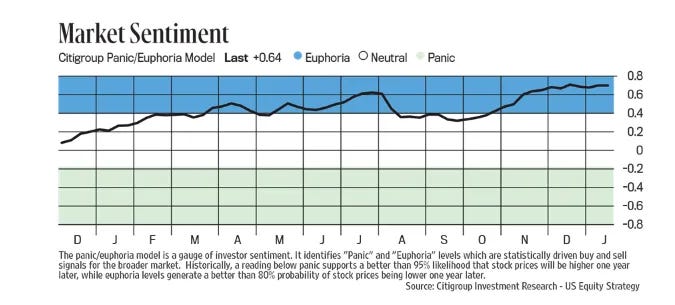
Link to Helene’s always insightful Saturday Chart Fest. FYI this is where I pull Citi’s Panic/Euphoria Index results from (she graciously updates it weekly). It remains around the highest in the past year+.
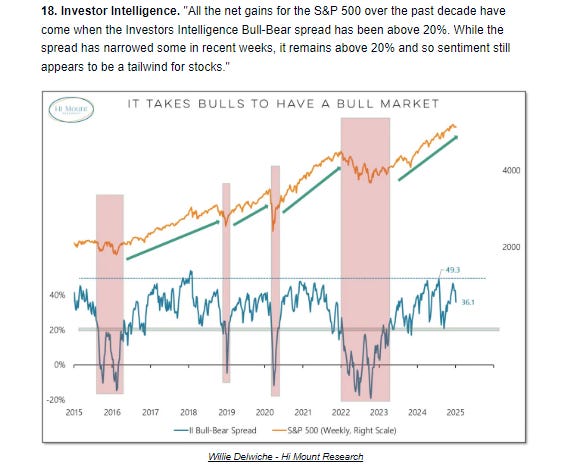
As a reminder, “[h]istorically...euphoria levels generate a better than 80% of stock probabilities being lower one year later.” In that regard, it first entered euphoria in late March (when the SPX was around 5200) and then reentered in late October (around 5800).

Seasonality
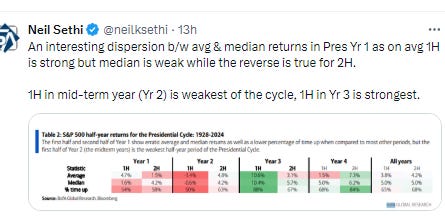
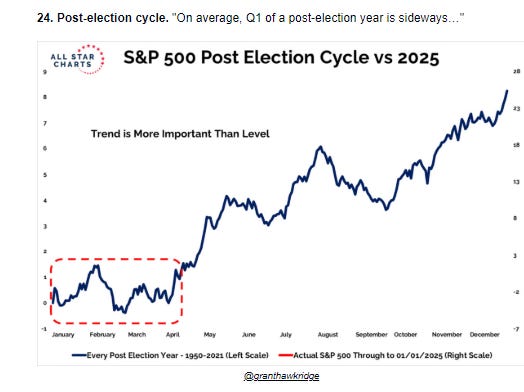
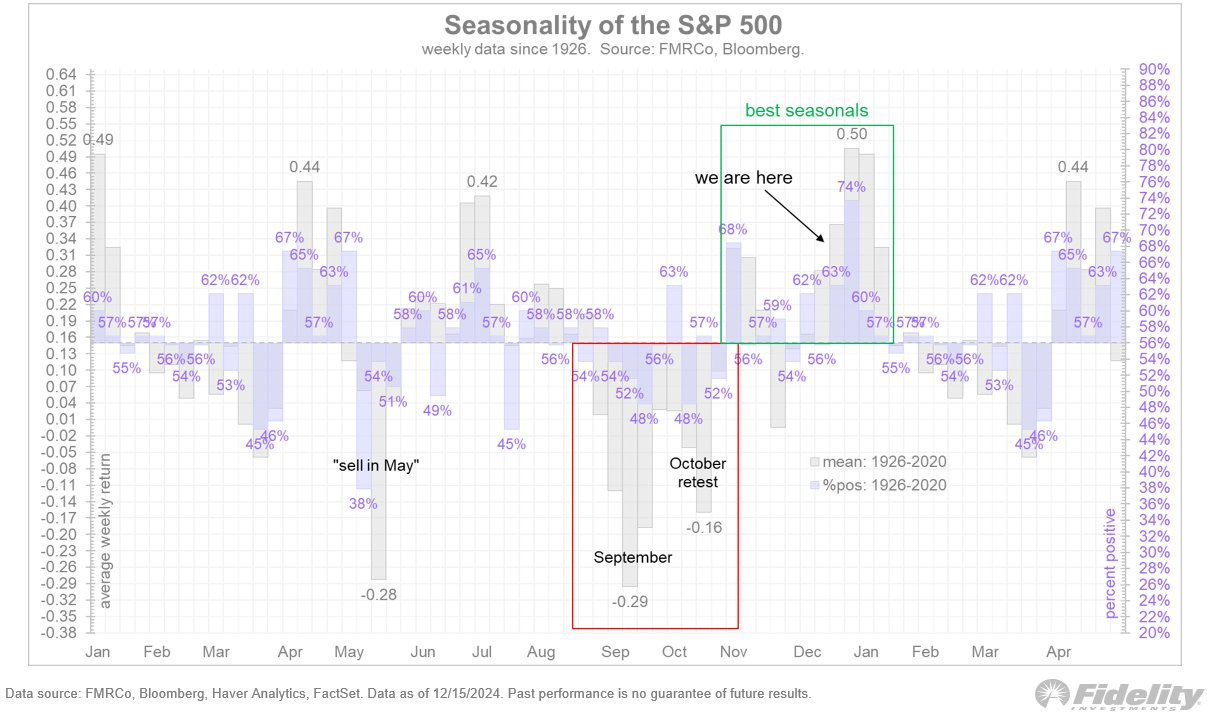
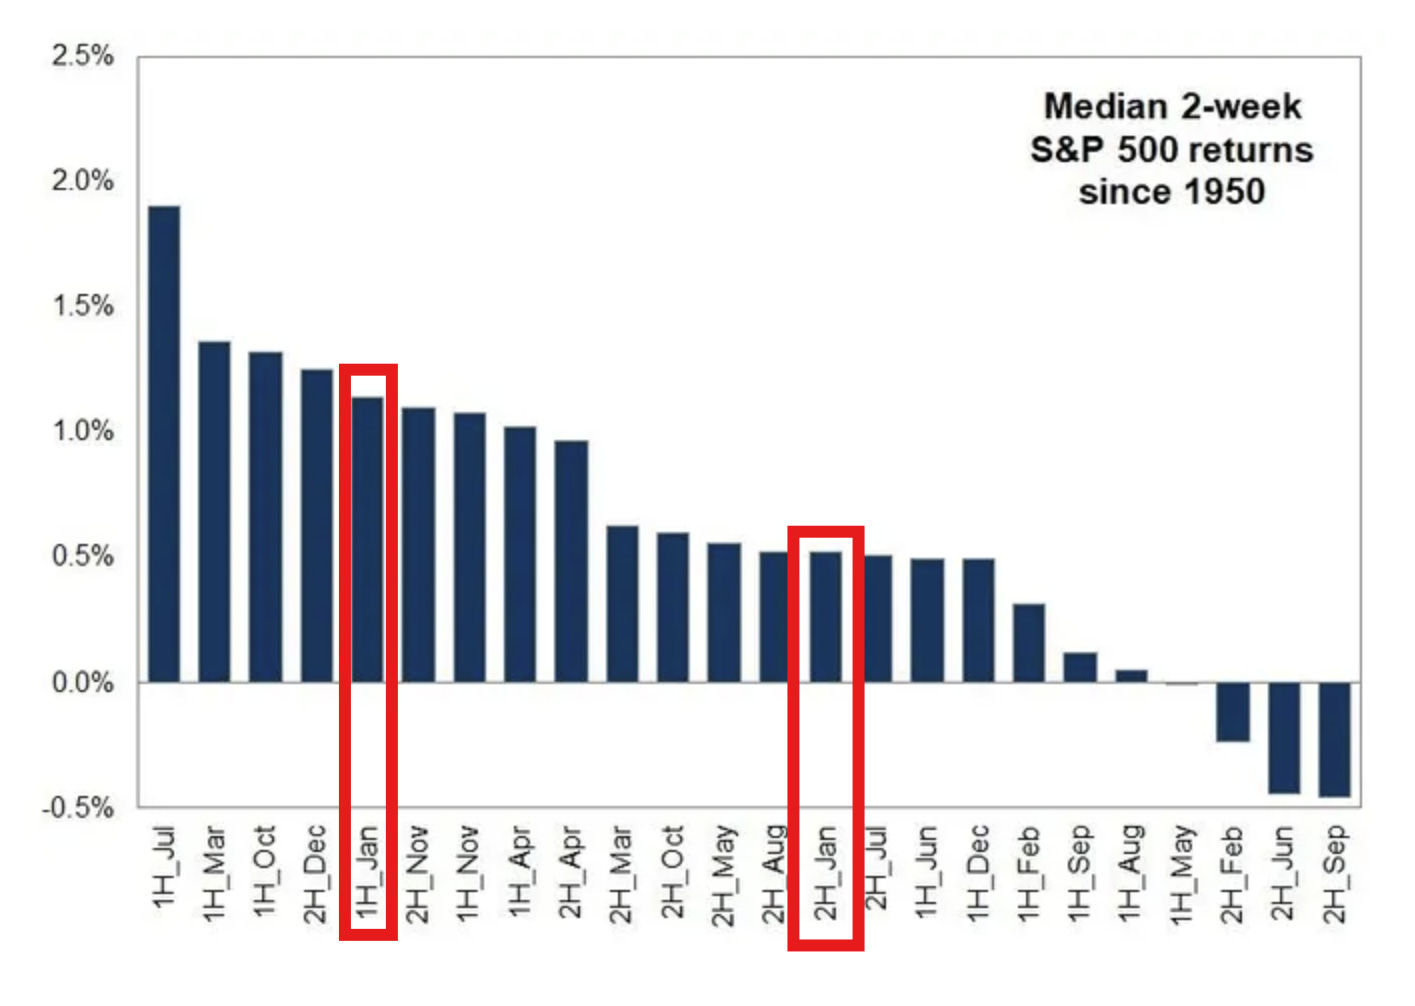
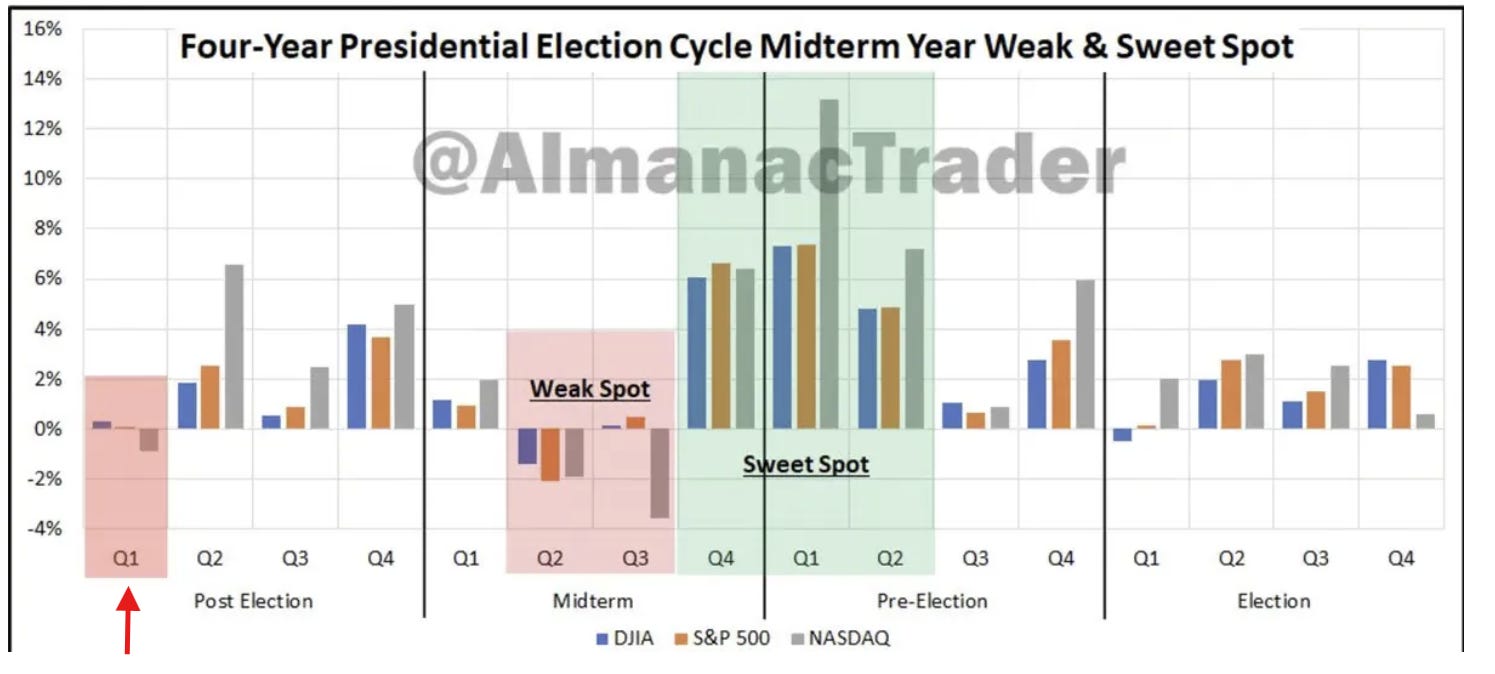
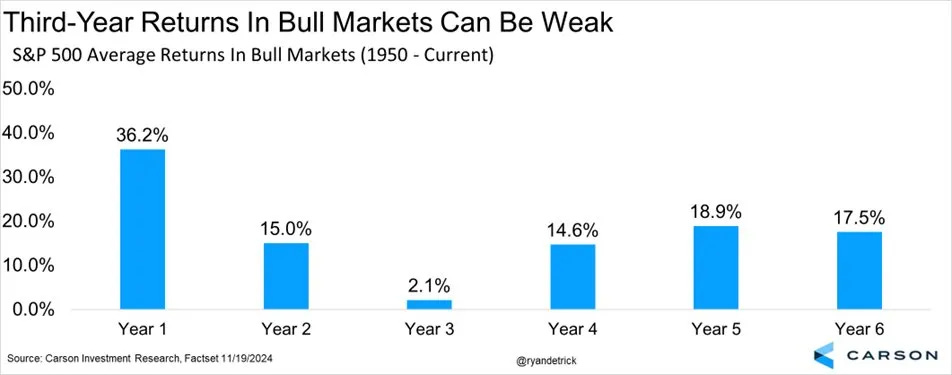
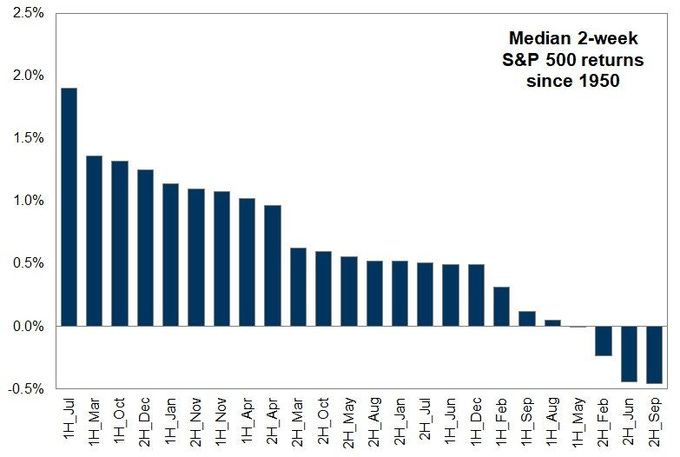
I had said 2 weeks ago, January overall is generally a good month for stocks. In all years the 1st two weeks of January are strong with solid returns and up two-thirds of the time with yr 1 of the Presidential cycle up 58% of the time by an average of 2% (before it gets much weaker in February and March (which also coincides with the fact that year 3 of bull markets are generally weak)). That said, the 1st half of January is generally less strong than the 2nd half (particularly in yr 1 of Pres cycle, which coincides with what we’ve seen), so that gives some hope that we might see a better end to the month before we get to the more challenging Feb/Mar time frame. But overall as I noted previously “while we continue to have a favorable seasonal backdrop for now as we move through 2025 we’ll be going from very strong seasonality to some of the weakest on the cycle clock. Of course, as always remember that seasonality is like climate. It gives you an idea of what generally happens, but it is not something to base your decision on whether to bring an umbrella (as the Santa Rally showed us).”


And as we consider seasonality, a really nice post from Callie Cox about how you need to take historical analogies w/a grain of salt (unless you've dug into the history). Her chart on Presidential election yr performance w/ & w/o 2008 (when the SPX was -17% in Oct) is a wonderful example.
https://www.optimisticallie.com/p/a-history-lesson

For references to all of the “up YTD through Feb” see the March 3rd post. For all the very positive stats through March (strong 1Q, strong two consec quarters, etc.) see the April 14h post.
For the “as January goes so goes the year”, see the February 4th Week Ahead.
Final Thoughts
I noted last week,
As we turn the page into the new year, we’re presented with a very different backdrop than what we saw for much of 2024 when the Fed was moving from hiking to cutting, bond yields were falling, seasonality was mostly favorable, systematic positioning was mostly a tailwind, political risk was low, valuations had room to grow, liquidity was very robust, the economy was firing on all cylinders, volatility (until early August) was more subdued, earnings were rebounding, etc. We took a step back with the yen carry trade, etc., issues in August, seemed to get back on track, but since the very strong September employment report (followed by sticky inflation reads) the road has been much tougher. In fact since the Sept employment report (Oct 4th) the SPX is up just 3%.
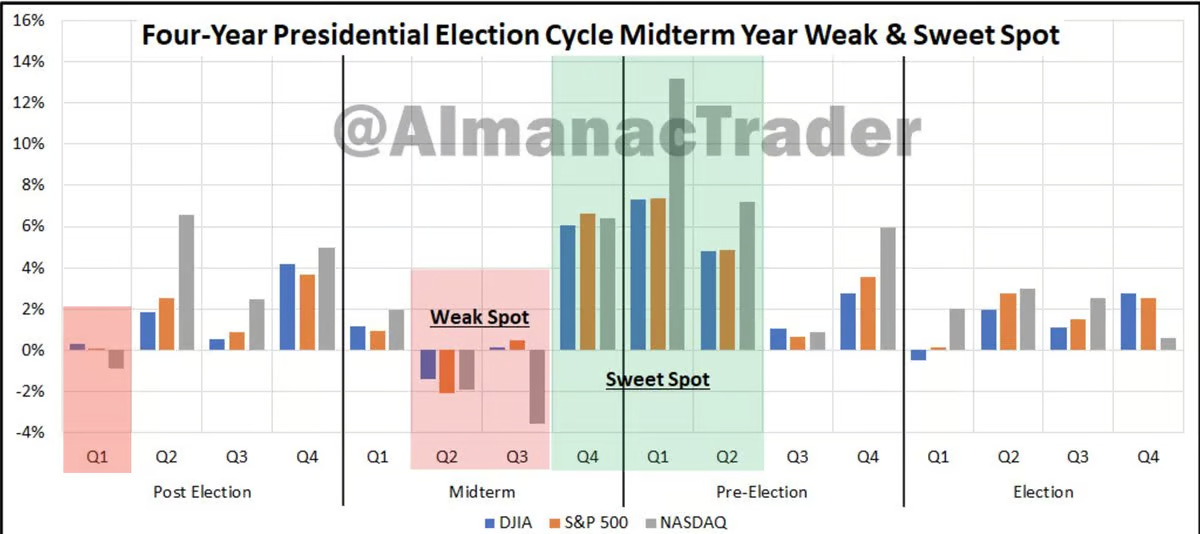
Now we enter what is historically a more challenging year (1st year of a Presidential term and 3rd year of a bull market) with valuations well above where we started 2024, high expectations (judging from analyst SPX forecasts), likely higher volatility and political risk, no current tailwinds from systematic positioning, weak breadth (although that wasn’t much of a problem in 2024), much higher bond yields (particularly real yields), a Fed talking more about fewer than more cuts and continuing to drain liquidity that is now hitting levels we’ve run into issues in the past, an upcoming buyback blackout window, high earnings expectations, etc.
It doesn’t mean that we can’t have a good or even a great year. Balance sheets remain very solid as does the economy and labor markets (even if slowing), earnings are expected to be very good, buybacks are expected to be a solid tailwind, there’s a lot of scope for the Fed to become less hawkish, the upcoming administration may provide big tailwinds in tax cuts, deregulation, etc., etc. But we need to see all of those come through, and disappointments are not going to be welcomed given the set-up, so my expectation is for choppier markets more like we’ve seen since October than what we saw before.
And so far, “a more challenging year” is what we’ve seen. I expect at some point things will settle down, but January is chock full of catalysts. This week we have the inflation reports (particularly CPI). I’d also keep my eye on the NY Fed inflation expectations number. The following week we have Trump coming into power, and a flurry of executive orders plus a lot of general “Trump speak” which is a complete wildcard. The week after that we have the Jan Fed meeting (followed by the personal income & spending report w/PCE prices). During that period we’ll get 60% of SPX earnings (including most of the Mag-7 (which also means during the next few weeks they will be offline from buybacks)). I think once we get through all of those landmines we’ll have a much better (though far from complete until we get a couple more NFP & PCE reports and some more time with the new administration) feel on things. But for now, the tailwinds which kept markets grinding higher in 2024 are mostly sidelined, which is where you’ll find me for the most part.
And as always just remember pullbacks/corrections are just part of the plan.


Portfolio Notes
Sold out of VNM, INDA, NKE, DAL, trimmed JWN, FXI, KSS, LYG, WBA, STWD, PYPL, CTRA, VZ, BEP, VICI, CZR, ON, KLG, KHC, FRT, KIM, GIS, TCEHY
Bought SHY, SCHD (new), FCX, PANW, ETSY, ASML, CVE,
Cash = 32% (held mostly in SGOV, MINT & BOXX (BOXX mimics SGOV but no dividend, all capital appreciation so get long term capital gains if you hold for a year) but also some non-TBill (>1yr duration) Treasury ETF’s (if you exclude those longer duration TBill ETF’s, cash is around 11%)).
Positions (after around the top 20 I don’t keep track of their order on a frequent basis as they’re all less than 0.5% of my portfolio).
Core positions (each 5% or more of portfolio (first 2 around 10% each, total around 25%) Note the core of my portfolio is energy infrastructure, specifically petroleum focused pipelines (weighted towards MLP’s due to the tax advantages). If you want to know more about reasons to own pipeline companies here are a couple of starter articles, but I’m happy to answer questions or steer you in the right direction. https://finance.yahoo.com/news/pipeline-stocks-101-investor-guide-000940473.html; https://www.globalxetfs.com/energy-mlp-insights-u-s-midstream-pipelines-are-still-attractive-and-can-benefit-from-global-catalysts/)
EPD, ET, PAA, SHY
Secondary core positions (each at least 2% of portfolio)
ENB
For the rest I’ll split based on how I think about them (these are all less than 2% of the portfolio each)
High quality, high conviction (long term), roughly in order of sizing
ENB, CTRA, GILD, GOOGL, PYPL, SCHW, PFE, ARCC, AM, TRP, T, XOM, SHEL, JWN, TPR, KHC, ADNT, CVS, O, GSK, EQNR, CMCSA, APA, DVN, OXY, JWN, RHHBY, TLH, NTR, E, ING, VZ, KMI, VSS, FSK, VNOM, TFC, MPLX, KMI, VOD, CVX, ING, HBAN, STLA, NEM, CCJ, BTI, AES, RRC, BWA,FRT, BMY, SLB, VICI, DGS, ADNT, WES, MPLX, CVE, KIM, MTB, BAYRY, SOFI, BEP, BIIB, SAN, TEF, SCHD, KVUE, KT, SQM, ALB, F, MAC, MFC, GPN, CI, LYG, NKE, ORCC, LVMUY, EMN, NVDA, BCE, KEY, BAX, SNOW, RTX, PANW, ETSY, BAC, GD, UPS, M, TD, ON, BIO, GIS, OCSL, MSM, VRSN
High quality, less conviction due to valuation
Higher risk due to business or sector issues; own due to depressed valuation or long term growth potential (secular tailwinds), but at this point I am looking to scale out of these names on strength. These are generally smaller positions.
ILMN, AGNC, FXI, LADR, URNM, URA, STWD, PARA, CFG, YUMC, ORAN, KSS, CHWY, TIGO, TCNNF, TCEHY, JD, WBA, ACCO, KVUE, KLG, CLB, HBI, IBIT, UNG, EEMV, SABR, NSANY, VNQI, ST, SLV, WBD, BNS, EWS, IJS, NOK, SIL, CURLF, WVFC, VTRS, NYCB, ABEV, PEAK, LBTYK, ARE, RBGLY, LAC, CMP, CZR, BBWI, LAC, EWZ, CPER, MBUU, HRTX, MSOS, SIRI, M, CE,
Note: CQP, EPD, ET, MPLX, PAA, WES all issue K-1s (PAGP is the same as PAA but with a 1099).
Reminder: I am generally a long term investor (12+ month horizon) but about 20% of my portfolio is more short term oriented (just looking for a retracement of a big move for example). This is probably a little more given the current environment. I do like to get paid while I wait though so I am a sucker for a good well supported dividend. I also supplement that with selling calls and puts. When I sell a stock, I almost always use a 1-2% trailstop. If you don’t know what that is, you can look it up on investopedia. But that allows me to continue to participate in a move if it just keeps going. Sometimes those don’t sell for days. When I sell calls or puts I go out 30-60 days and look to buy back at half price. Rather than monitor them I just put in a GTC order at the half price mark.
To subscribe to these summaries, click below (it’s free).
To invite others to check it out,