


The Week Ahead - 3/23/25
A comprehensive look at the upcoming week for US economics, equities and fixed income

If you're a new reader or maybe one who doesn’t make it to the end feel free to take a second to subscribe now. It’s free!
Or please take a moment to invite others who might be interested to check it out.
Also please note that I do often add to or tweak items after first publishing, so it’s always safest to read it from the website where it will have any updates.
As a reminder, some things I leave in from prior weeks for reference purposes, because it’s in-between updates, it provides background information, etc.. Anything not updated this week is in italics. As always apologize for typos, errors, etc., as there’s a lot here, and I don’t really have time to do a real double-check.
For new subscribers, this is a relatively long post. The intent is to cover the same areas each week. Sometimes the various areas are more interesting, sometimes less (lately more), but it’s easier just to go through them all, so you can expect this format (with things in the same places) each week.
The main sections are intended to cover 1) what’s upcoming next week, 2) what the Fed and rates are up to, 3) what’s going on with earnings (which are the most important determinant to stock prices over the long term), 4) what’s going on with the economy (both because of its impact on our daily lives (I am a business investor in my “real” job) but also because it impacts earnings), 5) valuation, 6) breadth (which gets into sector/style performance), 7) positioning (this is the most important determinant to asset prices in the short term, particularly institutional/corporate flows), 8) sentiment (really only matters at extremes though), 9) seasonality (gives you an idea of what normally happens), 10) “Final Thoughts” (remember you get what you pay for there), and 11) my portfolio (to be transparent about where my money is in the market, although note that first I’m not the greatest at keeping it super-accurate (and it is most definitely not intended as financial advice) and second as I mentioned earlier my main job (and investing assets) are in private industries (RE & venture capital)).
The Week Ahead
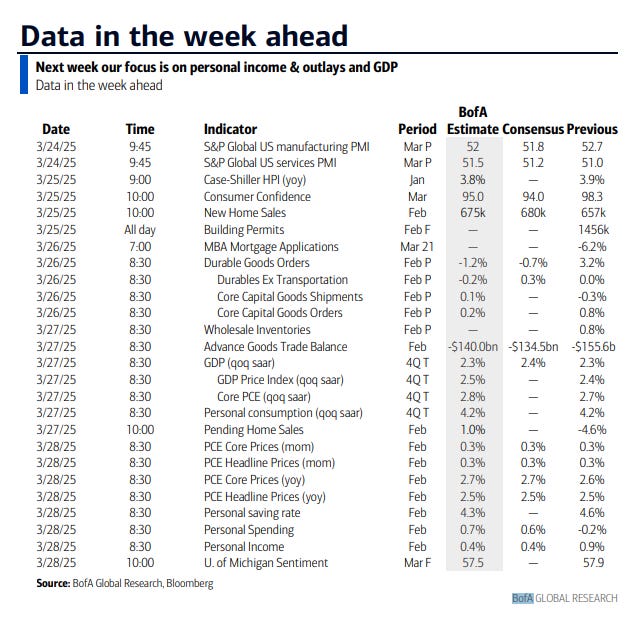
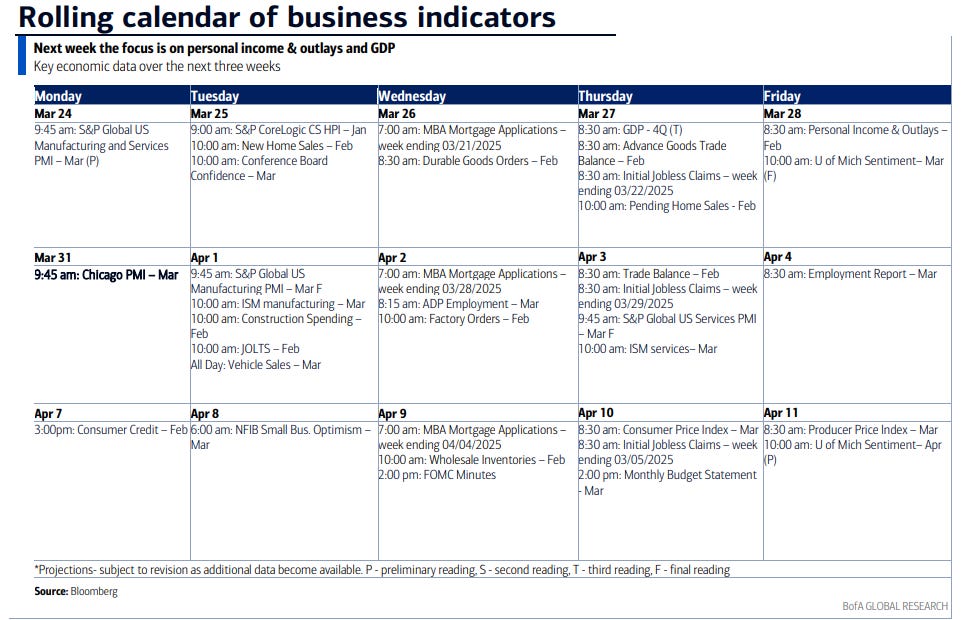
It’s the last week of the month, which for US economic data generally means we get flash PMI’s, updates on quarterly reports (this week just the final read on 4Q GDP, next month will be more impactful), final reads on some consumer confidence reports (including the UMich the 5-yr inflation expectation component Powell dismissed last week in part because it was “preliminary” (well, this one will be “final”) and the Conf Bd’s confidence number which is expected to be the lowest in 4 yrs), new and pending home sales, and what would be the highest profile report of the month if it didn’t come so late in the personal income and spending report along with PCE prices, our most complete look at income, consumption, and inflation.
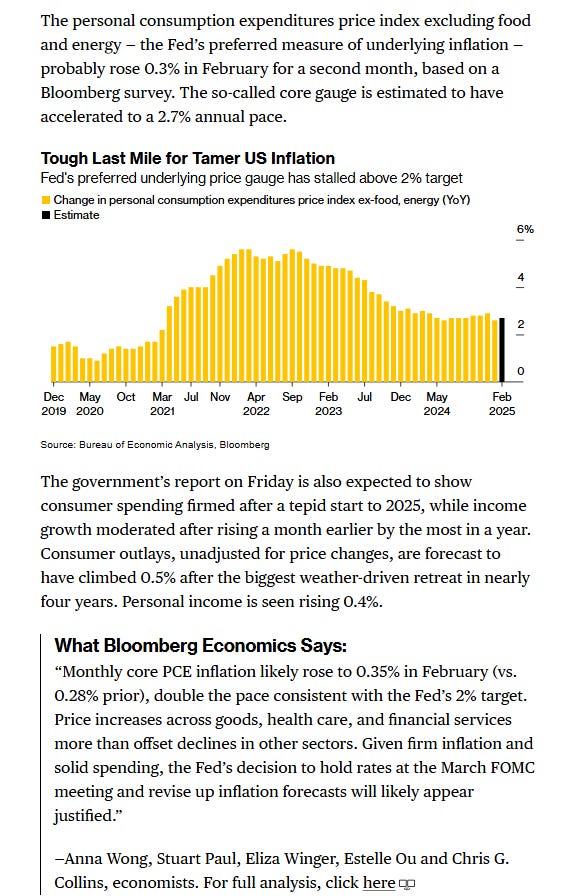
We already know that the PCE prices number (as did the Fed when they raised their 2025 estimates last week) is likely to come in hot, but it will be interesting to see if that still causes a negative market reaction when we get the actual print (especially considering there is considerable “round up” risk given most estimates are somewhere around the halfway mark between 0.3% m/m and 0.4%, and it could easily be the hottest m/m print since Jan of last year). Regardless, the print is completely inconsistent with 2% y/y inflation. The report is also expected to show consumer spending firmed after a tepid start to 2025, while income growth moderated after rising a month earlier by the most in a year.
We’ll also get advance looks at Feb goods trade balance (in particular the import number will be a focus given the kerfuffle last month around that) and durable goods orders (which includes the core capital goods shipments number which feeds into GDP and the orders number will tell us about biz capital spending plans), along with the repeat home buyer price indices (for Jan) and our normal weekly reports (mortgage applications, jobless claims, and EIA petroleum inventories). So a pretty busy week.
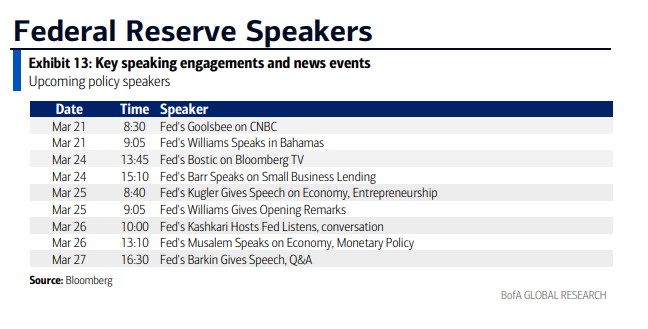
In terms of Fed speakers this week, we’ll get plenty with the blackout over, so some lingering questions you have about how they’re thinking about things may be addressed in some form or fashion (which we already got some of last week). BoA has Bostic, Barr, Kugler, Williams, Kashkari, Musalem, and Barkin listed. BBG adds that we’ll have Bostic and Barr (again) on Friday (and I’m sure there will be others).
Treasury auctions pick back up with our standard “end of the month” trifecta of 2, 5, & 7-yr auctions ($69bn, $70bn, & $44bn respectively) on Tues, Wed, & Thurs. I would imagine given the relative scarcity of the safest collateral with the debt ceiling limiting some Treasury issuance these will continue to be solid, but we’ll see.
In terms of earnings in the upcoming week, we’ll get six SPX reporters (Factset says two are reporting 4Q and four 1Q) but none >$100bn. We’ll also get a rare (this year) IPO, with American cloud computing firm CoreWeave (CRWV) expected to debut on the Nasdaq this week. The Nvidia (NVDA)-backed company plans to raise as much as $2.7B and is looking for a valuation reaching $26B.
Finally, it is the week after options expiration week, which as noted in the Positioning section will release a lot of options which will free up markets to move in either direction, so we’ll see where that takes us.

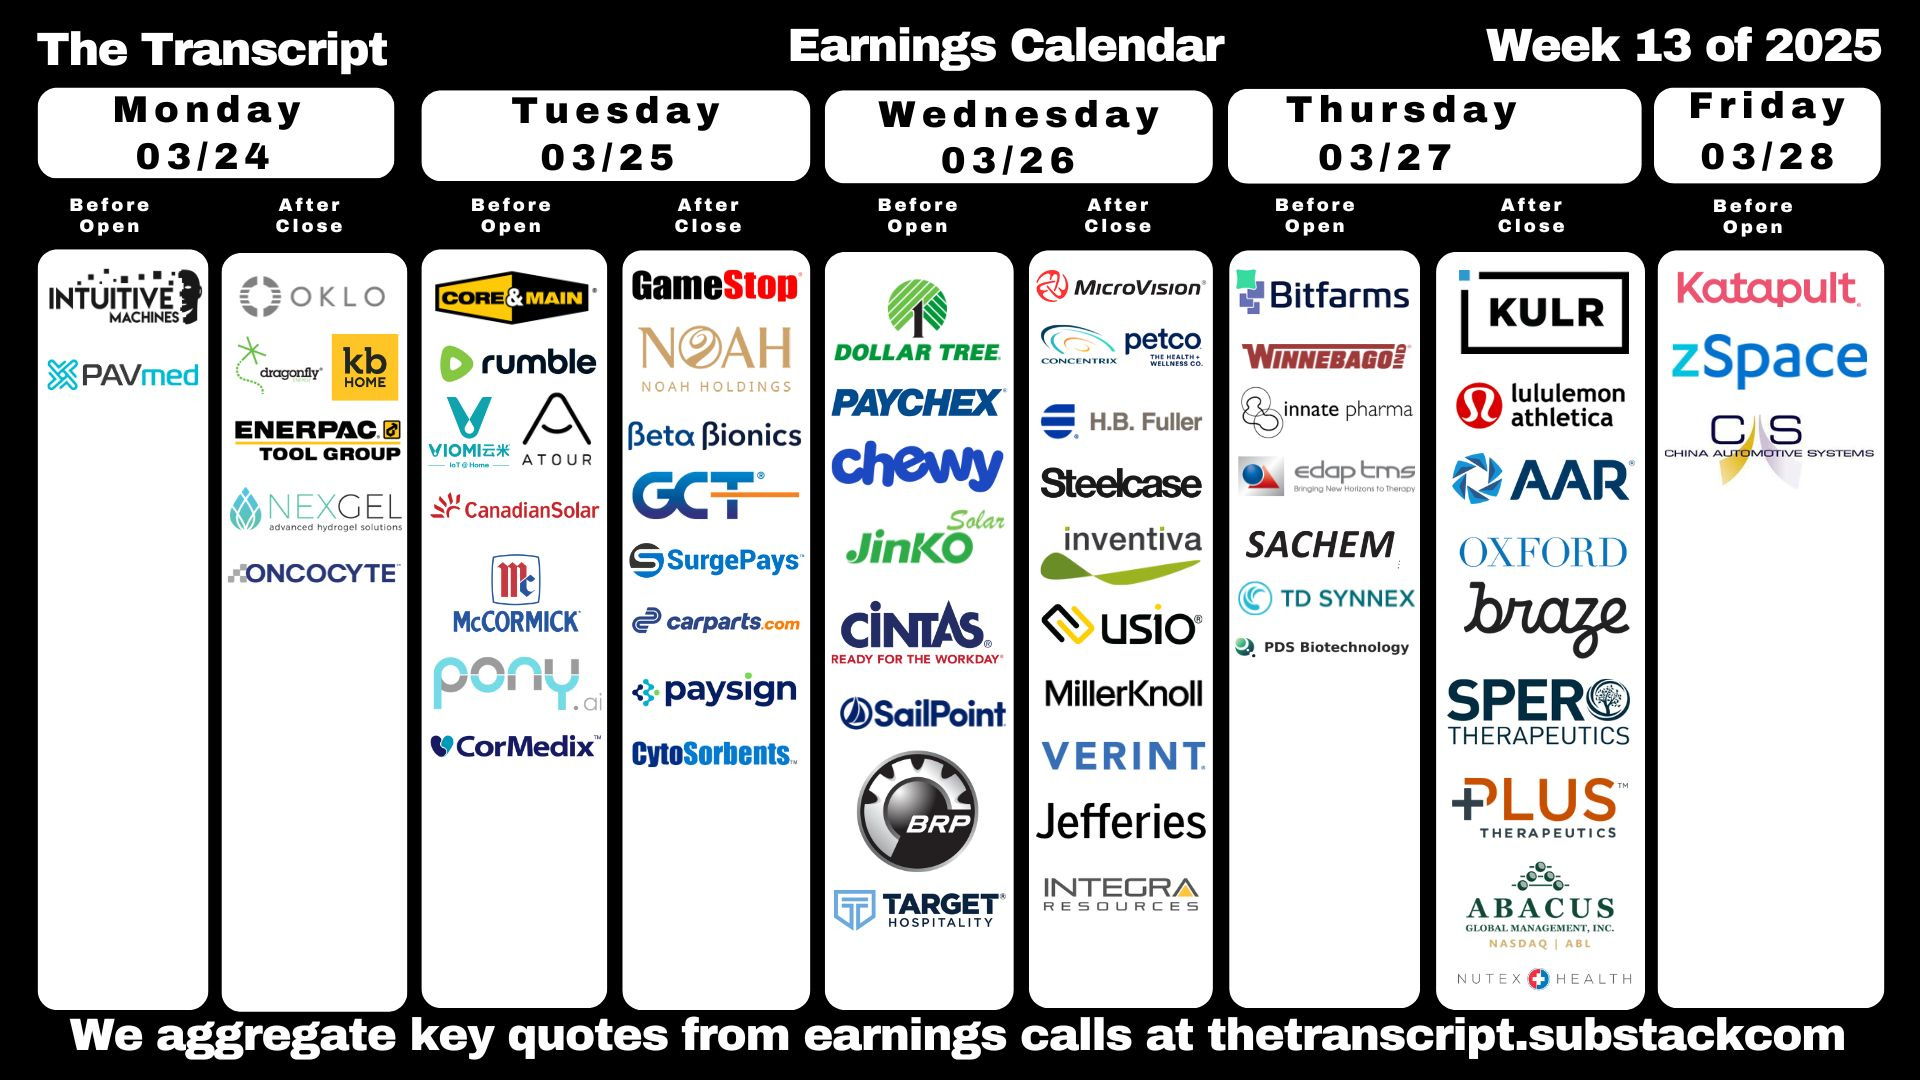
From Seeking Alpha (links are to their website, see the full earnings calendar):
Earnings spotlight: Monday, March 24 - KB Homes (KBH), Oklo (OKLO), and Enerpac Tool Group (EPAC).
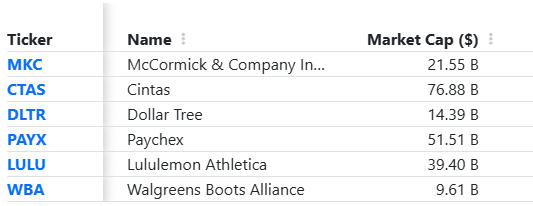
Earnings spotlight: Tuesday, March 25 - McCormick & Co. (MKC), GameStop (GME), Core & Main (CNM), Smithfield Foods (SFD), and Pony AI (PONY).
Earnings spotlight: Wednesday, March 26 - Cintas (CTAS), Paychex (PAYX), Dollar Tree (DLTR), Chewy (CHWY), and Jefferies Financial Group (JEF).
Earnings spotlight: Thursday, March 27 - Lululemon Athletica (LULU), TD SYNNEX (SNX), Braze (BRZE), AAR (AIR), and Winnebago Industries (WGO).

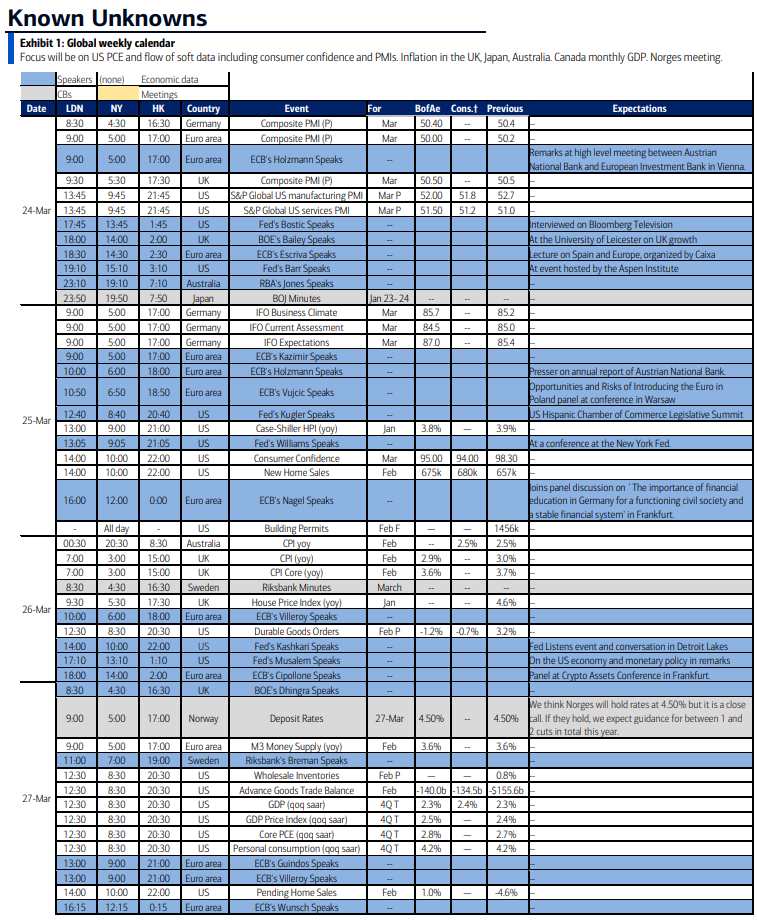
Ex-US, highlights are global flash PMI’s, UK Chancellor Reeves presenting her fiscal update on Wednesday that is expected to feature cuts to spending and welfare along with numerous data points including CPI and retail sales (along with an appearance from BoE head Bailey), Canada GDP (with the backdrop of PM Carney calling for elections), and Germany’s Ifo index of biz confidence. We’ll get policy decisions from the central banks of Norway (a close decision ) and Mexico (half point cut expected) among several others.

In Canada, for the next month attention will be laser focused on the parlimentary elections Mark Carney has called for April 28th. The Bank of Canada will release a summary of deliberations that led to its seventh straight rate cut, as officials weighed a pickup in core inflation against the economic impact of Trump’s trade threats. Also due in Canada are GDP data, including a flash estimate for February, which may reflect a surge in exports as US importers scrambled to front-run higher tariffs.
In Asia, it’s a relatively light schedule. First on the docket is an early look at manufacturing activity in March, with preliminary purchasing managers index readings from Australia, Japan, and India. Factory activity has been relatively anemic in recent months, barring a few exceptions, as tariffs loom and domestic and international demand cools. There’s also a series of inflation readings for February, starting with Singapore consumer price data on Monday set to show a slight slowdown. Australian CPI is out on Wednesday, as price increases likely held around 2.5% — above the central bank’s comfort level. Japan producer prices for services, also reported on Wednesday, are expected to show inflation continuing to pick up in line with the government’s goal. Wednesday is also likely to see Sri Lanka’s central bank keep rates unchanged. Taiwan’s industrial production activity in February comes Tuesday, and will provide a gauge of demand for chips and other technology as tariffs loom. That’s followed a day later by Singapore industrial production numbers, expected to show a drop in monthly activity.
Chancellor of the Exchequer Rachel Reeves will present her UK fiscal update to parliament on Wednesday, and probably unveil cuts to spending and welfare. Borrowing is on track to overshoot her projections in the fiscal year that ends imminently, and independent forecasts may show a need to heap on more debt. Reeves said Sunday that the UK government will aim to slash the number of civil servants by 10,000. The same day as the fiscal update, UK inflation will be a highlight after Thursday’s Bank of England’s decision to keep borrowing costs unchanged in the face of heightened trade uncertainty. Price growth is seen slowing slightly, to 2.9% — still well above the 2% level targeted by policymakers. Retail sales come on Friday, as well as a final reading of GDP for the fourth quarter. Also of interest will be appearances by BOE Governor Andrew Bailey on Monday, followed on Thursday by Swati Dhingra, the sole official who voted for a cut.
In Germany, where a huge fiscal package to retool the country’s defenses passed its final parliamentary hurdle on Friday, the closely-watched Ifo index of business confidence will be released on Tuesday, with all gauges expected to show improvement. In the wider euro zone, PMIs are coming on Monday, and economic confidence along with the European Central Bank’s measure of inflation expectations will arrive at the end of the week. Consumer-price readings from France and Spain are also due on Friday. Several policymakers are scheduled to speak, including ECB Executive Board member Isabel Schnabel in London on Thursday. Turning to the Nordics, Sweden’s Riksbank on Wednesday releases minutes from its latest meeting, where officials kept rates on hold and reiterated an end to easing. The country’s economic tendency survey is due the same day. Norway’s central bank faces a close decision on Thursday on whether to deliver its long-communicated first rate cut from 4.5%. A surprise surge in inflation in the past two months, together with data showing a resilient labor market and stronger economic activity, might prompt another postponement. Several other central bank decisions are scheduled across the wider region:
Lesotho, whose currency is pegged to the rand, is likely to follow South Africa’s central bank and leave its key rate unchanged at 7.25% on Tuesday.
The same day, Hungarian Governor Mihaly Varga helms the first monetary meeting of his tenure. The central bank is widely expected to keep its rate at 6.5% for a sixth month after a resurgence of inflation.
Czech policymakers will set borrowing costs in Prague the following day. No change is expected.
Also on Wednesday, Mozambique officials are poised to cut their key rate for an eighth straight time to boost an economy shaken by months of unrest.
And in Ghana on Friday, the central bank will probably stand pat on borrowing costs for the third time in a row to curb sticky inflation.
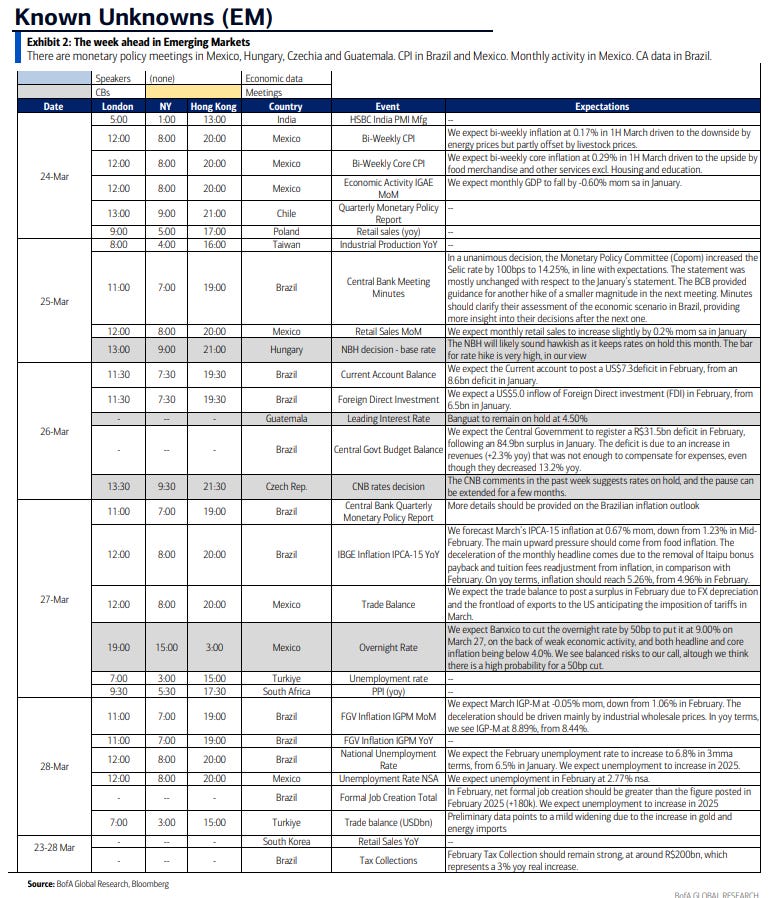
In Brazil, the central bank posts minutes of its March 18-19 meeting, where policymakers delivered a third straight 100 basis-point rate hike, to 14.25%. The post-decision statement was less hawkish than some had expected, with forward guidance confined to tipping a smaller hike at the next meeting in May. Analysts see a further 100 basis points of tightening before the fourth quarter. On Thursday, the central bank’s quarterly monetary policy report may sound much like December’s: expect higher rates and slower growth along with persistently elevated inflation prints. The mid-month inflation report will likely show consumer prices drifting further above policymakers’ 3% target from mid-February’s 4.96% print. Chile will report February unemployment while the central bank there posts its quarterly inflation report. Growth and inflation are above its forecasts, suggesting output is running above potential. Banxico policymakers get fresh economic growth and consumer price data ahead of their Thursday rate decision. Inflation is back within the target range but more to the point, analysts are marking down Mexico’s 2025 and 2026 GDP forecasts, with the OECD even predicting a recession this year and next. Analysts in the latest Citi survey unanimously expect Banxico, led by Governor Victoria Rodriguez, to cut the key rate by a half-point for a second straight meeting on March 27, to 9%.
And here’s BoA’s cheat sheets.


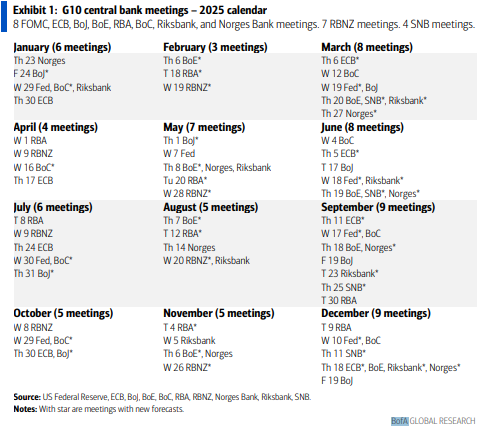
And here’s calendars of 2025 major central bank meetings.

Market Drivers
So let’s go through the list of items that I think are most important to the direction of equity markets:
Fed/Bonds
As noted previously this was one of the sections that had grown unwieldy, so I’ve really pared it down. Given I provide daily updates on Fed expectations, Fedspeak, and analyst thoughts on the Fed, it’s duplicative (and time consuming) to gather it all again so, again, I encourage you to look at those (the daily posts) for updates. I will just give more of a quick summary.
A little background information (you can skip down a few paragraphs if you’ve been reading each week). I noted in late December,
Markets have taken 2025 pricing down to less than two cuts with just around a 50/50 chance of a cut in the first half of the year. After 100bps of cuts so far, just a few cuts before a prolonged hold would be consistent with the 90’s “soft landing” experience (where there were 75bps of cuts before a prolonged hold), and it’s certainly not implausible that inflation gets “stuck” around current levels and growth and labor markets remain in good enough shape that the Fed does have just one or two (or even no) cuts in 2025, but I think it’s also not unlikely that we see continued softening in labor markets and the economy, and with just 18% of investors expecting a recession in 2025, it feels like a growth scare and a quicker path of Fed rate cuts is underpriced.
But as longer term readers know the first six weeks of the year markets moved towards the “inflation gets stuck” mindset particularly following the better than expected Jan NFP report (when considering the revisions) and then the hot CPI and PPI. On CPI day the CME Fedwatch tool was pricing just over once cut. But then as noted four weeks ago,
on Friday we did get a whiff of that “growth scare” in the weak flash services PMI (along with the drop in business and consumer confidence). That was enough to get us back to basically where we were at the start of the month before the strong NFP, jump in inflation expectations, and hot CPI in terms of Fed rate cut expectations. The big item this week is PCE prices numbers (core, supercore, etc.), but we generally have a pretty good idea how those will come out…What could though have as much of an impact is the personal spending number. If that comes in under expectations, it could add to the “growth scare” bets.
And since then, as noted three weeks ago, following a series of weaker economic data (personal spending, consumer confidence, home sales, etc., we saw rate cut bets push to the highs of the year despite the chorus of Fed speakers talking about their concerns regarding inflation and a UMich jump in inflation expectations. As I said, “[s]o the market has clearly become concerned about growth, in line with my thoughts coming into the year that the growth risk was underpriced.” And that continued into the following week with Powell himself preaching “caution,’ “uncertainty,” and calling the economy and labor markets “solid”, etc., but the markets nevertheless pushing rate cut pricing to new highs for the year as the Trump administration talking about "a little disturbance," "short-term pain," and "a detox period.”
That all continued into March 10th (the Monday before CPI) when it reached a climax with over three cuts priced in. Some of that came off during that week, due to a poor readthrough of the CPI and PPI to core PCE prices as well as inflation expectations continuing to surge in that U of Mich survey (nevermind that the much more rigorous NY Fed survey found them little changed). So growth concerns persisted, but markets became incrementally more concerned that the Fed won’t be able to respond due to sticky inflation and elevated inflation expectations.
Which brings us to last week when we got the Fed and a lot more February data. Overall it came in better than expected (as discussed below in the Economy section), but growth concerns surrounding tariff and DOGE kept things little changed until we got to the Fed itself. As noted in the Wednesday update things came through pretty much as I thought they would last with upgrades to core PCE expectations and a downgrade to growth expectations (although they were maybe a little bigger than I thought) and no change to the median dots for 2025 and 2026 keeping them at 2 cuts each year.
While the average dot did move higher (fewer cuts) as I detailed, markets seized on the lower growth expectations, the fact that the dot plot continued to call for cuts despite the rise in inflation expectations, and, more importantly, Powell’s commentary which dismissed the rise in many short-term inflation expectation measures noting he prefers those “a little further out,” and looking at the ones he prefers he said “you really don't see much in the way of an increased longer-term expectation. Inflation expectations are mostly well anchored.” (Nevermind that the UMich 5+ yr expectations are the highest since 1993 (and that he brought up that specific metric in the June 2022 meeting as one reason for a 75bps rate hike (he actually was asked about just that and said “in no way did I place a huge weight on it”, so I guess we can now discount that series to some extent))). He also raised some eyebrows using the word “transitory” (three times) to describe one potential type of inflation that might be come through from tariffs (which the Fed would “look through).
All of this saw Fed rate cut expectations push higher the rest of the week, ending not quite at but near where we were March 10th. The upcoming week brings a couple datapoints that could shift these here or there including flash PMI’s, Conf Bd consumer confidence (which includes their 1-yr inflation expectation component but seems the Fed isn’t worried about that), and, most importantly, the personal income and spending update on Friday which includes PCE prices (the Fed’s preferred inflation metric). We’ll also get the final UMich read but which could matter some as Powell said part of the reason he dismissed the jump in 5-10 yr inflation expectations earlier is it was “a preliminary read.” This will be the final.
Turning to rates, the 2/10 curve continued to remain in its range this year just above the breakeven mark +2bps w/w at +0.31%. It started the year at +0.33%.
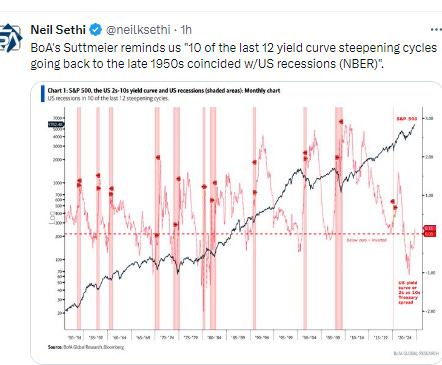
As a reminder, historically when the 2/10 curve uninverts following a long period of inversion the economy is either in a recession or within a few months of one. It uninverted in Sept, so this looks officially like a "this time is different" situation.

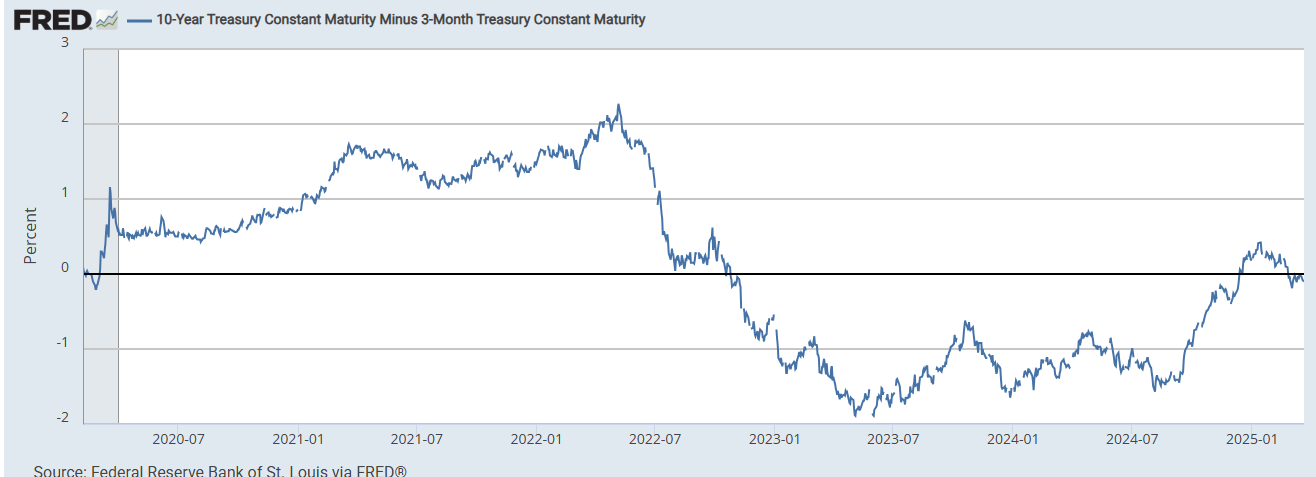
The 3mos/10yr yield curve (considered a better recession signal than 2/10’s w/the last four recessions on average coming a few months after the curve uninverted (prior to that it generally uninverted after a recession had already started)) remained inverted for a third week -6bps w/w at -8bps as of Friday.
As noted when it happened this (reinverting) is something that it did prior to (or just after) the last two recessions and it also dipped (but didn’t reinvert) in the two recessions prior to that.
Not sure if the reinversion “restarts the clock” on the recession watch. If so the longest it went in those previous four instances before recession after reinverting is 6 months (2007).

And the 10yr Treasury yield remains a little below the Fed Funds rate which as you can see is a very unusual situation historically, happening only a handful of time in the past 40 years. When it’s dropped from above to below (as opposed to having the FFR move from below to above) it’s often come before a recession (four of last five times) and in that time (since 1984) the next move has always been a cut (often very soon but in 2006 it took over a year).

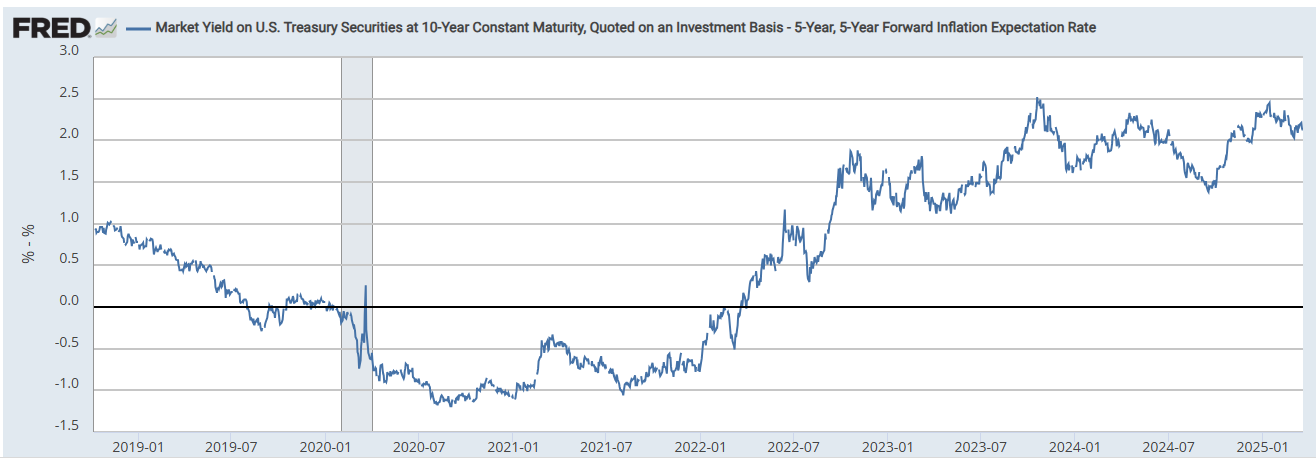
Long term inflation expectations as measured by the 5-yr, 5-yr forward rate (exp'd inflation starting in 5 yrs over the following 5 yrs), which got a lot of discussion this week at the Mar FOMC press conference (and was also mentioned by Powell at the Nov FOMC press conference (he said in Nov the metric was “right where it’s been, consistent with 2% PCE inflation”), edged up +3bps w/w to 2.15% on Thursday, but it’s just +0.05% from the joint least since Jul ‘22 hit Mar 13th (which matched March ‘23 (following the banking failures)).
They are -14bps since the Nov FOMC. I had said last week “[t]hese might get another mention at the Powell press conference this week.”

And the 10-yr breakeven rate also edged up +4bps w/w through Thursday to 2.33% from the lows of the year.

With 10yr Treasury yields little changed and inflation expectations rising, 10yr real rates fell back -5bps 1.93%, a 2-week low.
They’re now -41bps from the +2.34% on Jan 13th which was the highest since Oct ‘23 (and before that 2007), though still well above the 2010-2020 peak of 1% (but down from the post-pandemic peak Oct ‘23 of 2.5%).

As with 10yr rates implied from market pricing, backing into 10yr real rates using 5-yr, 5-yr forward inflation expectations (subtracted from the 10yr nominal yield) similarly edged down -4bps w/w to 2.13% Thursday.
These are -32bps from 2.45% on Jan 13th which was the highest since Oct ‘23 (and before that 2007)), but also well above the 2013-2020 average of around 0.5% (but down slightly from the post-pandemic peak of 2.5% in October '23).
And as a reminder according to BoA the importance of real rates on equity returns has seen the largest increase in the factors they track over the past 5 yrs and explains a larger proportion of stock returns (83% correlation) in their data (to 2006), with the dollar close behind the most correlated (76%) since 2015.
Short-term real yields (Fed Funds - core PCE) edged higher to 1.68% in January from 1.61% in December, which was the least since Sep ‘23, down from 2.70% in June. That though was the highest since 2007. [this gets updated at the end of the month assuming no change to Fed Funds this week].
No relief for small businesses or HELOC borrowers as the real prime rate (inflation adjusted using core PCE) increased for the first time since last June to 4.85% from 4.78% in December, although still down over around a percent from the 5.87% in June, which was the highest since Sep 2007. It remains more than double the 10yr pre-pandemic avg. [this gets updated at the end of the month].
And looking out longer term, a little surprising to some was the FOMC’s median long run projection for the endpoint of the Fed Funds rate (the “neutral rate”) remained at 3.0% (but note the average moved up to 3.11% from 2.97% (so 14bps)). It is still the highest since Sep 2018.

The ACM model of the 10yr term premium (which is solely based on interest rates, like inflation expectations fell to a 2-wk low at +0.32%, -5bps w/w, between the +0.21% it hit two weeks ago (the least since early December) and the +0.66% it hit Jan 13th (which was the highest on this model since May 2015), remaining up ~+46bps since the FOMC did the 50bps cut in Sept.
The extended discussion on term premium (what it is, why it’s important, etc.), can be found in this section in the Feb 4th Week Ahead.

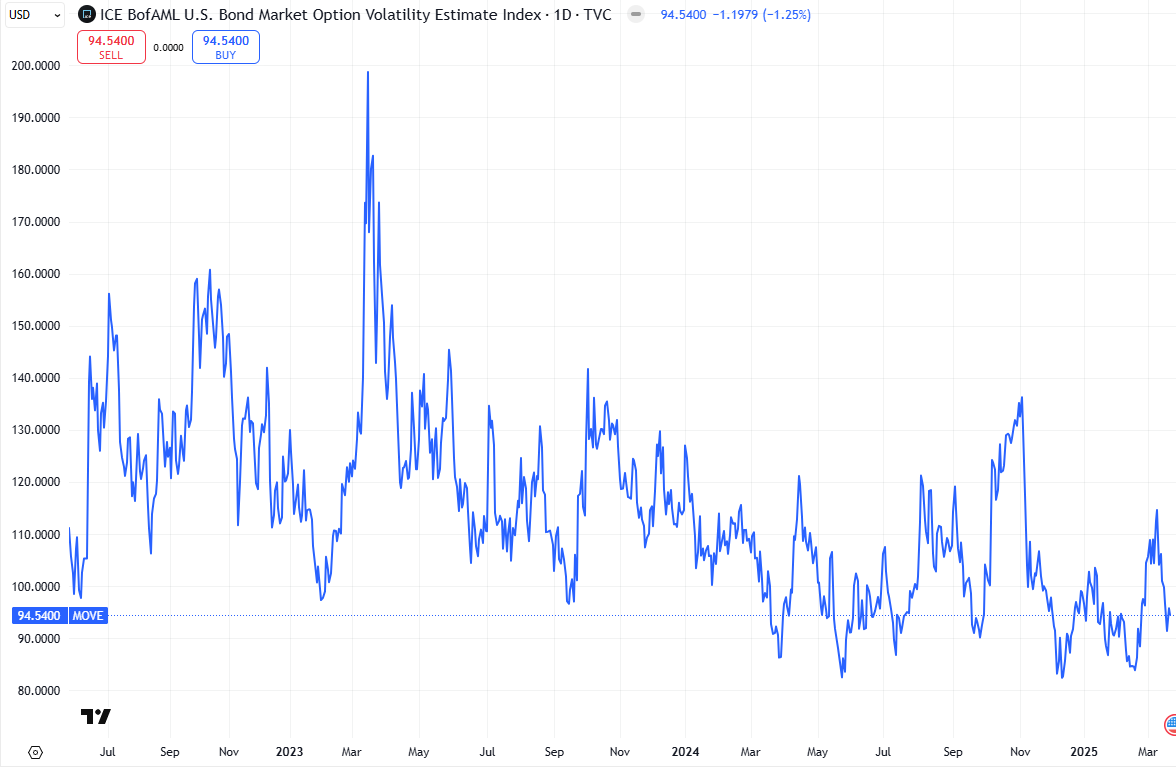
As with the VIX (equity volatility) the MOVE index of expected 30-day Treasury note/bond volatility fell to the lows of the month on Wednesday before rebounding a touch end of week, now back towards the bottom of its range over the past year.
30yr mortgage spreads have been much less volatile than the MOVE index finishing up +3bps w/w at 2.39%, remaining though just +12bps from the lowest since June ‘22 (2.27%) hit Dec 19th, and well off the 3.1% peak in June ‘23. But they are still around +65 bps above the 2010-2020 avg level.

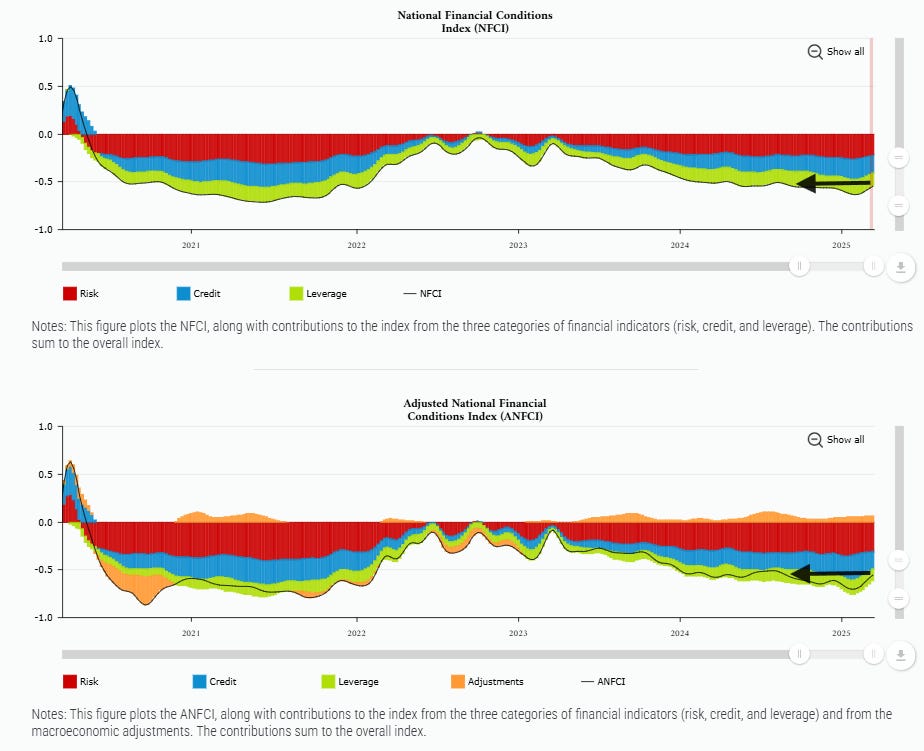
Chicago Fed National Financial Conditions Index and its adjusted counterpart (the latter attempts to remove the correlation between the various indicators due to broad changes in economic conditions), both of which are very comprehensive each w/105 indicators, in the week through Mar 14th (so a little lagged), saw both increase for a 5th week, the first 5-wk rise since Mar ‘23 now the highest since Oct & Aug respectively.
https://www.chicagofed.org/research/data/nfci/current-data

Some background:
As the Fed continues to drain liquidity from the system via QT, I think it’s important to watch for stresses which give an early warning signal that they are perhaps going to far as they did in 2018 which led to a near bear market. One area I am monitoring is reverse repos (which is an overnight secured place institutions (mostly money markets and banks) can park excess funds to accrue some interest designed by the Fed originally to keep excess liquidity from pulling down rates too much in other short term markets). RRP grew rapidly in 2021 & 2022 as money was pumped into the system but since May ‘23 has been steadily drained down by the Fed’s QT program and higher bond issuance with banks discouraged by regulatory rules from taking up the increased Treasury supply.
In particular, the continued sizeable issuance of T-bills (<1 yr duration) of around $800bn/month (accentuated by the $60bn in balance sheet runoff (meaning the Fed has reduced its buying of maturing Treasuries by that amount which the private market has to fill)) drained ~$1.75 trillion from RRP in the year through March 1st. From then until early July RRP levels had remained relatively stable in the $375-$500bn range, but then resumed their decline (in fits and starts (seeing spikes at most month-ends but then coming down to hit new lows), with the lowest level hit Feb 14th at $58bn, the least since Apr ‘21 on the back of the Fed cutting RRP rates to the low end of the Fed Funds band which made parking funds there (versus lending overnight to other institutions or buying T-Bills) less attractive in line with their desire to sop up most of this “excess liquidity” (as they have described it).
As noted in previous weeks, though, since then RRP has rebuilt as with the Treasury up against the debt ceiling they have had to stop issuing new Treasuries only refinancing maturing ones. This has taken away a source of investment for money markets and other buyers who have had to turn to the RRP in part despite the lower rates. The expectation has been for RRP to continue to slowly build until the debt ceiling is raised, at which time (when the debt ceiling is raised) it is predicted to drop quickly as the Treasury “catches up” on the Treasury issuance currently on hold, which will force the end of QT (concerns about that have already seen the Fed cut QT by $20bn).
RRP though hasn’t seen the level of increase most expected, but this week it jumped a bit +$74bn w/w to +$200bn, the highest since the end of February, which may though also be in advance of quarter end (it has spiked each quarter end the past year). I would expect this will continue to increase notably into quarter-end. We’ll see how much comes off as we get into April.


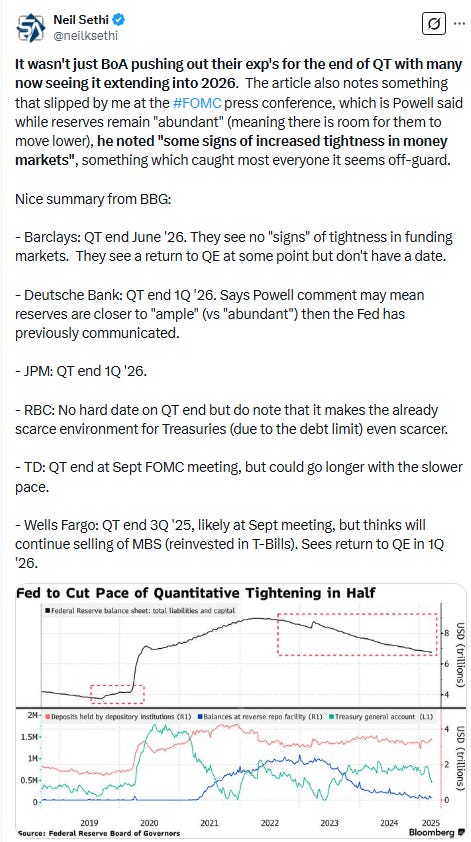
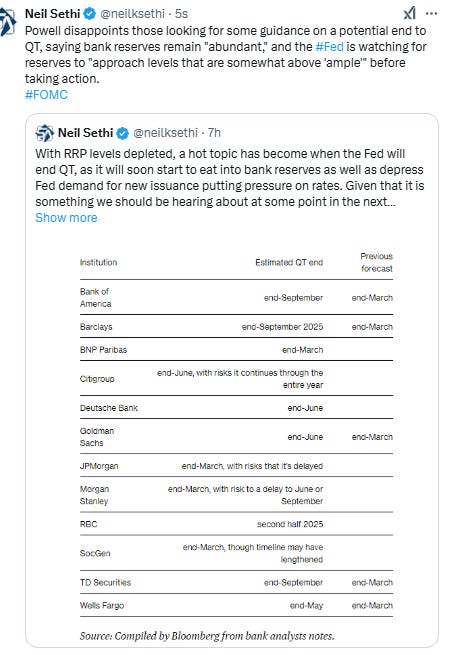
And as anticipated in last week’s post, the FOMC did slow QT (to avoid those funding stresses I mentioned in the background materials above), although not all were on board with Gov Waller dissenting (more on that below). Also, curiously, Powell referenced some “funding stresses” in the market. Not sure what that was about. But with the slowing in QT, several big banks pushed out their expectations for when QT will end.
BoA who I have often highlighted pushed out their expectation for the end of QT to December, and they continue to say to watch RRP as the trigger (which they expect now to hit zero in September):
"We expect the Fed will wait until after the debt limit resolution and TGA rebuild to reevaluate their balance sheet policy. We expect a debt limit resolution in late July/August, which would imply a large TGA rebuild from near $0 following the resolution....We revise our QT end date to Dec ’25 as slower QT implies a slightly longer runway. We expect the Fed ends QT after TGA is rebuilt and clearer funding pressures are evidenced. At this time we expect the Fed’s 'dashboard' of money market & liquidity indicators will clearly shift from green, past yellow, and towards red. We continue to believe UST repo is the single best indicator for flagging when QT should end."


The reason monitoring RRP is important is that once it’s gone (and the debt ceiling is raised) it’s expected to begin to pressure bank reserves (absent some other buyer shall as stablecoins which have been a buyer of T-Bills) to absorb any extra debt issuance, etc., that is not sold to foreign and domestic buyers unless/until the Fed stops QT (which as noted most think will come sometime in the next year).
That (stopping QT before it unduly pressures bank reserves) will be important as banks have been loathe to part with reserves beyond the $3tn level (which is where we saw indigestion in the credit markets in March ‘23 (which contributed to the banking issues (SVB, etc.)).
But for now with the Treasury drawing down the TGA which is pushing liquidity into the system (and the Fed slowing QT), reserves have built to the highest since last April $3.46bn, +80bn w/w through Wed.
Overall, bank reserves are above June 1, 2022 levels ($3.36tn), when the Fed started QT, but that will reverse quickly once the debt ceiling is lifted.


For background on various estimates of when reserves will be “too low” see the Feb 4th Week Ahead.
No updates to my thinking on rates:
Getting back to rates, I said back in April 2-year Treasuries were a good buy at 5%, and as I noted once the Fed started its cutting cycle thereafter the ship has likely sailed on seeing those yields anytime soon (meaning years). In terms of 10-yr’s I had advised then grabbing some at 4.7% which I later had thought seemed like something we wouldn’t see anytime soon, but as I noted after the Dec FOMC with the Fed saying the ‘recalibration phase has ended’ along with concerns about sticky inflation cropping back up and now questions about the inflationary impact of some of Donald Trump’s policies, if inflation concerns resurface, we could get back there.
And we were well on our way until a more constructive than expected Powell at the Jan FOMC and comments from Treas Sec Bessent about his focus on keeping the 10yr yield low (and perhaps more importantly committing to the auction schedule set up by Sec Yellen for the next few quarters), started to exert pressure on 10yr yields which the recent growth scare has just added to, now seeing them trade down towards the lower end of my “2025 likely trading range of between 4.1 and 5%.”
I had said “the 2yr will likely not see a lot of movement unless we get some big movement in Fed rate cut (hike?) expectations,” and with projected cuts going from around one CPI day to now around three, that is starting to move lower as well, but I still think trades above where it should.
But in terms of much lower yields, as I said in September, we have probably seen the lows until we get a recession:
“while we didn’t quite see 3.5%, I think 3.6% is close enough, and I think we might have been at or near the lows at this point, particularly as the Fed has been raising their neutral rate estimate. If the endpoint for Fed Funds is around 3% (or higher) then it’s hard to see the 10yr trading much lower [than 3.5%] absent a recession. Similarly 2yrs at 3.6% seem to be very rich and almost certainly too low absent a recession consistent with my statement last week.”
For all the old “final hike” and “first cut” materials, you can reference the Feb 4th blog post.
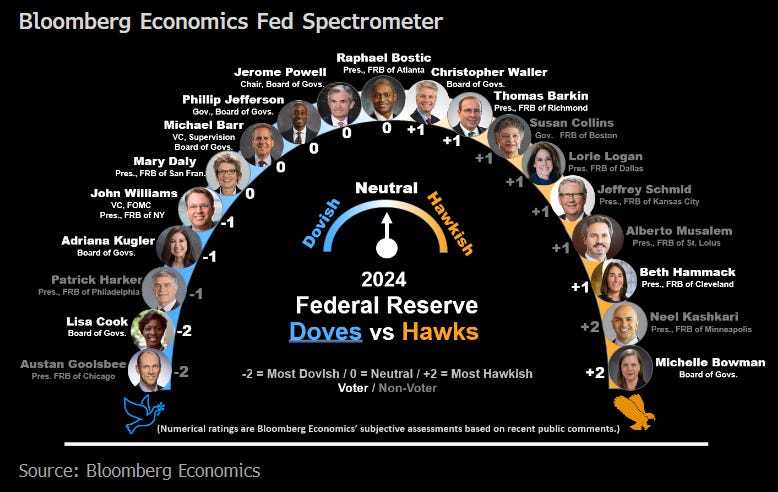
Note BoA’s Dove-Hawk chart (which they acknowledge is badly in need of an update) is missing Hammack in ‘26 (Cleveland and Chicago vote every 2 yrs), but otherwise looks right. Also note that Philadelphia Fed Pres' Harker’s term is up this year (which is why they don’t have a name for Philadelphia), something I didn't realize.
Hammack (who is on the record that there shouldn’t be any cuts unless the labor market weakens dramatically) clearly is one of the most hawkish members, Daly is at best a Centrist as she sees only 2 cuts in 2025, and perhaps Collins as well. Goolsbee is the most Dovish but he has cut back his aggressive talk due to concerns about tariffs.

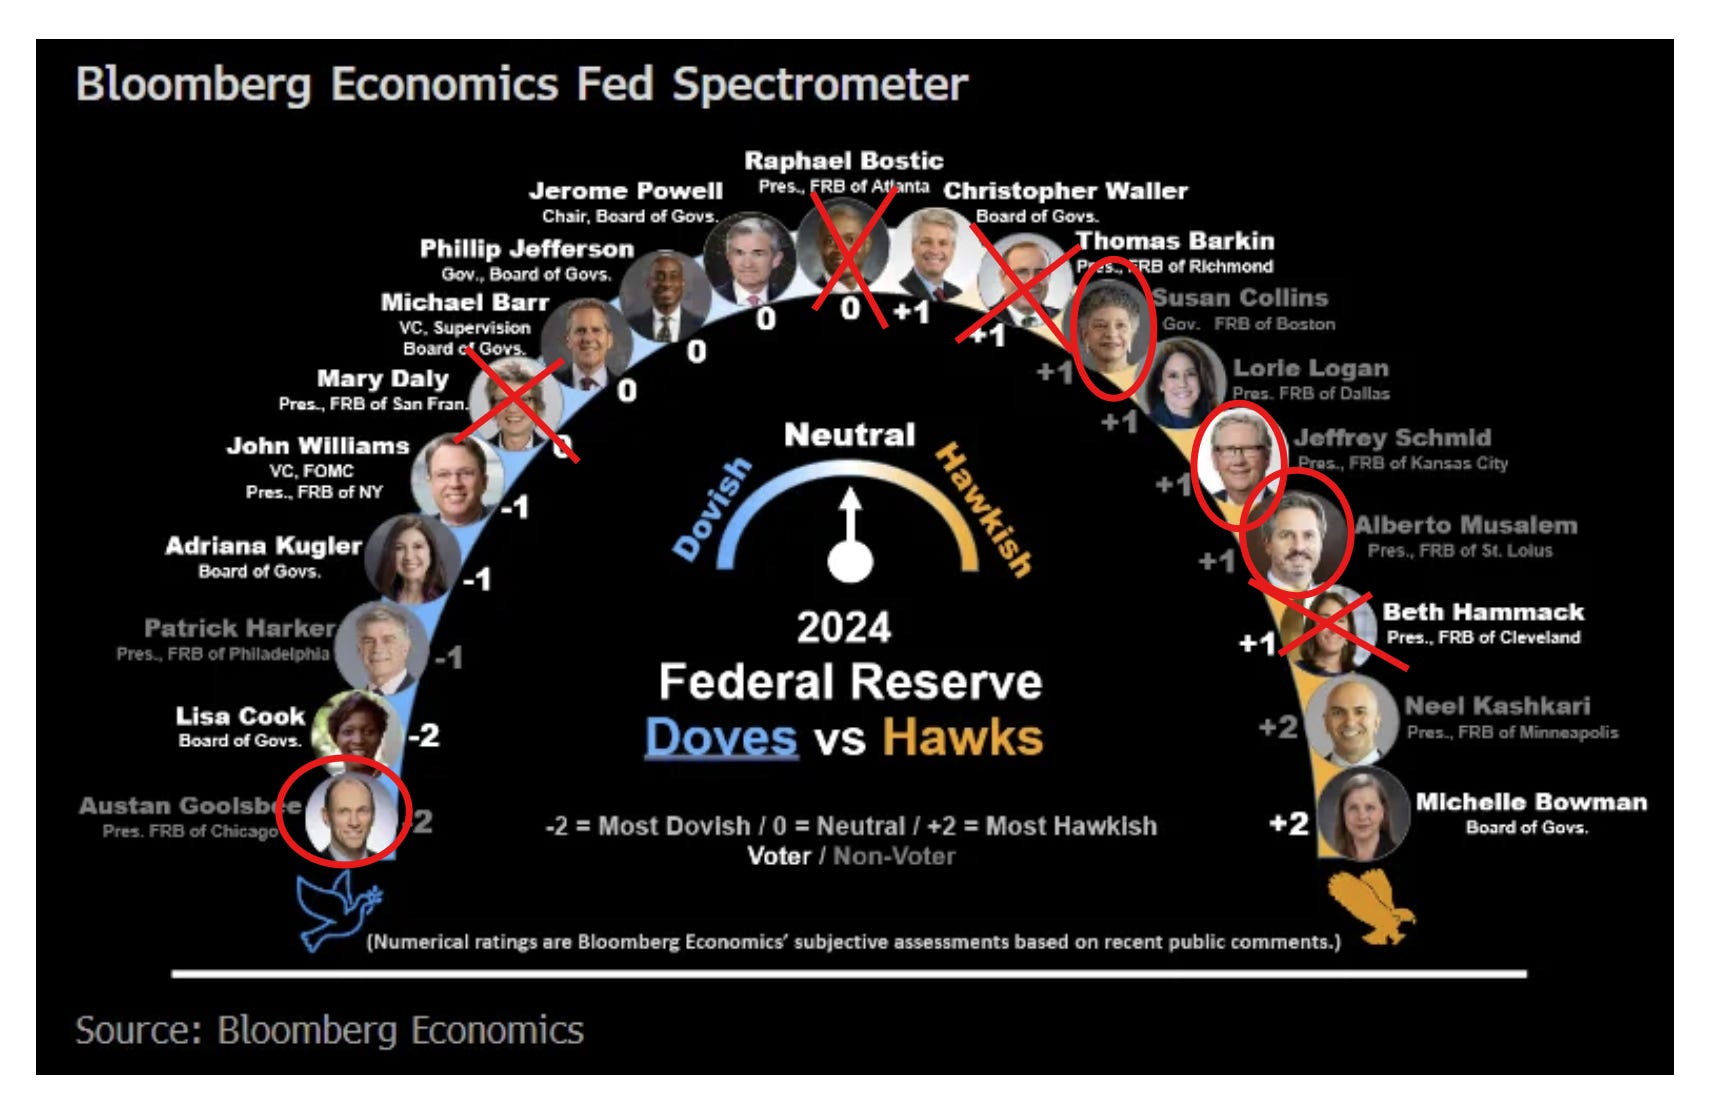
And I came across one from BBG. I think it’s pretty accurate except Kashkari is definitely not that hawkish (he was calling for a December cut in early November):
And here who is rotating off and on for 2025.
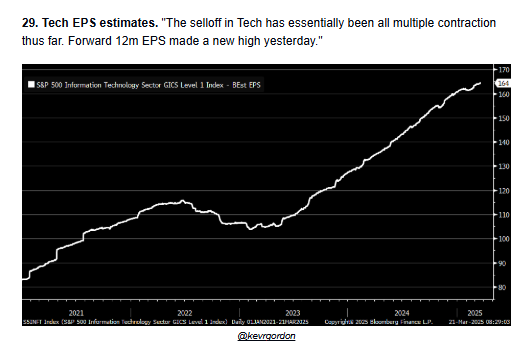
Earnings
As a reminder, I have removed most of the background material, which you can get in the Feb 4th blog post. As you know I’ve moved on to 1Q and beyond. You can reference this post from 12/1/24 for stats on 3Q, and this post from 3/9/25 for stats on 4Q.
2025 quarter-by-quarter earnings saw very modest changes this week after having fallen more notably most of the past 20 weeks according to Factset:
- Q1 ‘25 earnings expectations unch w/w at +7.1% (-7.1% last 20 wks (so cut in half)),
-Q2 down -0.1% to +9.4% (-3.7% last 20 wks),
-Q3 down unch at +12.0% (-3.2% the past 8 wks),
-Q4 down -0.1% to +11.4% (-5.2% the past 8 wks).
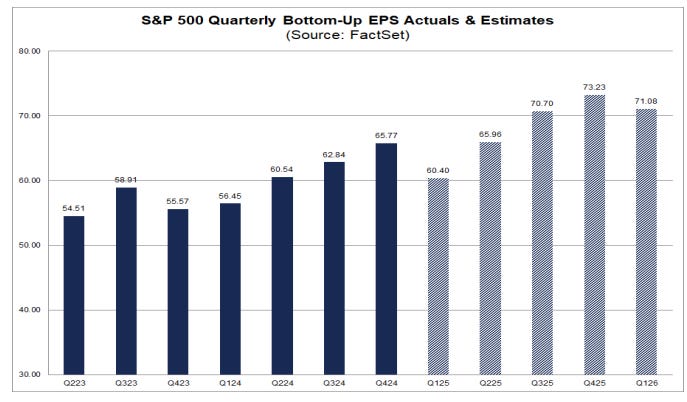
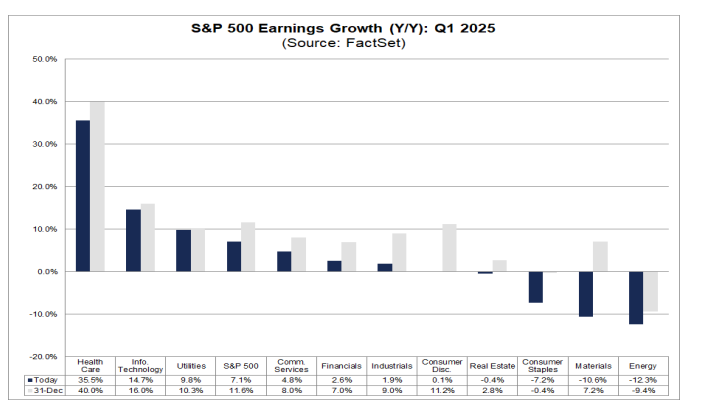
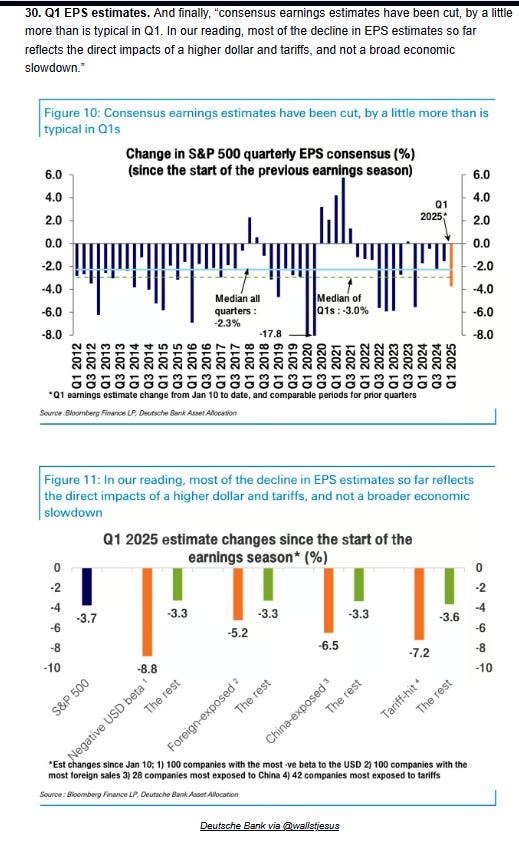
Factset notes that the drop in Q1 earnings YTD of -4.0% is more than both the 5 yr & 10 yr avgs (-3.3 & -3.2% respectively). Every sector has seen its expectations cut led by materials and cons discr.
Q1 revenue growth is now exp’d at +4.2% (unch w/w), down from 5.1% at the start of the year.

2025 earnings expectations fell back a little more dramatically this week to $270.90 (-$0.25 w/w, now down ~-$3.28 the past six weeks), and the y/y growth rate fell to +11.4% (-0.1% w/w and down ~-5.5% since Sept 1st and -3.7% since Dec 31st).

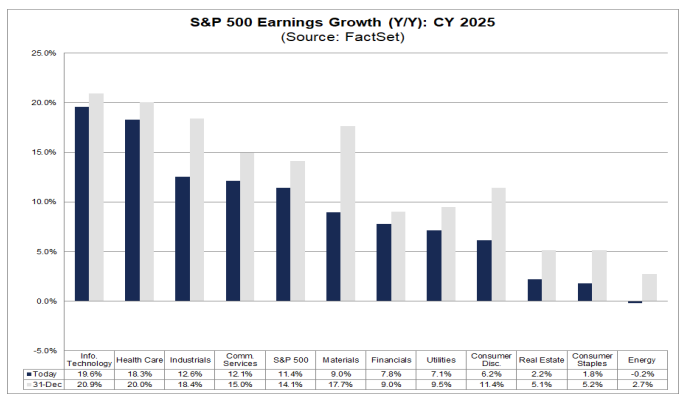
In terms of the earnings growth exp’d for 2025 Factset notes it will be a record, although also notes that there is on average over the past 25 yrs a -6.3% deterioration from where it starts the year ($275.05) w/analysts overestimating in 17 of those yrs (which would equate to $257.72 based on the average deterioration). But it should be noted that average includes 4 outlier years (2001, 2008, 2009 & 2020) where the overestimation was b/w 27-43% due to recessions. Excluding those, the difference is just -1.1% (which would equate to $272.02 (a little below where we are now)).
2025 revenues are expected to grow +5.4% down just -0.3% since Dec 31st.

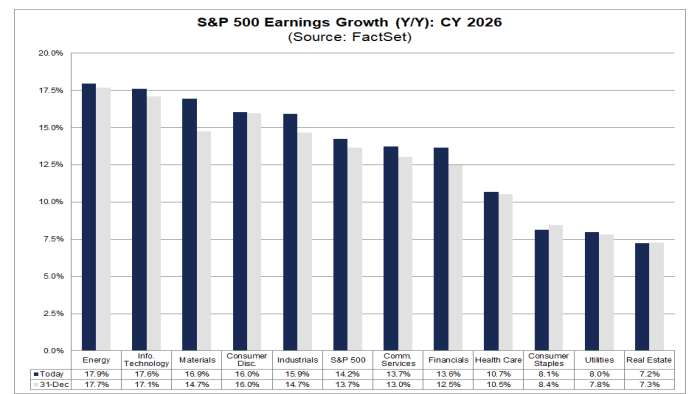
FWIW 2026 earnings are exp’d to grow 14.2% (up +0.1% w/w & +0.9% since Dec 31st).
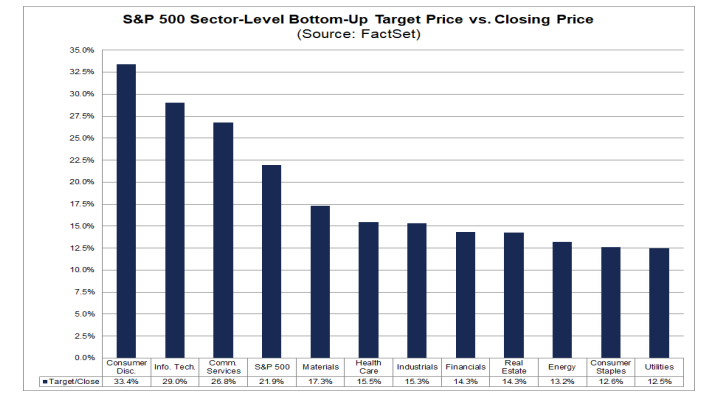
Factset’s analysis of analyst bottom-up SPX price targets for the next 12 months as of Thursday saw a rare second week of softening (I think the first since 2022) although modestly falling -6pts w/w (-23 pts last 2 weeks) to 6,920 (but which would still be +21.9% from Thursday's close), and still up ~1,987 points over the past 49 weeks.
Consumer Discr (+33.4% (down from +36.0% last week (but up from +24.7% three weeks ago)) and Tech (+29.0% (down from 33.0% but up from +24.8% three weeks ago)) are the sectors with the largest upside seen by analysts (the other megacap growth sector, Comm Services is third at +25.9% (down from +28.3%), while Utilities (+12.5%) overtakes Consumer Staples (+12.6% down from +13.2% last week but up from +7.4% two weeks ago) as the sectors expected to see the smallest price increase.
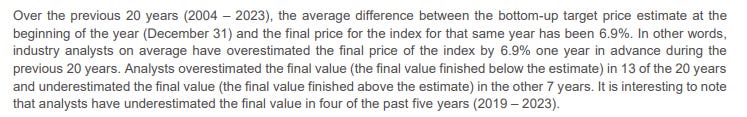
As a reminder the last 20 yrs they have been on avg +6.3% too high from where they start the year (which was 6,755), but note they underestimated it five of the past six years (including 2024).
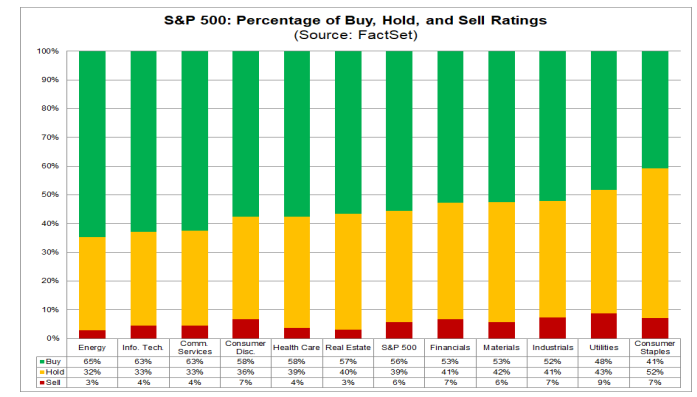
Factset: In terms of analyst ratings, buy and hold ratings continue to dominate at 55.7% & 38.7% (buy ratings are up from 53.6% in Oct ‘24), while sell ratings remained at 5.6%. That 55.7% in buy ratings while down from 57.5% in Feb ‘22 is the most since Aug ‘22.
Energy (65%), Communication Services (63%), and Information Technology (63%) sectors have the highest percentages of Buy ratings, while Consumer Staples (41%) has the lowest percentage. Utilities leads sell ratings at 9%.

And some other earnings stuff:

Economy
Over the past 2+ years part of my earnings optimism has been due to the economy holding up better than expected. While earnings only track the economy loosely (and markets look forward 6-12 months), there is a clear positive correlation between the economy and earnings (particularly a weak economy and weak earnings), and there is a very strong correlation between earnings and stock prices (although stock prices (being as noted forward looking) generally fall in advance of a recession and bottom 6-9 months before the end of one). So if you can see a recession coming it is quite helpful, although very difficult (especially ahead of the market). You can reference this Week Ahead (see the Economy section) for a lot of material on how every recession is preceded by talk of a “soft landing” as close as a month before the start. That report also has the notes about how small caps have shorter debt maturity profiles and more of it (debt).
As long time readers know the beginning of this section hasn’t changed much since I switched to the Week Ahead format in mid-2022, with the indicators to me during that period consistent with solid (which at times has been robust) economic growth, and I have been a broken record that I “certainly do not think we’re on the verge of a recession (although as noted above every recession starts out looking like just some economic softening).”
That said, as I’ve noted starting in February, the January data was much more mixed, but as I said then
most of the weak data (outside of consumer confidence but particularly housing and spending data) can be explained by the unusually bad weather, particularly in the South which represents a huge amount of economic activity. And consistent with it being “mixed” data we saw strength in many areas such as labor markets, core capital goods orders (biz spending), exports (overshadowed by the surge in imports (which is not necessary a “bad” thing even as it drops GDP)), and personal incomes.
But as noted two weeks ago, as the February data has been rolling in, it continues to be “mixed”. This past week we got quite a bit of data, and overall it made me feel a little better about things. While retail sales were weaker than expected, that was mostly due to the “tariff front-run” items which saw outsized strength in previous months with control group sales solid, housing starts and existing home sales bounced back from a weak weather-influenced Jan (although permits fell back (but remained in their range over the past two years)), industrial production was much better than expected on a broad-based advance, and the coincident indicators continued to set new highs consistent with a non-recessionary economy.

So as I said two weeks ago,
while the picture is definitely more mixed, and there is almost certainly going to be further slowing in the economy given the uncertainty created by the volatility of economic policy from the Trump administration (it would be far more productive economically speaking for them to pick something and stick with it even it if caused short term dislocations), for now I don’t see any reason to change my overall takeaway on the economy from the start of October that “the situation continues to seem like manufacturing is subdued but trying to bottom [and now seems to “have bottomed” subject to economic policies], housing perhaps has inflected off the bottom, labor markets (and the services sector and construction in particular) remain for now solid with healthy wage growth, and productivity appears to remain robust (this can be a game changer in allowing the economy to expand without triggering inflation)…. I continue to feel that any softening does not appear to be morphing into a recession.”
And as I said at the start of September:
without question, the evidence is building that the days of >3% real GDP growth are behind us (although we got there in Q3), and we should be happy to settle into something more around trend (1-3% real (infl adjusted) growth). That though is far from a disaster. The important thing will be to see the softening level out (L-shape) rather than continue to fall turning the “soft landing” into a recession.
So far that’s what we’ve seen.
Citi Economic Surprise Index improved +4.6pts to a 2-wk high but still negative at -5.1, now up +-9.4 pts from -16.5 Feb 28th, which was the weakest since September. It remains though -27.6 pts from the highs of the year (22.5) in mid-Jan (and -48.4pts from the December highs (43.3)).
The 2024 high was 47.2 (in Feb) and the low -47.5 (in July).
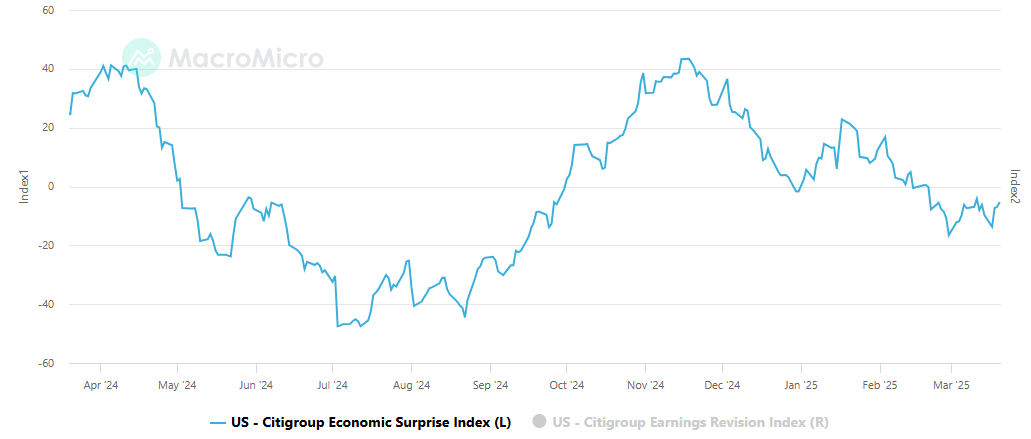
https://yardeni.com/charts/citigroup-economic-surprise/
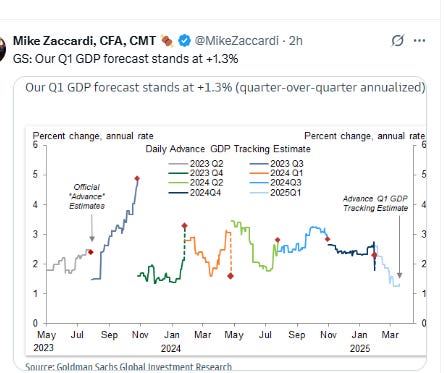
And GDP estimates are for now mostly consistent with a no recession call (again though remembering GDP going into recessions generally doesn’t look like one is coming (it was up around 2% in Q2 & Q3 2008 well after the recession had started)). After Q3 was revised up to 3.1%, Q4 decelerated but was still above trend at 2.3%. While some Q1 trackers (most notably the Atlanta Fed’s) continue to be depressed due to the big jump in imports (which are subtracted from GDP as they are consumption produced elsewhere), that’s not really the same as a drop in exports (which were higher or spending or investment) so to me really isn’t consistent with a coming recession. Also, the other trackers I update on each week are clustered in the 1.9-2.7% area which is quite respectable. Goldman who I can only report on when I see an update posted by someone though is at 1.3%.
Atlanta Fed (who was right in line in its 3Q & 4Q est’s of GDP (and just a tenth off for 2Q from the 1st est)), remained in negative territory this week due to trade subtracting nearly -4% from their estimate, something that we know is not accurate (not sure why they haven’t fixed it (I emailed them, we’ll see if they reply)).

BoA (who as a reminder was right on for 4Q GDP vs the 1st estimate and two tenths high for 3Q), left their 1Q tracking through Thursday at 1.9%, but as noted on Friday they did lower their “official forecast” for 1Q a full percent to 1.5% so now below their tracker.
For their tracker, upward revisions came from the retail sales, industrial production (from investment but consumption declined a touch on weaker than expected utility usage), and housing starts and existing home sales reports, which were offset by downward revisions from higher than expected import prices and lower than expected export prices (which increased the net export deficit (which reduces GDP)).


NY Fed’s 1Q GDP Nowcast (as a reminder, they had 2.56% for 4Q vs 2.3% 1st est (they were off a similar amount for 3Q)) edged up to 2.72% from 2.69% the previous week, remaining the highest of the Fed GDP trackers. Improvements following the industrial production and housing starts reports outweighed drops from the NY services PMI and retail sales report
As a reminder, the NY Fed’s model is dynamic and so adjusts in real time as data evolves, and “parameter revisions” added +0.04%.
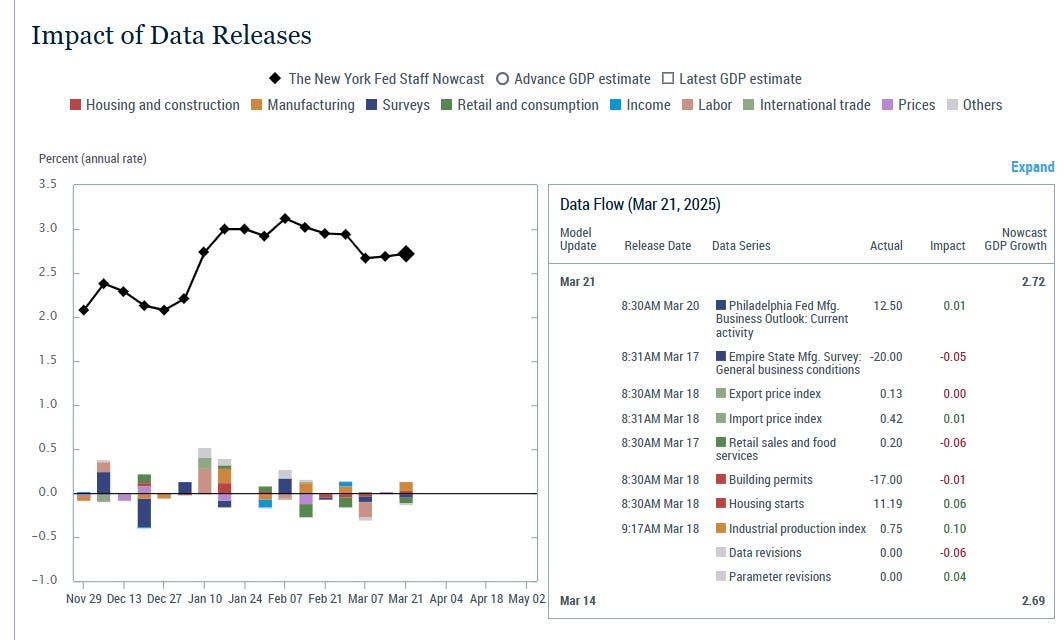
The NY Fed also initiated their 2Q tracking edging it down to 2.64% from 2.66% but remaining above trend.

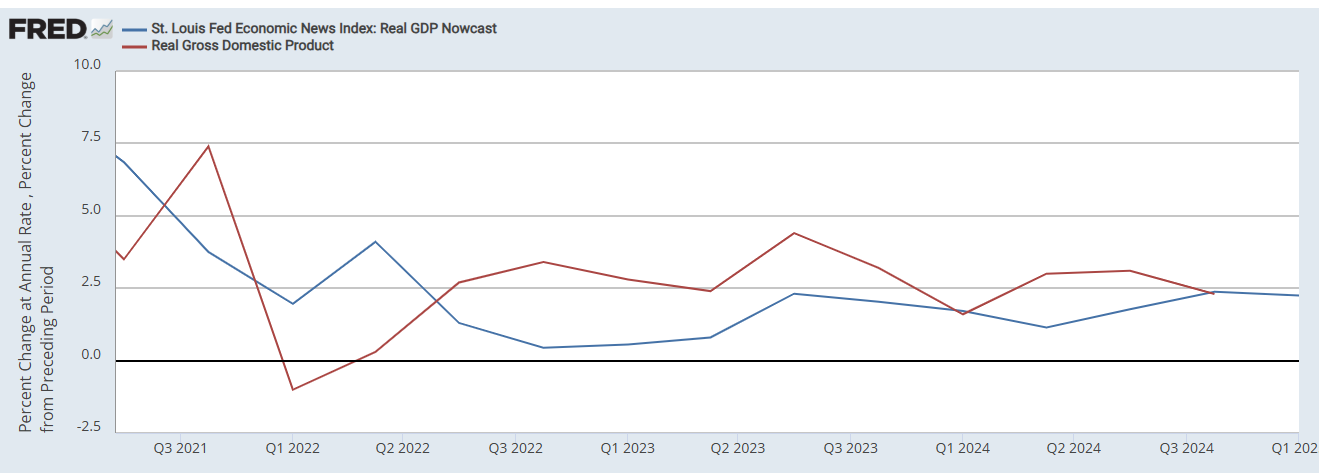
St. Louis Fed GDP tracker, which has often undershot actual real GDP since Q2 ‘22, but which was right on in Q1 & Q4 2024, edged -0.08% lower w/w but remained pretty solid at 2.25% (it unfortunately doesn’t give the inputs), a little below the NY Fed’s tracker but well above the Atlanta Fed’s.
Weekly Econ Index from the Dallas Fed (scaled as y/y rise for GDP), which runs a week behind other GDP trackers, in the week through March 15th fell back to 2.32% from 2.59% in the prior week (revised from 2.65%) edging back from the very top of the 2024 range (1.49 - 2.66%) that it left only twice during 2024 but which it had been above again the last two weeks in January.
The 13-wk avg also fell back for a 2nd week -0.04% to 2.46%, now -0.05% off the best since 2022, still though evidencing overall economic momentum that is above trend.
https://www.dallasfed.org/research/wei

Other economy stuff:


Valuations
Like the other sections, I’ll just post current week items regarding the multiple. For the historical stuff, see the Feb 4th blog post.
It’s hard to see on the chart, but with the rebound in equities at the end of the week, P/E’s edged higher or at least stopped their decline, but remain near the lowest of the year.
-The SPX forward P/E up one tenth to 20.3 (still down -1.9pts the past five weeks). This chart has it that as least since late 2024, but I’ve seen other charts that show the forward P/E the least since 1H 2024 and as low as Q3 2023.
-Mid-caps (S&P 400) were unchanged at 14.7 also the least since late 2024 (down -2.4pt from the highest since early-’21 (17.1)).
-Small caps (S&P 600 so higher quality than the Russell 2000) edged up a tenth to 14.6 also from the least since late 2024 (still down -2.5pts from the highest since early-’21 (17.1)).
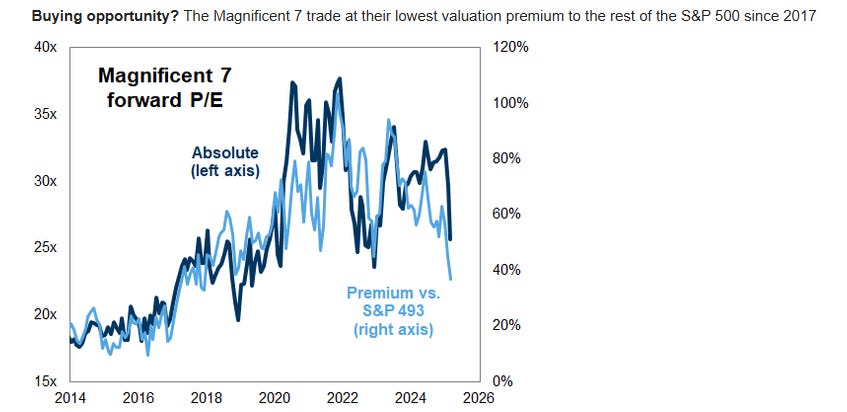
-Yardeni's “Megacap-8” (adds NFLX) P/E stopped its eight week decline at 25.3, the least since late 2023. It’s down -6.2 pts from the 31.5 it hit in 1H 2024 (which was the highest since Jan ‘22)).
https://yardeni.com/charts/stock-market-p-e-ratios/

Other valuation stuff:


Breadth
Breadth, which I noted last week had started seeing some “green shoots” saw mixed performance this week. Sector breadth was very good and the McClellan Summation Index turned up, but most other indicators edged lower.
The McClellan Summation Index ("what the avg stock is doing") did though turn up this week from the least since Jan (but a much higher low than the indices).

% of stocks over 200-DMAs though fell back a bit after rebounding the prior week from the lowest since Nov ‘23 on both the NYSE & Nasdaq.


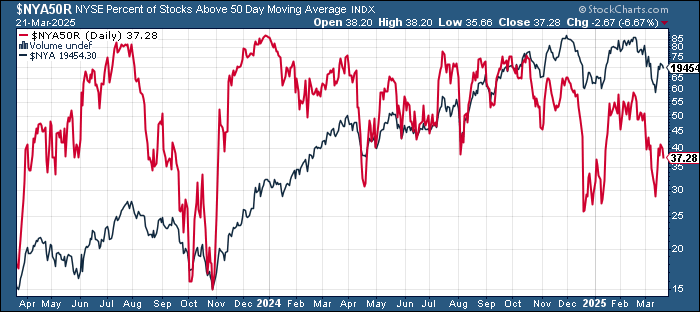
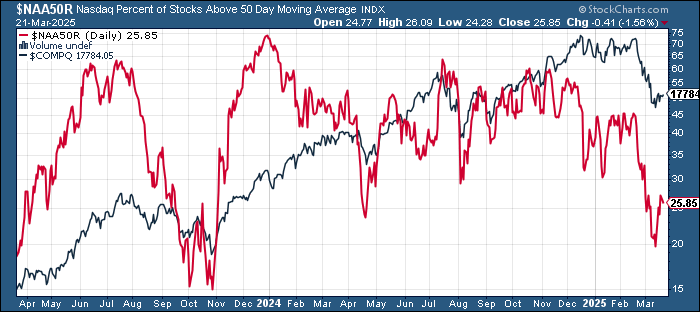
% of stocks above 50-DMAs like those under 200-DMA’s fell back after having rebounded the prior week.
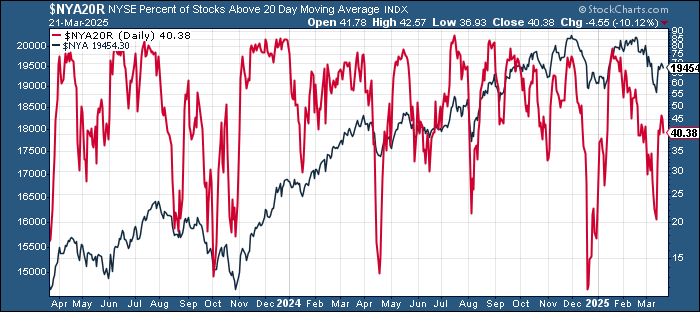
As did % of stocks above 20-DMAs on the NYSE while interestingly the Nasdaq didn’t soften (but also didn’t improve).

Value/Growth edged lower this week after hitting the highest since late November the prior week.

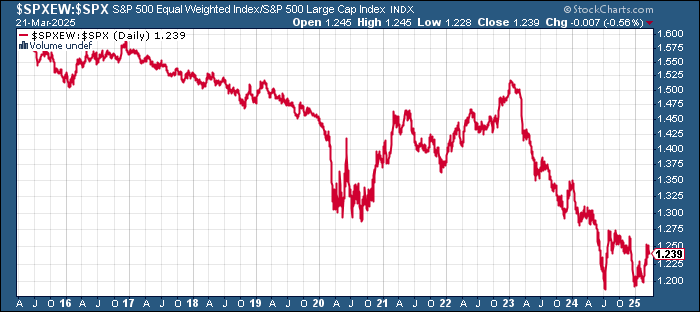
The equal-weighted SPX vs cap weighted ratio like value/growth edged lower after hitting the highest since November the previous week.
Like value/growth and the equal-weight/cap weight ratios, IWM:SPY (small caps to large caps), fell back towards the lowest since 2000 hit earlier in the month.

Sector breadth quite good with every sector up (from two green the prior week and one the week before that) with 10 of 11 up at least 1%, five up at least 2% and two >4% (w/Energy +6%(!)). A fairly dramatic turnaround from a week when 8 of 11 were down at least -1% (and 10 the prior week and 7 the week before that), and three over -3% (and four the prior week).
For a second week defensives didn’t outperform with cyclicals again leading along with growth..

SPX sector flag showing the details from last week. A lot less drama unlike the last couple of weeks where we had lots of stocks moving over 5% (and many double digits). Just a handful this week. Still you’d think it would look better with every sector advancing.

Other breadth stuff:
Flows/Positioning
Overall global flows from BoA (EPFR data): $43.4bn to stocks, $4.9bn to bonds, $3.0bn to gold, $0.1bn to crypto, $6.3bn from cash
Here were some notables.


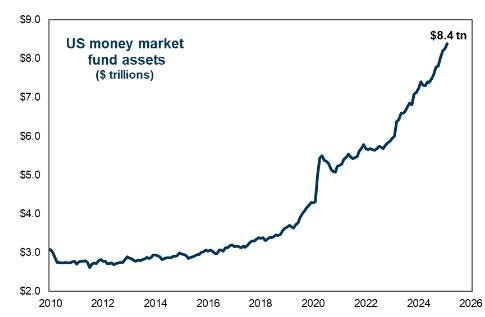
ICI data on money market flows saw another week of outflows accelerating to -$21.7bn in the week through March 19th (still +$92.7 the last 4 wks), vs the -$13.1bn EPFR saw.
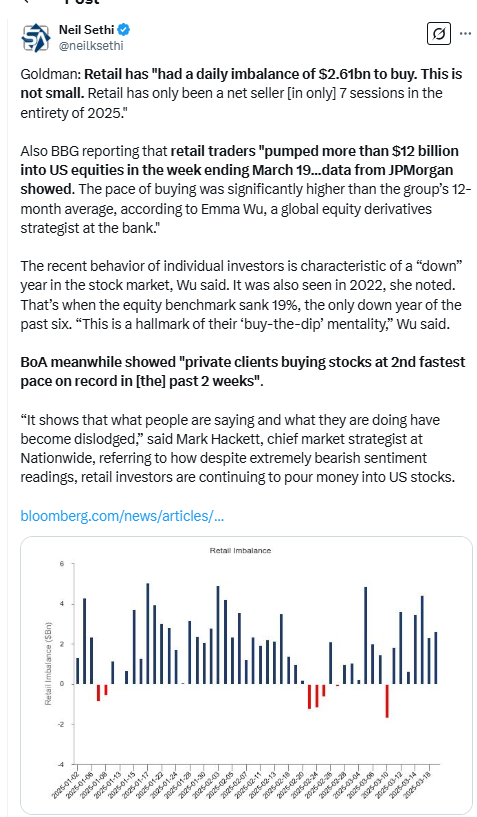
Again though it was all due to institutions which pulled -$30.7bn after -$19.2bn the prior week (but only after adding +$68bn the 2 wks prior to that), while retail added +$9.0bn after +$17.8bn the prior week (now +$50.8bn the past 5 wks).
Total MMF assets edged down to $7.0tn from a record $7.02tn two weeks ago.
https://www.ici.org/research/stats/mmf

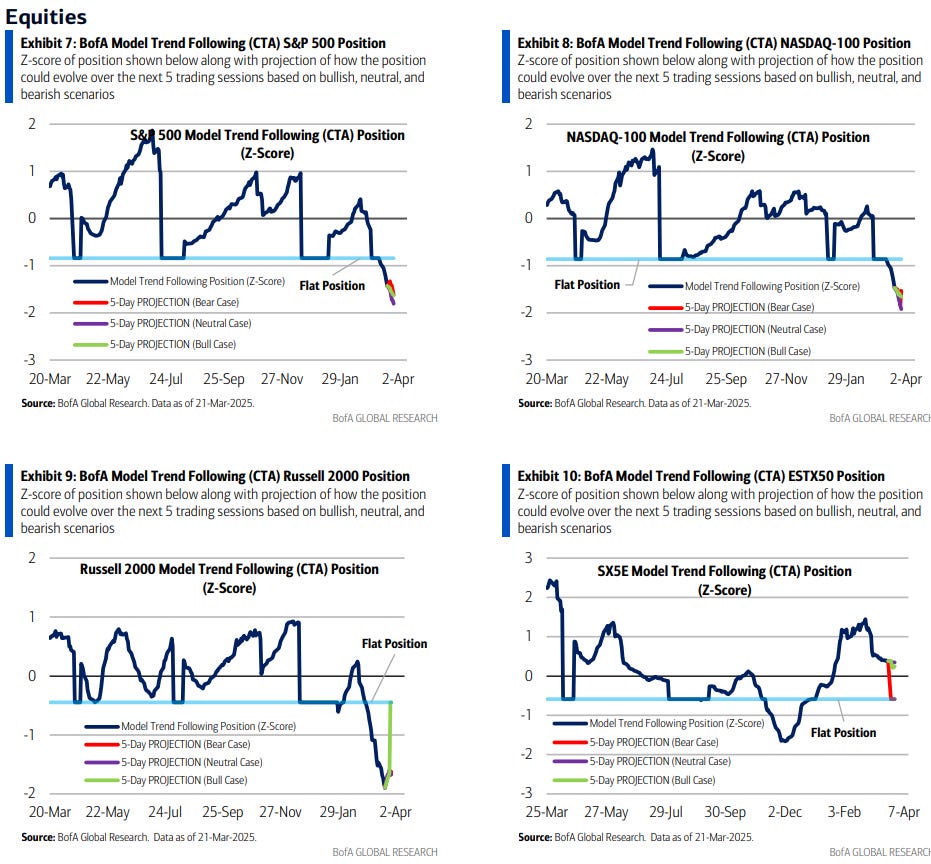
Looking at CTA (trend follower) US equity positioning, BoA doesn’t get into the SPX or NDX (but I’ll discuss below) instead noting that their model has seen a reduction in CTA length in the Euro Stoxx 50, which means the title for "most stretched positioning" according to their model “belongs to the Russell 2000 short that trend followers have built since the start of the month with the index declining in four of the last five weeks. We continue to closely monitor position unwind triggers," which means they're looking for a potentially large short covering rally. They've got 2126 as their buy point currently.
In terms of the S&P 500 and NASDAQ-100 though those are also quite short with BoA not seeing a big short covering rally in the offing there at this point even under their bull case.
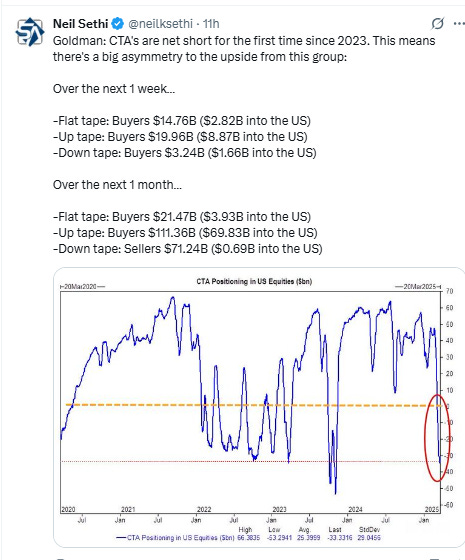
So, unlike some others like Goldman, BoA doesn’t model much CTA buying this week in the large cap indices. Will be interesting to see who is right.
Price trend has fallen sharply to negative across the board for US indices with the $NDX at -50% from -10% last week and +48% three weeks ago) while $SPX is also down to -50% from -12% and +48%), while the $RUT is near max short at -96% from -72% and +2%. #Japan’s #Nikkei225 also dropped to -60% from -41% and -4% while the Euro #Stoxx50 as noted continues to ease off from the 99% four weeks ago to 65% now.
Tier 1 Alpha for their part sees CTA positioning the least since 2019.

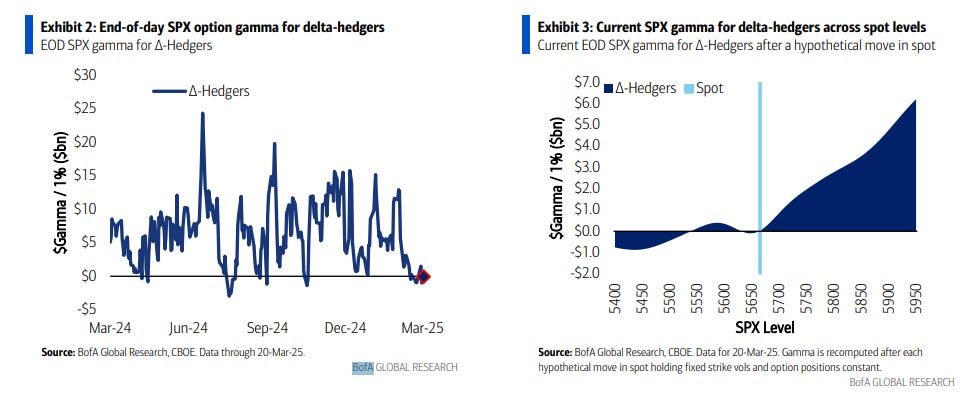
In terms of gamma positioning, BoA says "SPX gamma has remained lethargic and finished Thursday at -$0.1bn (8th 1y %ile). Looking forward market direction is especially important from here. An equity rally could catalyze SPX gamma to climb aggressively. Behind the scenes, 1-week to 1-month options (notably the 31-Mar expiry) are the primary driver of the gamma profile’s asymmetry to the upside. Consequently, as the time-to-maturity declines for those options the sensitivity of gamma to upside moves may only become more pronounced.”
So like others BoA sees gamma very low (just 8th %ile over the past yr, although up a touch from last week’s 4th %ile) making it currently an accelerant to volatility. But they indirectly reference that "huge" (as Charlie McElligott put it) JPM strike from their call-writing ETF's at the 5565 level.
As they note if we can move away from that level, gamma climbs quickly, but there's an asymmetry as until we fall under it gamma won't drop appreciably, but once we do it does fall off. Notably that strike expires this week though, so this will all reset next week.


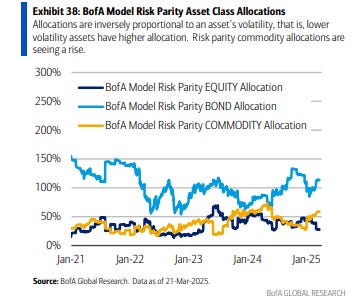
BoA sees risk parity funds continuing to leave their (leveraged) overweight to bonds at the highest levels of the year but continuing to add more to commodities which are at the highest since mid-2024 at the expense of equities which remain around the lowest over the past 2 years.
#oott
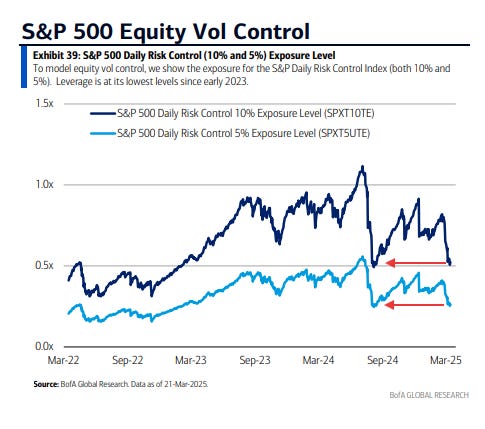
BoA estimates in line with the extreme volatility in equities the past few weeks, vol control (volatility targeting funds) continued to see selling taking their exposure to the least since August (which was the least since Mar ‘23 (SVB)), very close to breaking under those levels.
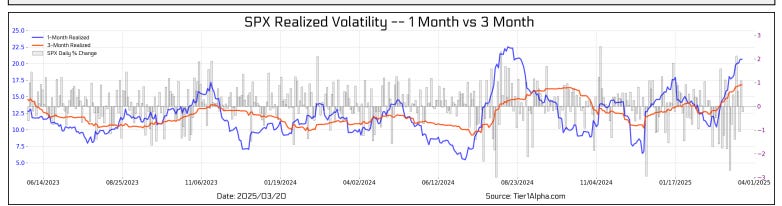
Tier 1 Alpha similarly sees positioning the least since Sept though sees both 1 and 3-mth volatility lookback not having peaked which would mean continued selling (or at least not buying) from that cohort.

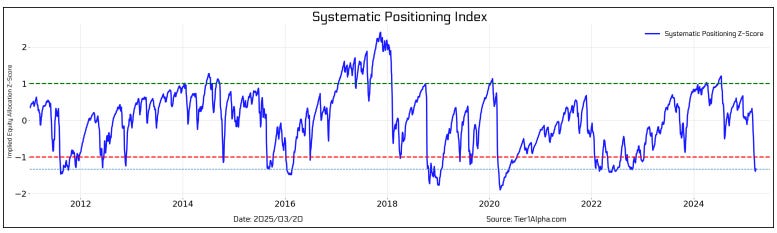
And Tier 1 Alpha sees their composite systematic positioning index near the lowest since the start of the pandemic.
And I like to look at the notional value in leveraged ETF’s as a barometer of risk appetite. BoA says after they hit the lowest since August the week before last they’ve rebounded sharply. Remember, this is a “constant negative gamma” source as Charlie McElligott put it in a recent @oddlots appearance (meaning that there is double/triple buying pressure in the direction of moves in AUM flow.

Leveraged ETF AUM in NVDA (the largest single-stock w/leveraged ETFs) and TSLA (the second largest) also have rebounded.
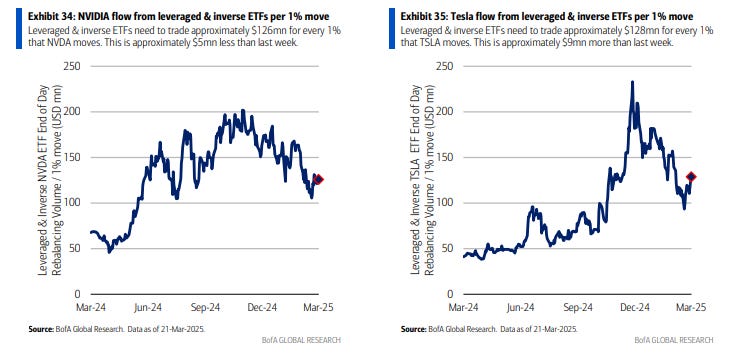
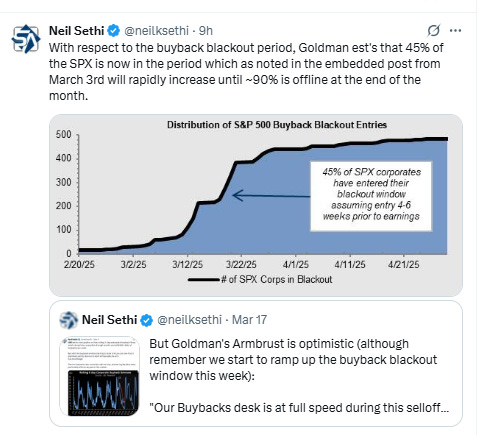
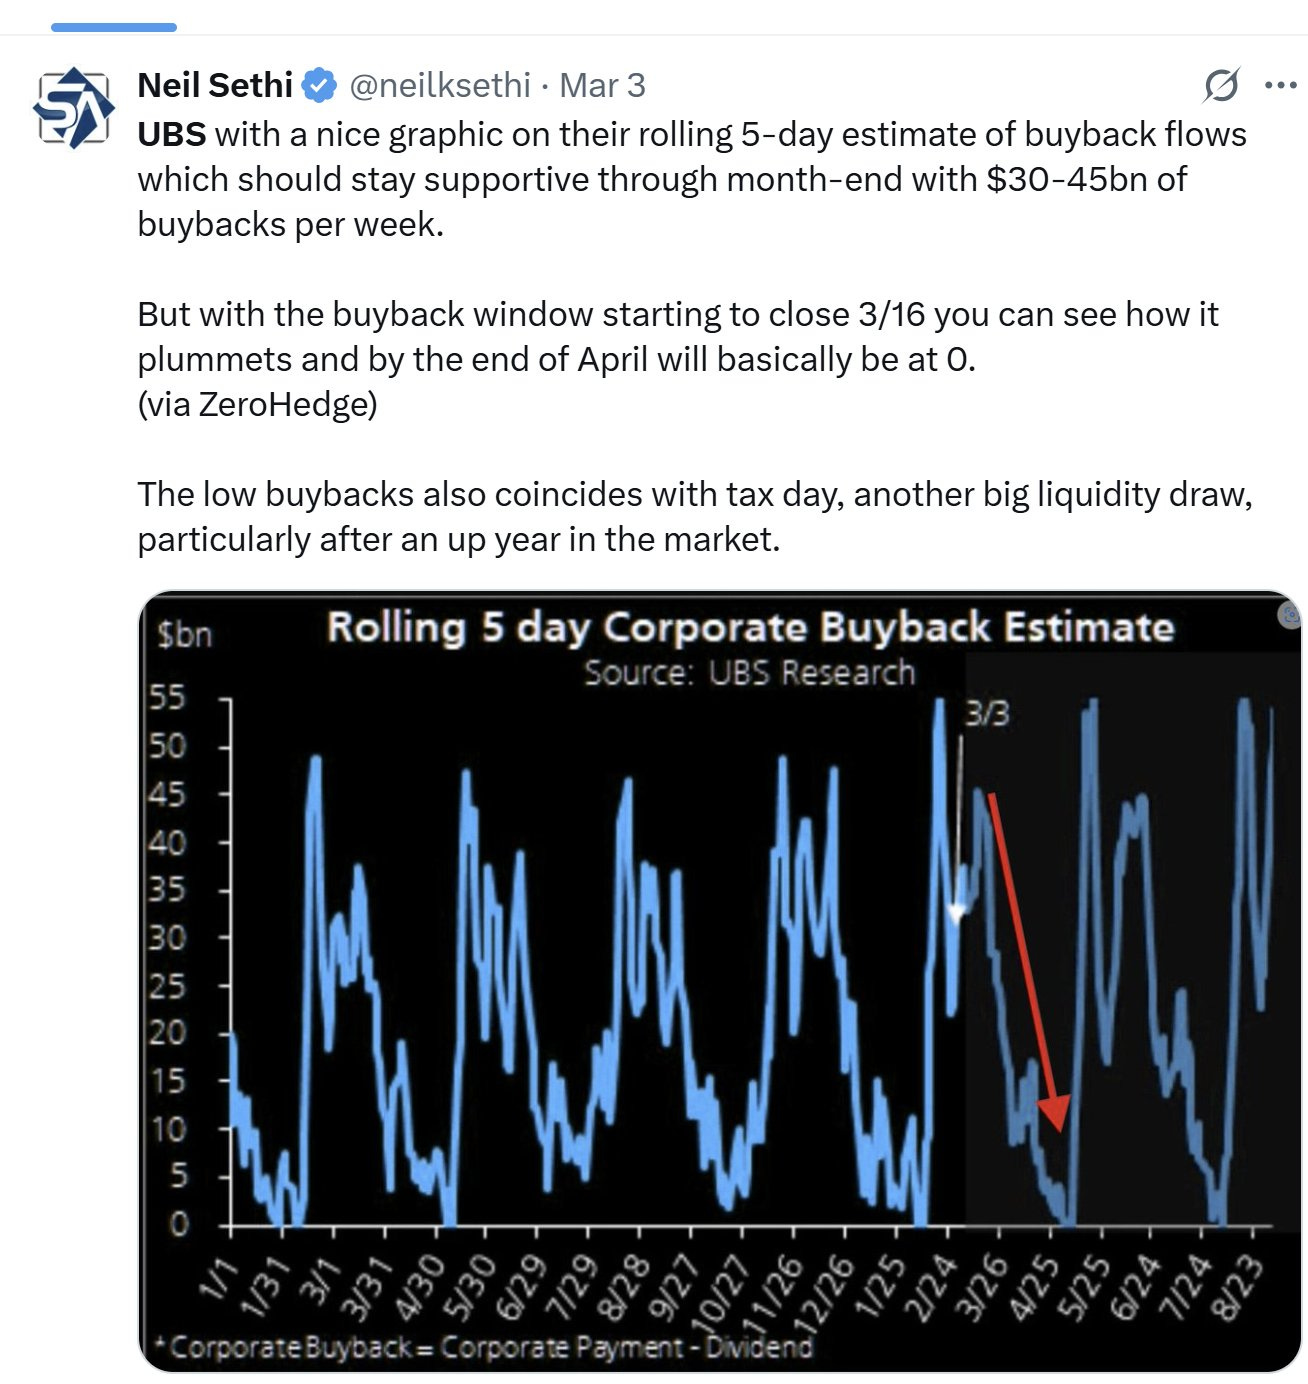
And after buybacks ended 2024 at a record, and started 2025 even better, they have slowed the past two weeks.

And some other notes on positioning:


Sentiment
Sentiment (which I treat separately from positioning) is one of those things that is generally positive for equities when its above average (“it takes bulls to have a bull market”, etc.) but not extremely and when it’s at extreme lows (“washed out”). Sentiment measures were mixed again this week but generally saw some modest improvement from mostly very bearish levels. Consistent, though, with the other indicators showing we never saw much “panic” in this drawdown (VIX, put/call ratio, etc.), these haven’t yet aligned.


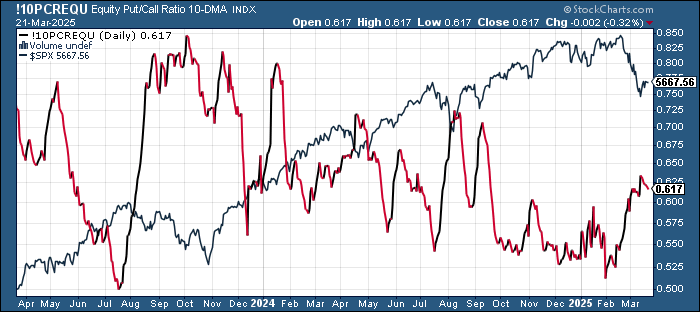
The 10-DMA of the equity put/call ratio (black/red line), which had rebounded to the highest since Sept last week (from the least since Apr ‘22 in Jan), eased off this week consistent with investors becoming marginally less demanding of downside protection, never having hit “panic” levels so far during this correction.
When it’s increasing it normally equates to a consolidation in equities and increase in volatility and vice versa.
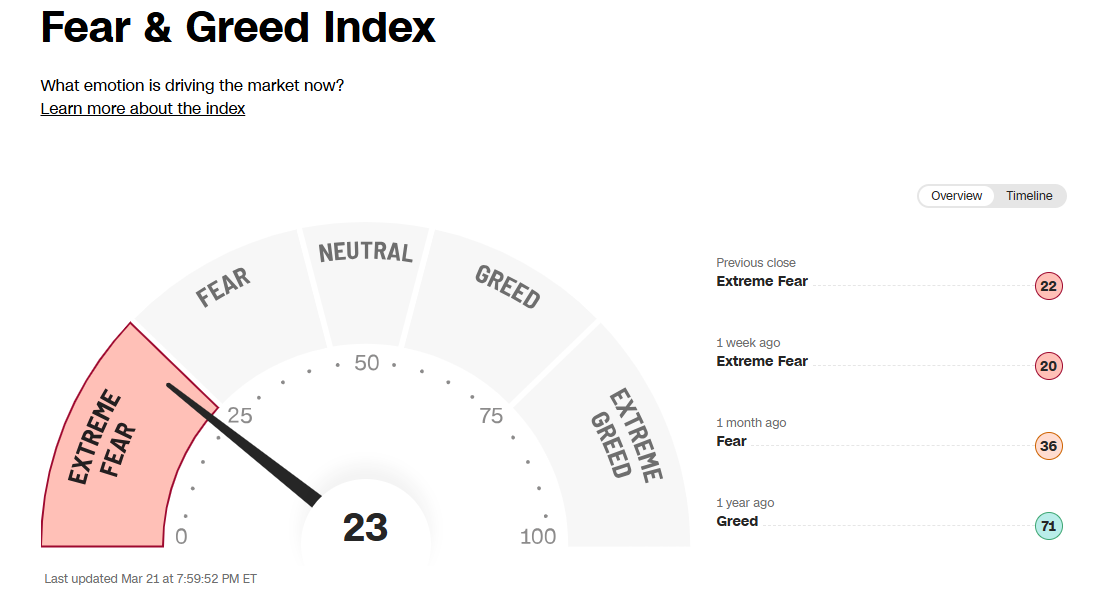
CNN Fear & Greed Index after hitting the least since Sep ‘22 Mar 10th at 14 (when bets of 2025 rate cuts hit their peak for the year) have steadily improved now at 23, still though in “Extreme Fear” up a 2 points w/w. As noted two weeks ago, the last two times readings hit that level we saw bottoms in the SPX (although the Oct ‘22 one “double tapped” (up and then back down at a higher low) so keep that in mind). The index was at 71 (“Greed”) a year ago.
Looking at the components none changed from the prior week:
Extreme Greed = None
Greed = junk bond demand
Neutral = market volatility (VIX & its 50-DMA)
Fear = None
Extreme Fear = market momentum (SPX vs 125-DMA); stock price strength (net new 52-week highs); stock price breadth (McClellan Volume Summation Index); safe haven demand (20-day difference in stock/bond returns); 5-day put/call options
https://www.cnn.com/markets/fear-and-greed


BofA’s Bull & Bear Indicator (a global metric), after falling for the first time in 10wks got back half of that drop +0.1pts to 5.3 ("Neutral"), remaining in its range of the past year, up 2.1pts from the 3.2 it hit 11 weeks ago which was nearly a 1-yr low, as “bearish sentiment in March BofA Global FMS [was] offset by bullish inflows to global stocks, strong global stock index breadth.”

Helene Meisler's followers remain bullish for a 4th straight week (and 5th wk in 6) although edging off to 60.1% voting next 100pts up, down from 67.6% the prior week (which was the most bullish since November (and before that April 2021)).

An analysis done by SPYSTSignals in Jan showed that to that point <45% and >60% results have led to better than median returns in the SPX, although that hasn't panned out so far this year. Hopefully we get it this week. Median is +0.7% w/75% hit rate.

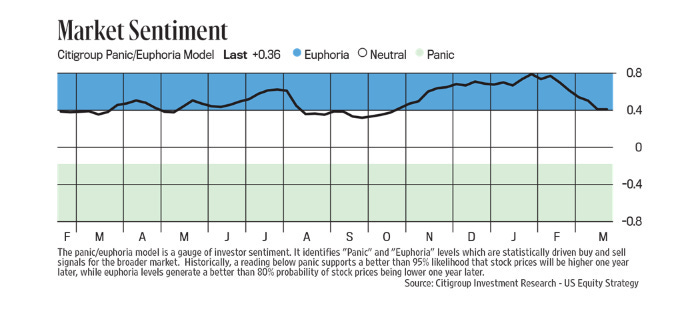
Link to Helene’s always insightful Saturday Chart Fest. Note it normally includes Citi’s Panic/Euphoria Index which was unchanged this week after falling to the least since October, right on the line of Euphoria.
As a reminder, “[h]istorically...euphoria levels generate a better than 80% of stock probabilities being lower one year later.” In that regard, it first entered euphoria in late March (when the SPX was around 5200) and then reentered in late October (around 5800).
5200 seems like it won’t happen next week, but I guess you never know (that’s a drop of -8%). We’re already below 5800 though. We’ll see if we’re still under in October.
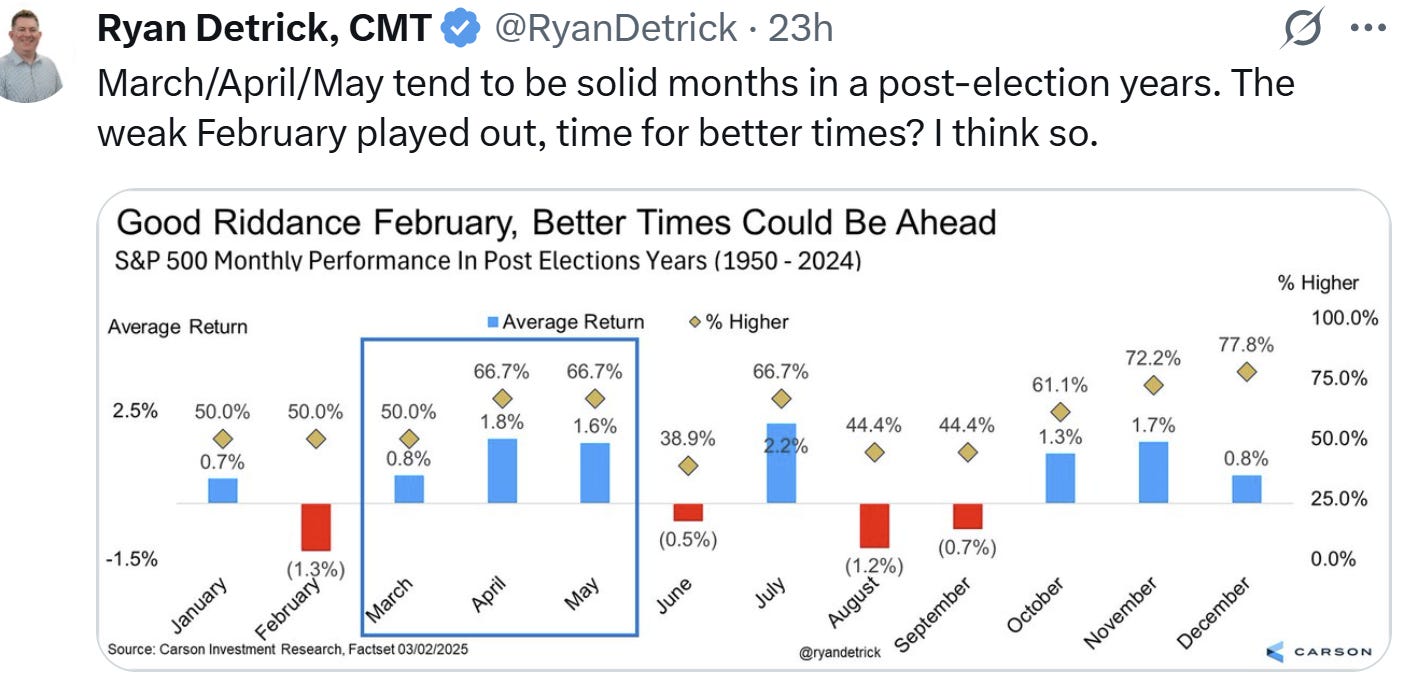
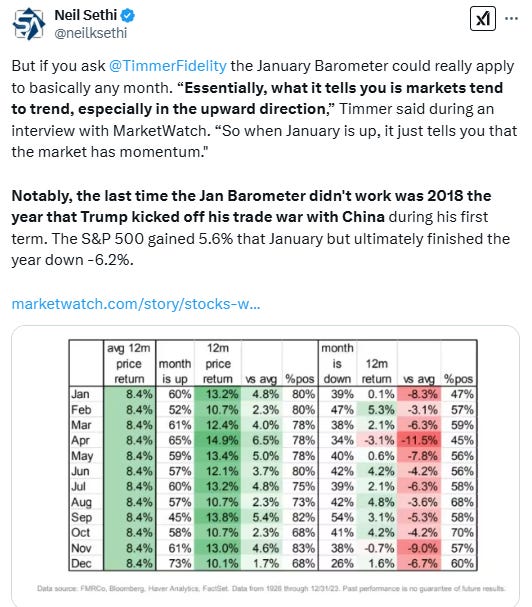
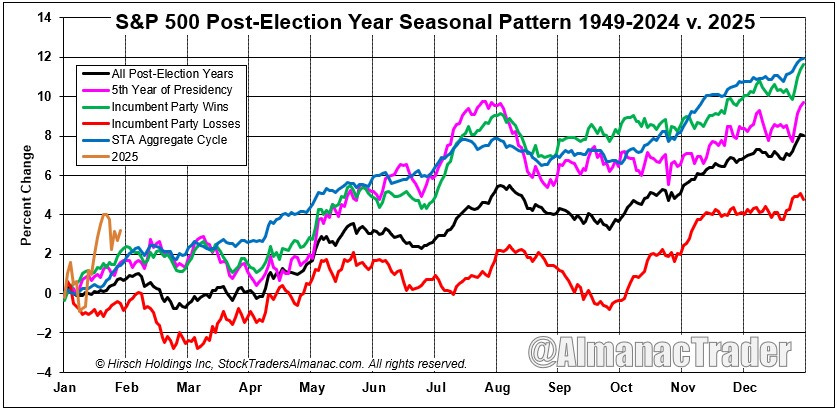
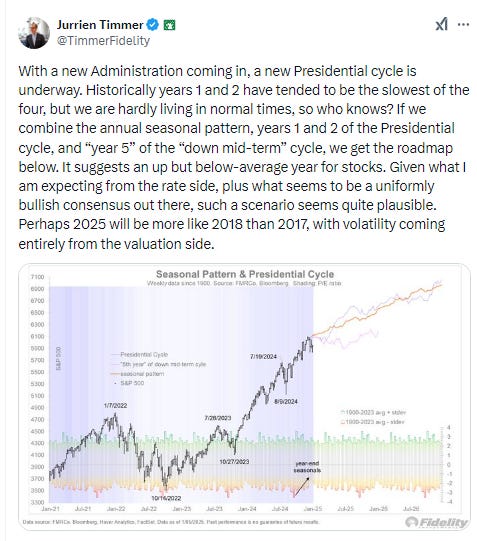
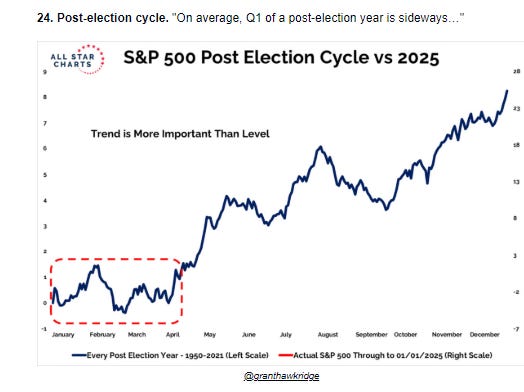
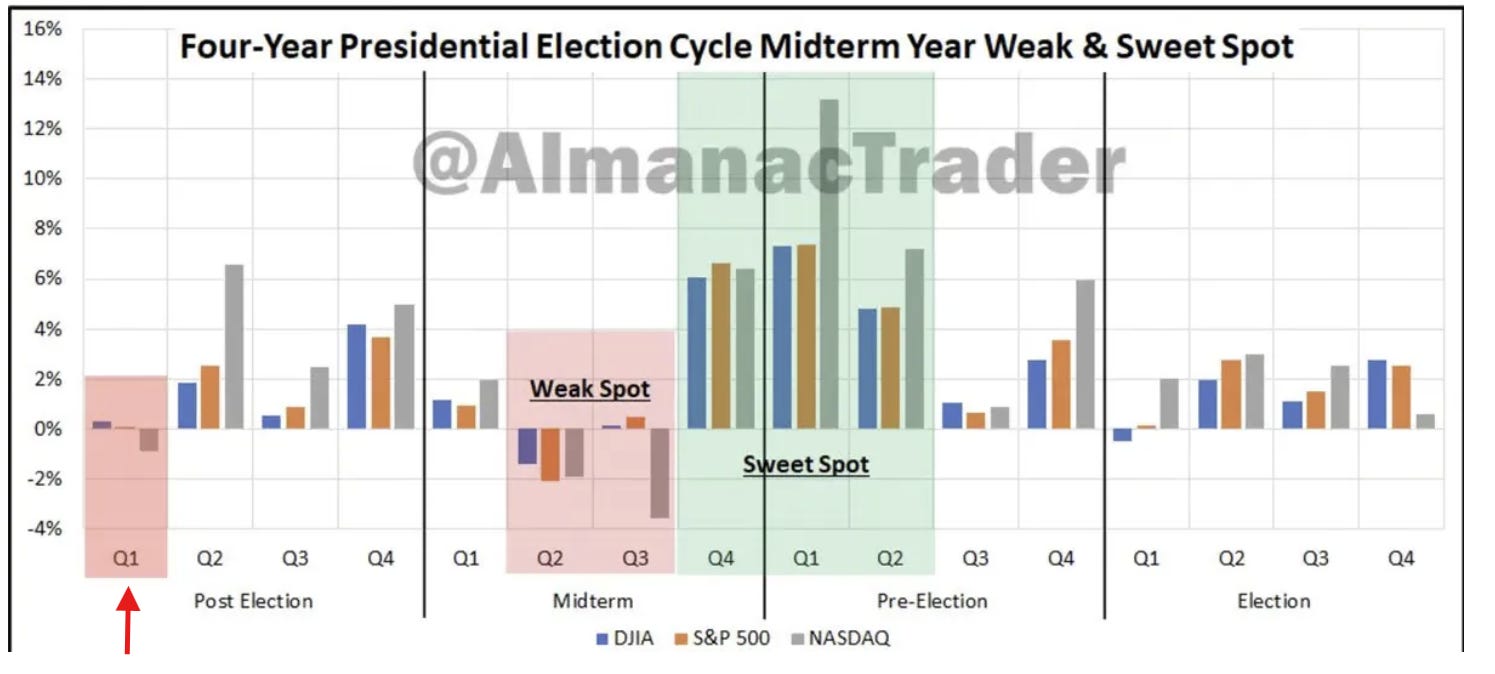
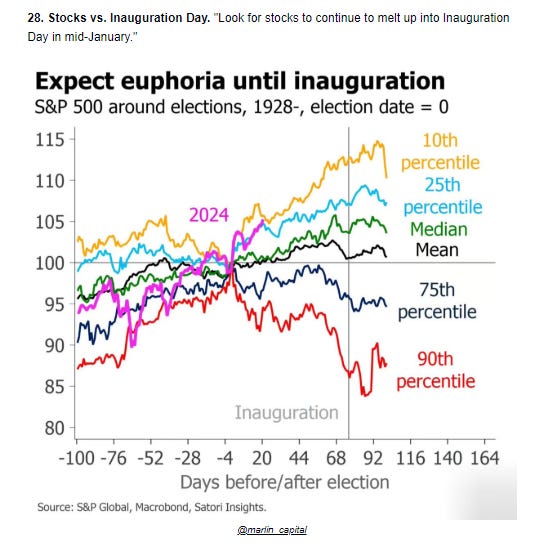
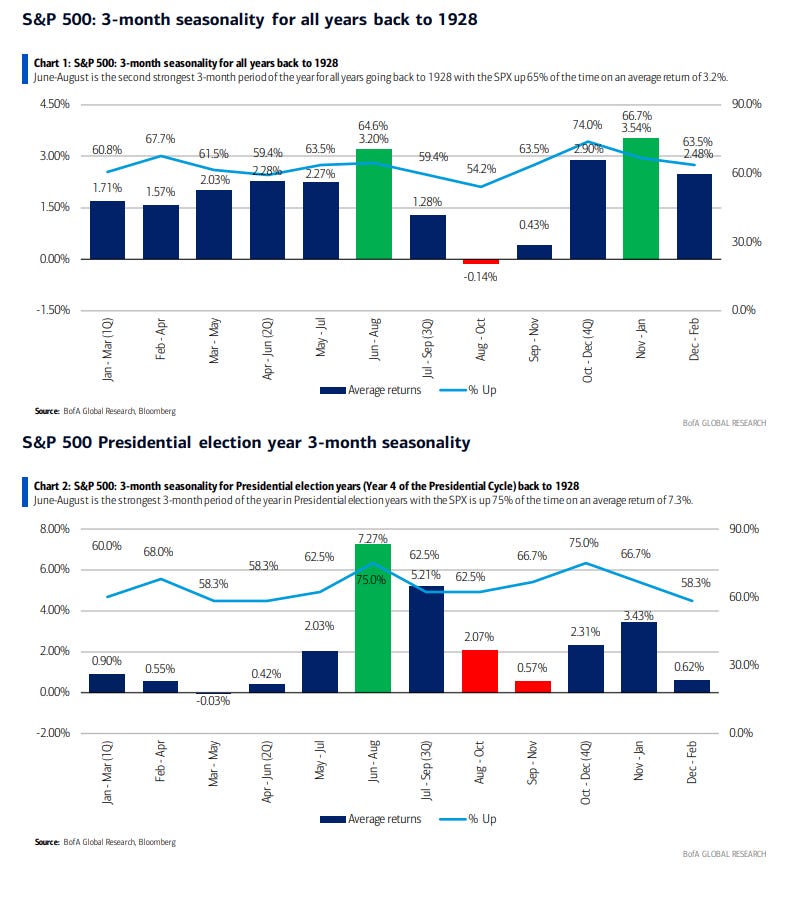
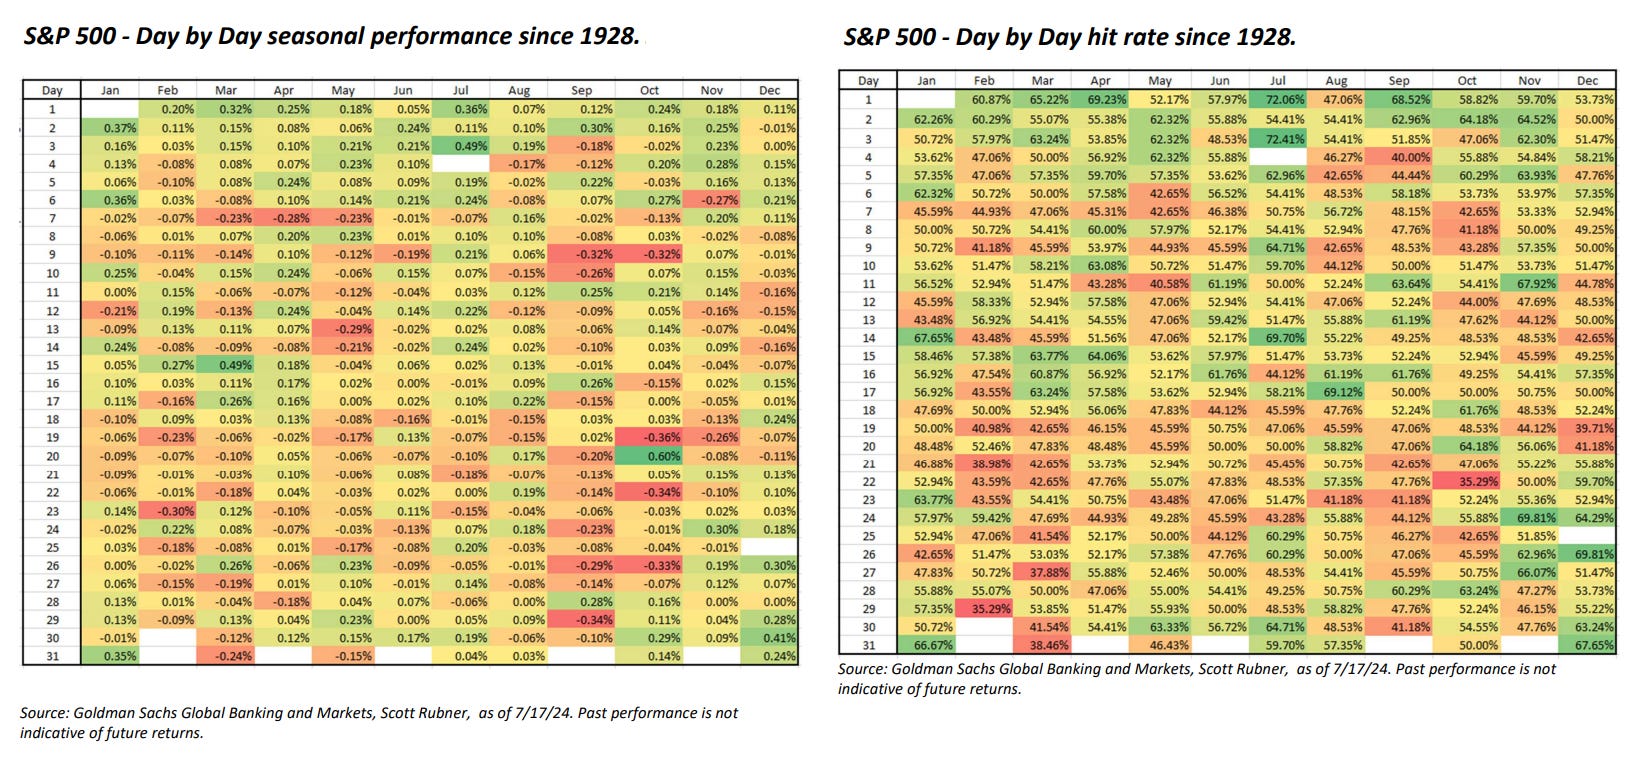
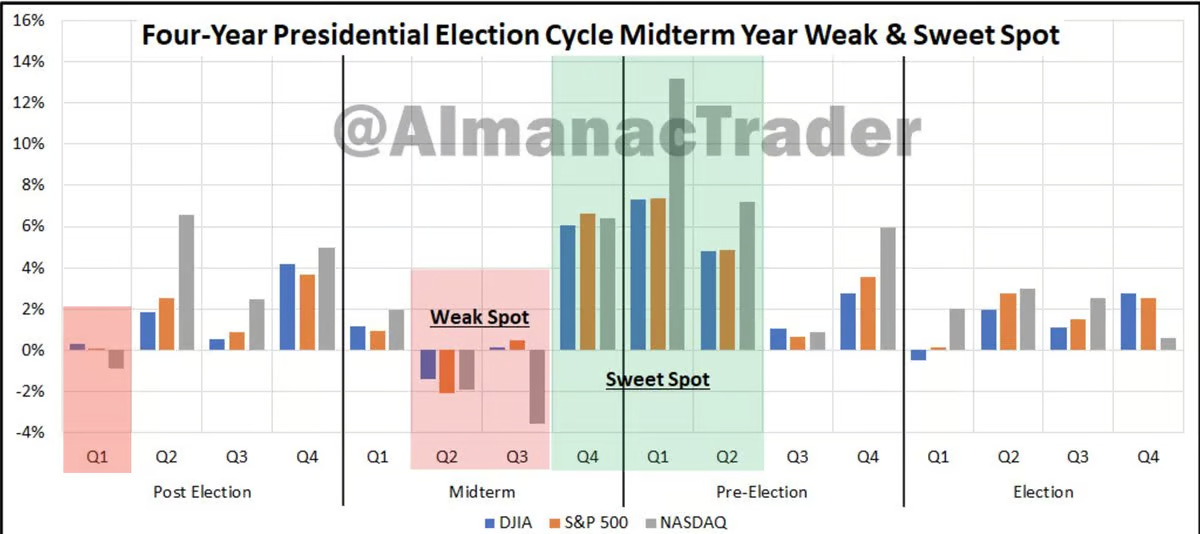
Seasonality
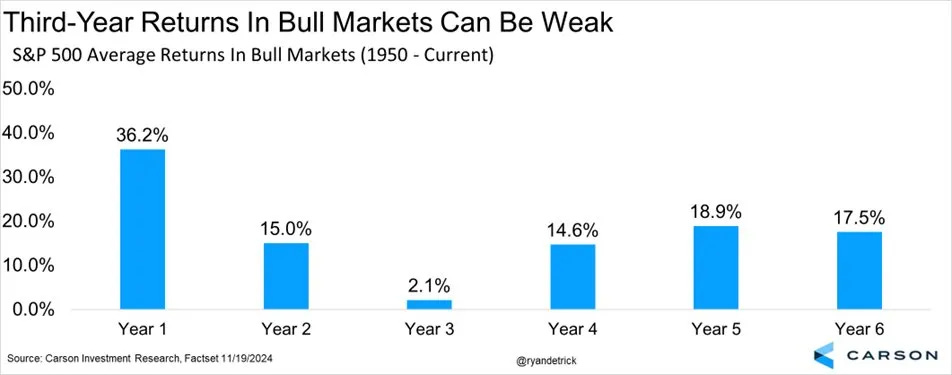
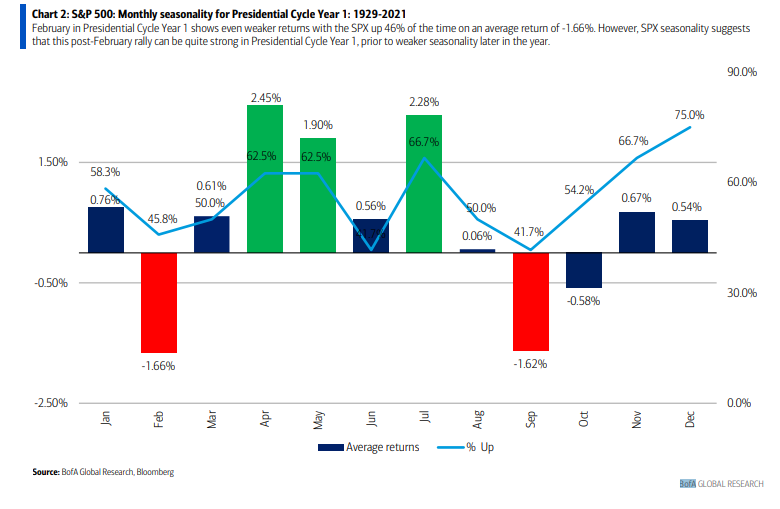
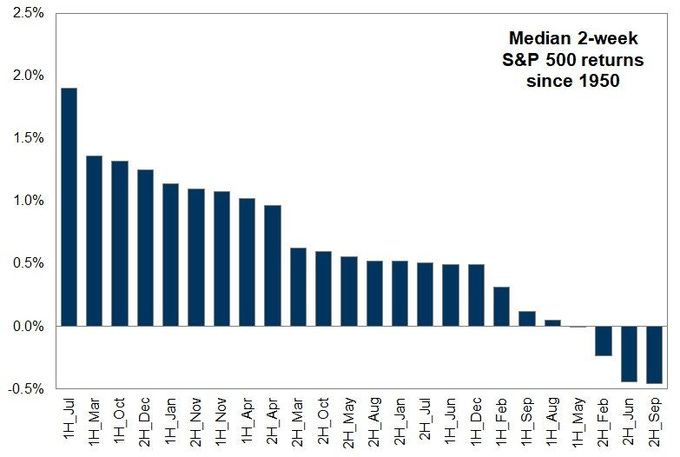
As noted at the start of the month, March is typically very good, particularly the first half, but as noted it’s not quite so strong in Pres Yr 1s (particularly this one I guess), and the second half is weaker than the first half, particularly over the last 10 years where mid-March through mid-April have been down on average. So we can add some more challenged seasonality to the cocktail mix.
Of course, as always remember that seasonality is like climate. It gives you an idea of what generally happens, but it is not something to base your decision on whether to bring an umbrella (as the Santa Rally showed us).


Final Thoughts
I noted at the start of the year,
As we turn the page into the new year, we’re presented with a very different backdrop than what we saw for much of 2024 when the Fed was moving from hiking to cutting, bond yields were falling, seasonality was mostly favorable, systematic positioning was mostly a tailwind, political risk was low, valuations had room to grow, liquidity was very robust, the economy was firing on all cylinders, volatility (until early August) was more subdued, earnings were rebounding, etc.
Now we’re in what is historically a more challenging year (1st year of a Presidential term and 3rd year of a bull market following two 20% years) with valuations well above where we started 2024, high expectations (judging from analyst SPX forecasts), higher volatility and political risk…higher bond yields (particularly real yields), a Fed talking more about fewer than more cuts and continuing to drain liquidity that is now hitting levels we’ve run into issues in the past, high earnings expectations, etc.
It doesn’t mean that we can’t have a good or even a great year. Balance sheets remain very solid as does the economy and labor markets (even if slowing), earnings are expected to be very good, buybacks are expected to be a continued tailwind, there’s a lot of scope for the Fed to become less hawkish, the upcoming administration may provide big tailwinds in tax cuts, deregulation, etc., etc. But we need to see at least some of those come through, and disappointments are not going to be welcomed given the set-up, so my expectation is for choppier markets more like we’ve seen since October than what we saw before.
And as I said two weeks ago:
“choppier markets” is definitely what we’ve seen. Each week since the end of January seems full of news events, economic data, etc., that have injected a lot of uncertainty which is anathema to markets. They have responded as such. Added to that, we have seen some weakening in economic data which has resulted in the “growth scare” I indicated might be a possibility in January. Not helping things has been the Trump administration talking about a “detox period” and “short-term pain”. All of this has seen volatility move higher (which equals selling from volatility targeting funds as discussed above) and while systematic positioning was not extreme coming into the year, it was plenty long, and that has come off in a hurry the last couple [now few] of weeks (which is the biggest reason for the recent drawdown), and now it appears they’re on the precipice of turning short.
The good news is that the economy remains in better shape than many give it credit for I think (even as some warning flags are forming), the selloff has brought valuations down (but still not “cheap”), buybacks continue (at least for next week) to be robust, breadth seems to be expanding (at least as to sectors (small caps remain unloved) but it should be remembered that to extent it’s a rotation away from the largest stocks it will be a headwind for the market-cap indices), and the Fed remains on balance tilted towards rate cuts at some point (even if solidly on hold currently). Seasonality is mixed for the upcoming week, while sentiment is pretty bearish.
And most of that remains the same, particularly the uncertainty from the administration which is denting both corporate and consumer sentiment (although they seem to be making some sounds of softening their rhetoric around how disruptive things will be, etc.). In addition to that on the negative side, we have another week until “Liberation Day,” so that uncertainty will remain high, seasonality remains poor, we’re entering the buyback blackout window so one of the biggest buyers of US equities is starting to exit, we’re walking towards what’s likely a poor PCE prices print on Friday, the technical picture is fairly weak, there’s been a rotation away from US equities (remains to be seen how far that goes), and valuations overall remain fairly expensive.
But on the positive side, the systematic selling appears to be around “washed out” levels meaning there’s a lot of room for those to reengage and overall sentiment is also in many cases at “rebound” levels, the economic data remains overall decent, the Fed on balance gave us a better than expected readout (most importantly, cuts remain their base case despite the now expected uptick in inflation), and while corporate earnings have softened they’re still expected to show fairly robust y/y gains. So the underlying picture remains positive, we probably just need to get through this week and April 2nd’s tariff announcement uncertainty which hopefully will prove to be a “clearing event” (perhaps along with March NFP next Friday). The real question for me is how much reengagement we get from systematic traders. If they can get prices moving, the momentum could carry us pretty far. But the list of negatives makes me less constructive this week than I think I’ll be a week (or two) from now.
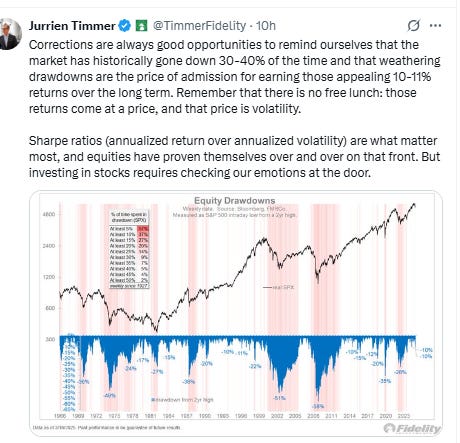
But in the long term, as always just remember pullbacks/corrections/bear markets are just part of the plan.


Portfolio Notes
I’ve decided to clean up the portfolio, trying to take it down to 50 (or hopefully fewer) positions to force me to stick with only my highest convictions (and make life simpler). I’ve had mixed success so far.
Sold out of SHOP, BAC, trimmed LVMUY, UPS, LVS, KHC, CPER, SAN, HBAN, TTE, SABR, VALE, XERS.
Added to META, INDA, EPI, USB, GOOGL
Cash = 25% (held mostly in SGOV & BOXX (BOXX mimics SGOV but no dividend, all capital appreciation so get long term capital gains if you hold for a year)
Bonds/Fixed Income (like MINT, SHY, etc.) = 20%
Positions (after around the top 20 I don’t keep track of their order on a frequent basis as they’re all less than 0.5% of my portfolio).
Core positions (each 5% or more of portfolio (first 2 around 10% each, total around 20%) Note the core of my portfolio is energy infrastructure, specifically petroleum focused pipelines (weighted towards MLP’s due to the tax advantages). If you want to know more about reasons to own pipeline companies here are a couple of starter articles, but I’m happy to answer questions or steer you in the right direction. https://finance.yahoo.com/news/pipeline-stocks-101-investor-guide-000940473.html; https://www.globalxetfs.com/energy-mlp-insights-u-s-midstream-pipelines-are-still-attractive-and-can-benefit-from-global-catalysts/)
EPD, ET, PAA
Secondary core positions (each at least 2% of portfolio)
ENB
For the rest I’ll split based on how I think about them (these are all less than 2% of the portfolio each)
High quality, high conviction (long term), roughly in order of sizing
CTRA, GILD, GOOGL, PYPL, SCHW, PFE, ARCC, AM, TRP, T, XOM, SHEL, JWN, CVS, TLH, FSK, TFC, NTR, GSK, EQNR, CMCSA, TLT, APA, DVN, OXY, RRC, JWN, RHHBY, E, ING, VZ, OWL, VSS, VNOM, SLB, MPLX, BTI, KMI, VOD, ING, O, KHC, ADNT, STLA, NEM, CCJ, HBAN, VICI, DGS, ADNT, WES, MPLX, CVE, BAYRY, SOFI, BEP, SAN, UPS, TEF, SCHD, KVUE, KT, KIM, F, MAC, GPN, LYG, ORCC, LVMUY, EMN, NVDA, BCE, OCSL, GBDC, PLTR, META, SNOW, SIG, BUD, VALE, BAX, PZZA, STZ, C, BHP, RIO, MRVL, BWA, LMT, AES, FHN,
High quality, less conviction due to valuation
Higher risk due to business or sector issues; own due to depressed valuation or long term growth potential (secular tailwinds), but at this point I am looking to scale out of these names on strength. These are generally smaller positions.
FXI, LADR, AGNC, IBIT, BBWI, STWD, PARA, CFG, YUMC, TIGO, CHWY, INDA, EPI, TCNNF, TCEHY, JD, WBA, ACCO, KVUE, KLG, HBI, UNG, CPER, EEMV, NSANY, VNQI, ST, SLV, WBD, BNS, EWS, IJS, NOK, SIL, KSS, URNM, URA, CURLF, WVFC, VTRS, NYCB, ABEV, PEAK, LBTYK, RBGLY, LAC, CMP, CZR, , LAC, EWZ, MBUU, HRTX, MSOS, SIRI, SABR, M
Note: CQP, EPD, ET, MPLX, PAA, WES all issue K-1s (PAGP is the same as PAA but with a 1099).
Reminder: I am generally a long term investor (12+ month horizon) but about 20% of my portfolio is more short term oriented (just looking for a retracement of a big move for example). This is probably a little more given the current environment. I do like to get paid while I wait though so I am a sucker for a good well supported dividend. I also supplement that with selling calls and puts. When I sell a stock, I almost always use a 1-2% trailstop. If you don’t know what that is, you can look it up on investopedia. But that allows me to continue to participate in a move if it just keeps going. Sometimes those don’t sell for days. When I sell calls or puts I go out 30-60 days and look to buy back at half price. Rather than monitor them I just put in a GTC order at the half price mark.
To subscribe to these summaries, click below (it’s free).
To invite others to check it out,