


The Week Ahead - 6/1/25
A comprehensive look at the upcoming week for US economics, equities and fixed income

If you're a new reader or maybe one who doesn’t make it to the end feel free to take a second to subscribe now. It’s free!
Or please take a moment to invite others who might be interested to check it out.
Also please note that I do often add to or tweak items after first publishing, so it’s always safest to read it from the website where it will have any updates.
As a reminder, some things I leave in from prior weeks for reference purposes, because it’s in-between updates, it provides background information, etc.. Anything not updated this week is in italics. As always apologize for typos, errors, etc., as there’s a lot here, and I don’t really have time to do a thorough double-check.
For new subscribers, this is a relatively long post. The intent is to cover the same areas each week. Sometimes the various areas are more interesting, sometimes less, but it’s easier just to go through them all, so you can expect this format (with things in the same places) each week.
The main sections are intended to cover 1) what’s upcoming next week, 2) what the Fed and rates are up to, 3) what’s going on with earnings (which along with valuations are the most important determinants to stock prices over the long term), 4) what’s going on with the economy (both because of its impact on our daily lives (I am a business investor in my “real” job) but also because it impacts earnings), 5) valuations, 6) breadth (which gets into sector/style performance), 7) positioning/flows (this is the most important determinant to asset price changes in the short term), 8) sentiment (really only matters at extremes though), 9) seasonality (gives you an idea of what normally happens), 10) “Final Thoughts” (remember you get what you pay for there, and it’s the last thing I do so it often is a bit rushed), and 11) my portfolio (to be transparent about where my money is in the market (but note first it is most definitely not intended as financial advice, and second as I mentioned earlier my main job (and investing assets) are in private industries (RE & venture capital)) so my portfolio is built with that in mind (i.e., it’s not how I pay the day-to-day bills)).
The Week Ahead
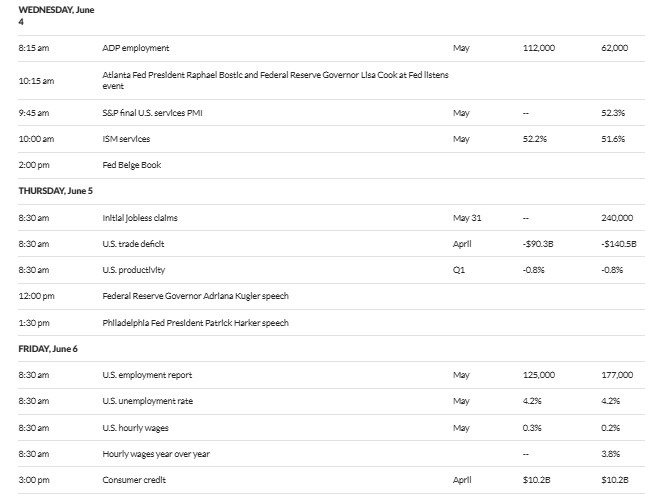
It’s the first week of the month and as is typical we’ll get a host of economic data highlighted by the Nonfarm Payrolls report Friday (125k est.) including all of our normal first week standbys in JOLTS (w/job openings expected to come in the least since 2020), ADP, Challenger job cuts, PMIs, construction spending, and auto sales, plus a few that don’t always land the first week like the trade deficit (which should see a big drop following last week’s advance on the goods data (which represent around 80% of total trade)), factory orders, and consumer credit plus the final estimate of 1Q productivity. We’ll also get the Fed’s Beige Book ahead of the upcoming June meeting in two weeks.
And of course we’ll get the standard weekly reports (jobless claims (do we continue to see continuing claims push to new cycle highs?), mortgage applications, and petroleum and nat gas inventories).
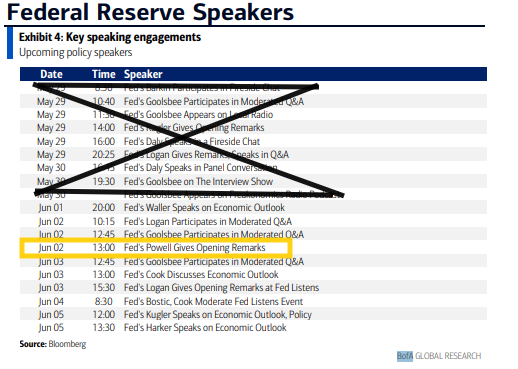
Speaking of the Fed, with the blackout coming at the end of the week we’ll continue to get quite a few Fed speakers, but we heard from most all of them last week. One we didn’t though is Chair Powell who we’ll hear from Monday at 1pm ET giving opening remarks at the Fed’s International Finance Division 75th Anniversary Conference in Washington, D.C. If he has something to say ahead of the #FOMC decision on the 18th, this is the time to say it, but I don’t think we’ll get anything new.
Outside of Powell we’ll hear from Fed Governors (generally considered more influential with 14-yr terms who vote every year) Waller, Cook, and Kugler. In terms of regional Fed Presidents (who serve 5-yr terms (up to 10 yrs) and vote on a rotating schedule (except the NY Fed Pres (Williams) who votes every year) we’ll get Logan (2x), Goolsbee (2x after 4x last week), Bostic, and Harker. We heard from all but Harker last week, but Harker is retiring after next month.
No Treasury auctions of notes or bonds this week.
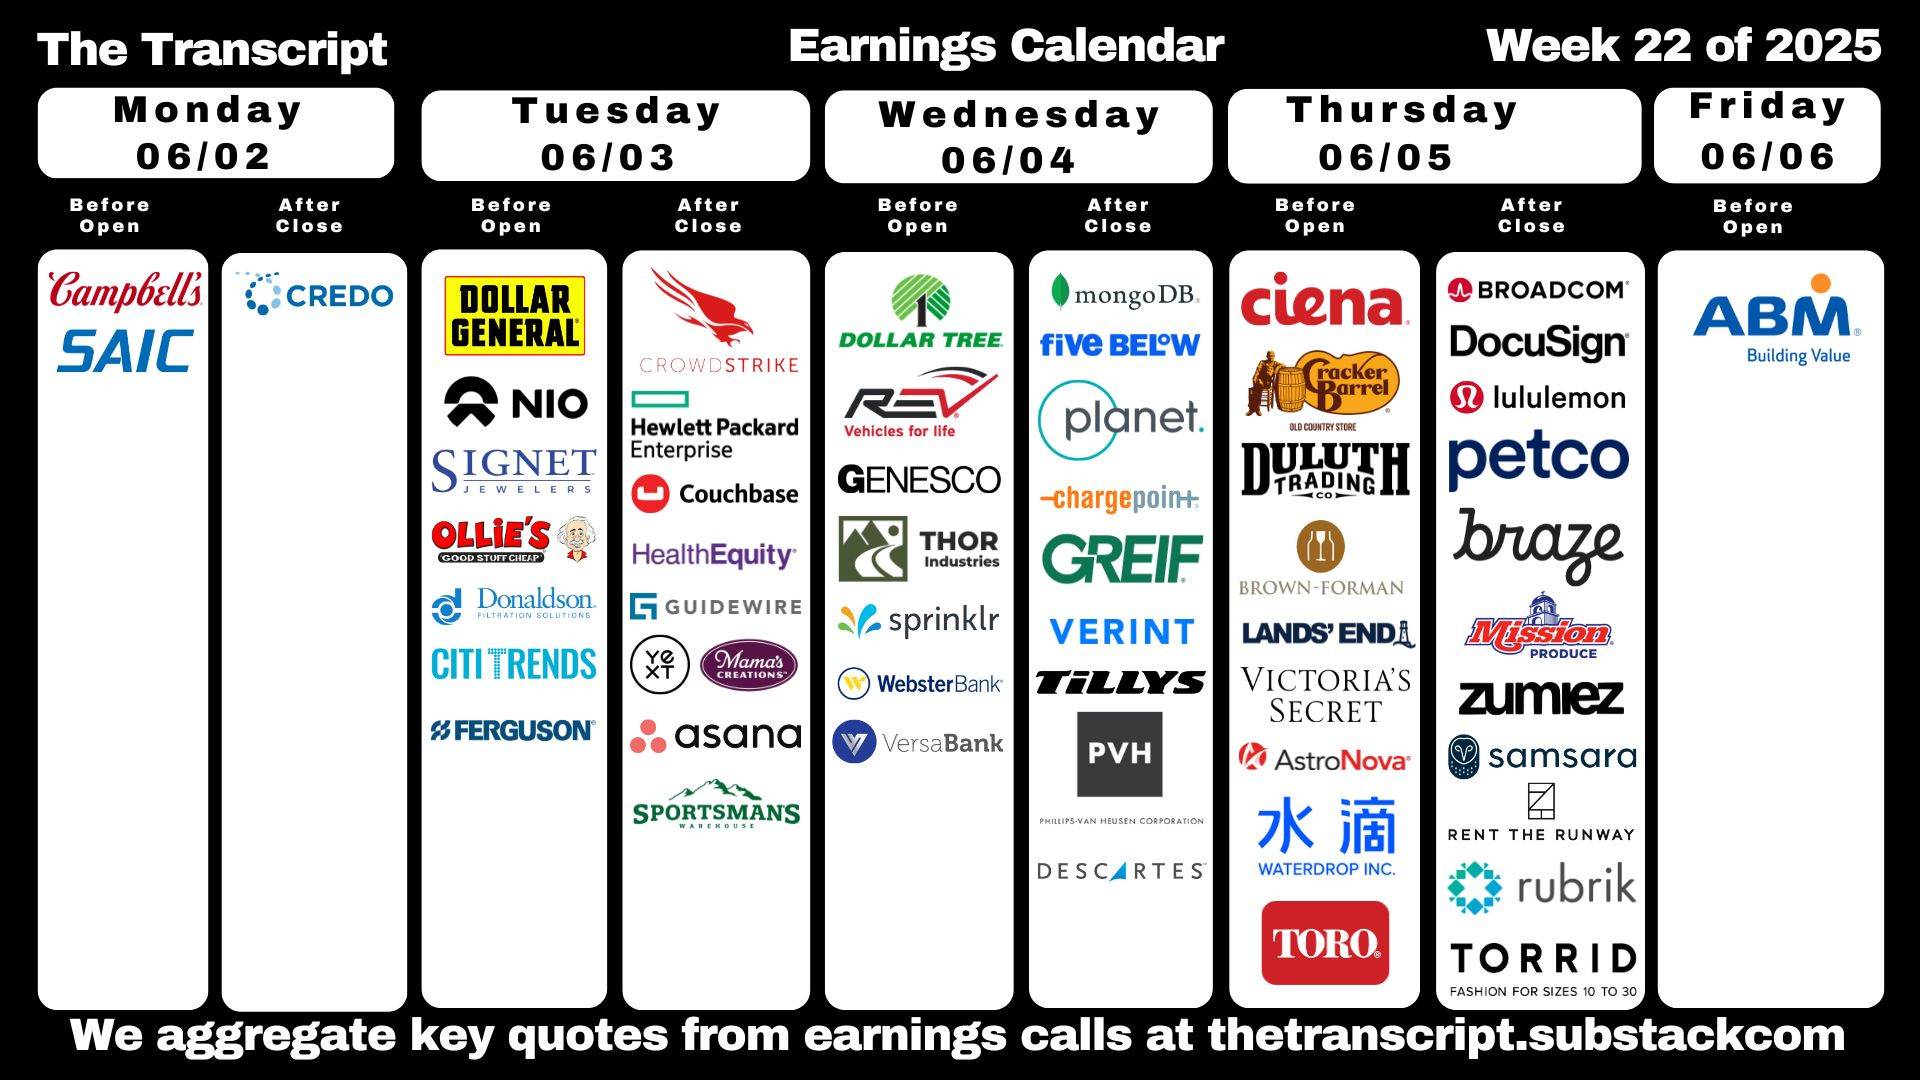
Earnings will remain light until we get to 2Q earnings season in mid-July. This week we’ll get eight SPX reporters, but we do get the 8th largest component in Broadcom (AVGO). Other than them (with a $1.1tn market cap), Crowdstrike (CRWD) is the only company reporting >$100bn in market cap.
And, of course we’ll almost certainly get plenty out of Washington to keep us occupied. Between the continuing trade negotiations, court rulings, and the Senate trying to push through the Trump tax bill, we can expect plenty of headlines, and there always seems to be something new that surfaces each week.


Note earnings date listed listed is one day in advance for some reason. From WallStNumbers.com.


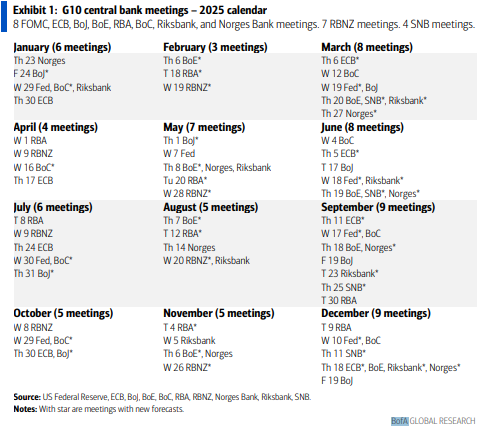
Ex-US a busy week with policy decisions from the Bank of Canada (a close call), the ECB (a cut is expected), and the RBI (India, a cut is expected) among others, a number of inflation, trade, and production reports from around the globe, including final May PMI’s, the OECD presents new forecasts at its Ministerial Council Meeting, and we'll get results from Mexico’s key judicial elections (the one branch not controlled by President Sheinbaum) will be released.

Canada
The Bank of Canada’s rate decision is a close call, with core inflation heating up even as economic growth stagnates due to the US trade war. After data on Friday showed a slight acceleration in annualized growth, traders in overnight swaps further trimmed the odds of a 25 basis-point cut to 15%. Earlier in the week, Prime Minister Mark Carney meets provincial premiers to discuss removing internal trade barriers, a crucial element of his plan to shore up the country’s economy and offset the impacts of Trump’s tariff assault.
Asia
Inflation data take center stage in Asia, with Indonesia, the Philippines, South Korea, Thailand, and Taiwan all reporting consumer price indices through the week. China’s schedule meanwhile shows Caixin’s manufacturing index on Tuesday, and its services and composite PMIs on Thursday. South Korea, a closely watched proxy for global demand, posted trade figures for May on Sunday, with data showing that the values of exports fell 1.3% from a year earlier. Manufacturing PMI’s will be released for the region Monday, offering a read on how factories there are faring amid US-led tariff uncertainty. Elsewhere, Australia will report first-quarter GDP on Wednesday, offering a clearer view of the economy’s performance at the start of the year. That will be followed by trade data and household spending figures the next day. On Friday, the Philippines is scheduled to post its unemployment rate, with analysts looking for signs of labor market resilience. India will also be in focus on Friday, with the Reserve Bank expected to deliver a rate cut as inflation cools and growth risks mount.
Europe, Middle East, Africa
The European Central Bank is almost certain to lower borrowing costs on Tuesday for an eighth time. Investors are likely to focus on clues about further moves, and similarly on forecasts that President Christine Lagarde will present that will feature varying scenarios to account for the uncertain trade backdrop. Informing officials this week will be a flurry of data in the euro zone. Inflation is anticipated to hit 2% for the first time in seven months in a release on Tuesday after reports showing weakening in the region’s four biggest economies. Compensation per employee, offering a full picture of wage growth, is due on Friday, too late for the ECB decision. Multiple reports on manufacturing will include industrial production in Spain, Germany and France, and trade and factory orders too.
In the UK, the focus will be on Bank of England appearances, most importantly testimony by Governor Andrew Bailey and three colleagues to Parliament on Tuesday. Swiss inflation on Tuesday is forecast to show the first negative reading in four years. Consumer-price data are also due in Sweden, while Riksbank Governor Erik Thedeen is scheduled to speak on Monday and testify to lawmakers along with colleagues the following day. Bulgaria will be in the spotlight on Wednesday, when the ECB and European Commission publish convergence reports on its readiness to adopt the euro. The same day, Brussels officials may scold neighboring Romania for its failure to deliver a fiscal plan to narrow the bloc’s widest budget deficit.
Nearby, data from Turkey on Tuesday are expected to show inflation slowed to 36% in May. The same day, South Africa may reveal that its economy stagnated in the first quarter as sectors including manufacturing and mining contracted. And on Friday, Mauritius’ Prime Minister and Finance Minister Navinchandra Ramgoolam will deliver an annual budget. The new government faces a budget deficit nearing 10%, almost triple what had been forecast. Aside from the ECB, a handful of other central bank decisions are due:
On Tuesday, Lesotho, whose currency is pegged to the rand, may follow neighboring South Africa and lower its key rate by 25 basis points to 7%.
Poland’s central bank is widely expected to keep borrowing costs on hold the next day.
Ukraine’s decision is on Thursday. Officials already halted a series of hikes in April, expecting inflation to ease.
And on Friday, the Bank of Russia will consider whether to cut its rate — currently at a record high of 21% — amid increased calls for monetary easing and signs the economy is starting to cool.
Latin America
Consumer price data for Peru’s megacity capital posted June 1 should show that inflation in Lima accelerated for a second month in May, though it isn’t expected to have breached the 2% mid-point of the central bank’s target range. Peru boasts the lowest inflation among its peers in Latin America, and central bank chief Julio Velarde has said it will remain within target for the foreseeable future. In Brazil, President Luiz Inacio Lula da Silva has made revamping the country’s industry a priority, and output figures have run above the long-term trend since his return to office in 2023. Against an average year-on-year rise of 0.7% overall since January 2003, industrial output under Lula 2.0 is running a percentage point higher at 1.7%, though half the 3.4% pace seen during the two terms of Lula 1.0 in 2003-2010. The early consensus for the April data sees a small monthly rise and slowing in the annual pace from March’s 3.1% reading.
Five purchasing manager indexes for May are due, with data through April showing a mixed but weakening picture in Brazil, mild expansion in Colombia and pronounced contraction in Mexico. Chile’s economy beat expectations in the three months through March, and this week’s April GDP-proxy data may point to some acceleration toward mid-year. Consumer prices may have ticked lower in May after cooling more than expected to 4.5% in April.
BoA’s cheat sheets for the week:


And here’s calendars of 2025 major central bank meetings.

Market Drivers
So let’s go through the list of items that I think are most important to the direction of equity markets:
Fed/Bonds
As noted previously this was one of the sections that had grown unwieldy, so I’ve really pared it down. Given I provide daily updates on Fed expectations, Fedspeak, and analyst thoughts on the Fed, it’s duplicative (and time consuming) to regather it all, so, again, I encourage you to look at those (the daily posts) for updates. I will just give more of a quick summary.
I’ve taken out the background information from how we got to where we were from the start of the year through the end of March, but if you’re interested you can find that in this section from the March 23rd update.
In some background, I noted four weeks ago that “I [was] expecting [the May Fed meeting] to be one of the least exciting since the Fed embarked on its rate hike cycle in 2022,” and that proved to be accurate. As I thought, Powell basically reiterated his last prior speaking appearance giving little new information, which is also in line with the vast majority of Fed speakers since the March meeting:
Fed speakers have been a broken record on the concept of the importance of long-term inflation expectations, which almost all say haven’t risen appreciably, and the overwhelming message has been that holding rates at current levels is the best path currently citing “uncertainty” and “upside risks to inflation” pared with “downside risks to growth”. Overall, I think Richmond Fed Pres Thomas Barkin might have summarized it best saying the Fed is operating in “extreme fog” not the kind where you “slow down” but the “kind where you pull over to the side of the road and put your hazards on.” Until that fog lifts, I think it’s pretty clear the Fed isn’t changing anything.
And since then things haven’t changed much:
Powell’s appearances (along with too many appearances from other Fed members to count) have continued to reiterate those points while also showing a notable lack of concern regarding the turbulence we saw in the markets following the reciprocal tariff announcement.
And despite what was a flurry of recession calls (which have since died back) from economists, the Fed members have continued to downplay growth concerns noting while they they see downside risks, the economy and labor markets remain for now “solid.” As Powell has said (reiterated by literally every speaker since the May meeting), “we don’t need to be in a hurry.” Even the dovish Chicago Fed Pres Goolsbee has talked about the Fed being “on pause”.
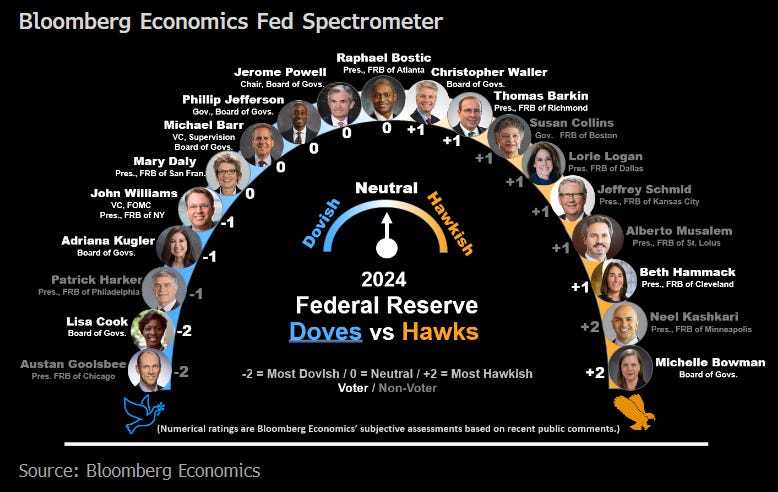
That being said, there has been some differences in how Fed members are looking forward, particularly into the second half. While many think there’s a low probability for rate cuts this year absent a serious deterioration in the labor market (regional Fed Presidents Schmid and Musalem have even talked about “leaning against” potential inflation consequences (i.e., putting rate hikes on the table)) or perhaps a chance for one (Bostic), others are more constructive led by Governor Waller. Mary Daly continues to think two cuts are a “base case,” while Goolsbee is back looking for “much lower rates” in 10-16 months.
Another place there is some difference is in how Fed members think they should respond to a situation where inflation is sticky or increasing while the labor market is weak. As noted Schmid and Musalem would not be cutting, and NY Fed President Williams, a key voice, insinuated recently that in the event of a tradeoff between the Fed’s inflation and growth goals, they should pick fighting inflation.
So as I said two weeks ago,
it seems for now the markets probably have it right that the Fed is going to wait until we get deeper into the year and some of the “uncertainty” has hopefully passed (or at least we’ve had a longer run of time with tariffs in place) regardless of what happens with inflation (i.e., they are going to “look through” any cool prints for now). They also will look through high prints focusing on market-based measures of long term inflation expectations. The only thing it seems that would get them to move would be a deterioration in the labor markets.
That said, I am starting to detect a bit of a shift. Some of the members, most vocally would-be Fed Chair Waller and Chicago Fed President Goolsbee, have started to put a 10% tariff number out as the marker that they think would allow them to proceed with second half rate cuts. I have a feeling if inflation continues to remain relatively subdued (it was basically at the 2% target in April (so Powell did get his “soft landing”)) that more members may be on board. It will be interesting to see what the updated dot plot looks like in two weeks.
And as I noted three weeks ago, as we move towards the end of Powell’s term in May 2026, which will be here before we know it, I would expect the market to start price in rate cuts from his successor. In that regard, as I said, we can look at the 2yr/1yr curve which gives us a fairly clean read now as to what markets are expecting that to mean for the difference in 1yr rates starting in 1yr. That is reflecting some change, now at -21bps from -15bps last week, but still markets are not pricing in a full cut after Powell which is surprising.

And we might also see this result in a steeper 2/10 curve which though for now has stagnated up 1bps this week to +0.52% (still though off the steepest since Jan ‘22 hit Apr 21st at +0.65%).

As a reminder, historically when the 2/10 curve uninverts following a long period of inversion the economy is either in a recession or within a few months of one. It uninverted in Sept, so I had said this looks officially like a "this time is different" situation, but Trump has put this back on the table. Still at now 9 months it does seem like this time is different.
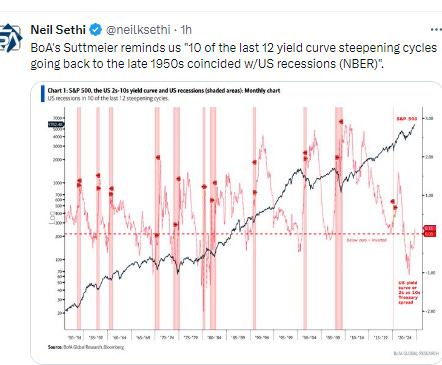
The 3mos/10yr yield curve (considered a better recession signal than 2/10’s w/the last four recessions on average coming a few months after the curve uninverted (prior to that it generally uninverted after a recession had already started)) had finally started pushing away from the 0 mark last week week at +0.15% but fell back to +0.05% this week.

As noted previously briefly reinverting is something that it did prior to (or just after) the last two recessiothose previous four instances before recession after reinverting is 6 months (2007).

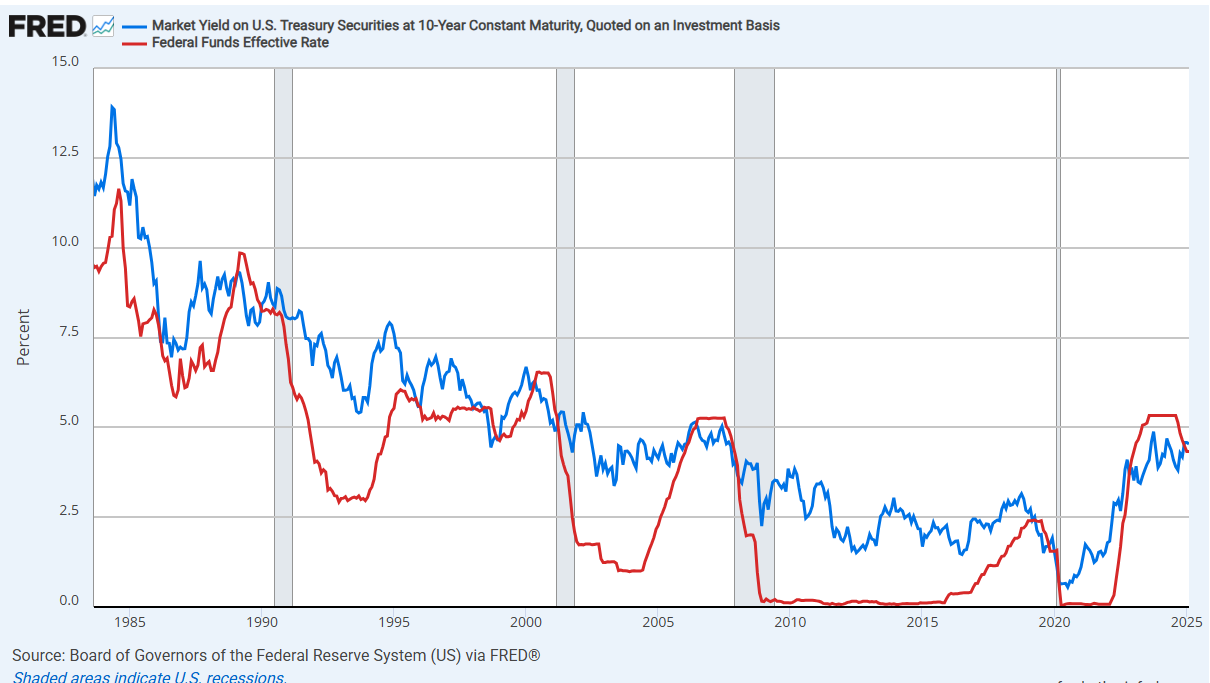
The 10yr Treasury yield also is starting to extend above the Fed Funds rate, although still very marginally at 19bps well under the typical spread of around 1-1.25%, so for now also still calling for rate cuts.
As noted previously when it’s dropped from above to below (as opposed to having the FFR move from below to above) as it did earlier this year, we’ve always seen a rate cut since 1985 although it can take as long as a year.
Long term inflation expectations as measured by the 5-yr, 5-yr forward rate (exp'd inflation starting in 5 yrs over the following 5 yrs), which continues to be referenced by Fed members (including Jerome Powell) as evidence for long-term inflation expectations remaining “well anchored,” edged up to around the highest since January at 2.29%, overall though remaining around the middle of its 4-year range.

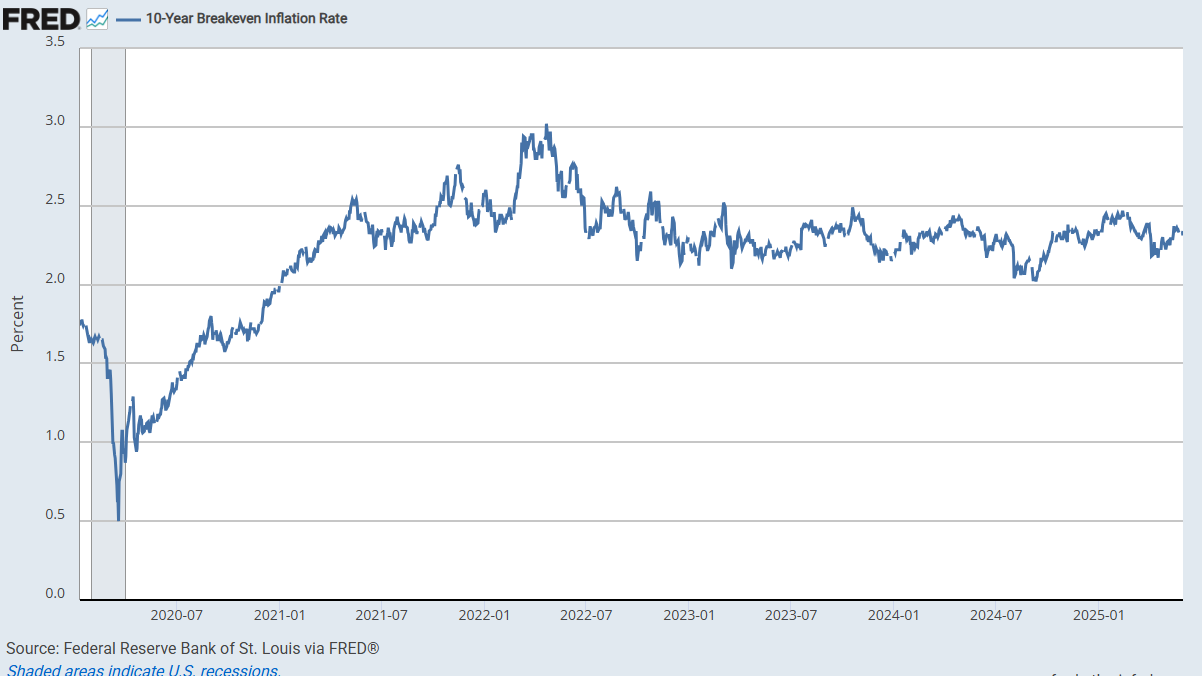
And the 10-yr breakeven rate remains in the middle of its post-2021 range at 2.34%.
With 10yr Treasury yields edging back while inflation expectations were unchanged, 10yr real rates fell back a couple of basis points to 2.18%, still just -16bps from the 2.34% mid-Jan peak (which was the highest since Oct ‘23 (and before that 2007)), well above the 2012-2020 peak of 1.12%.
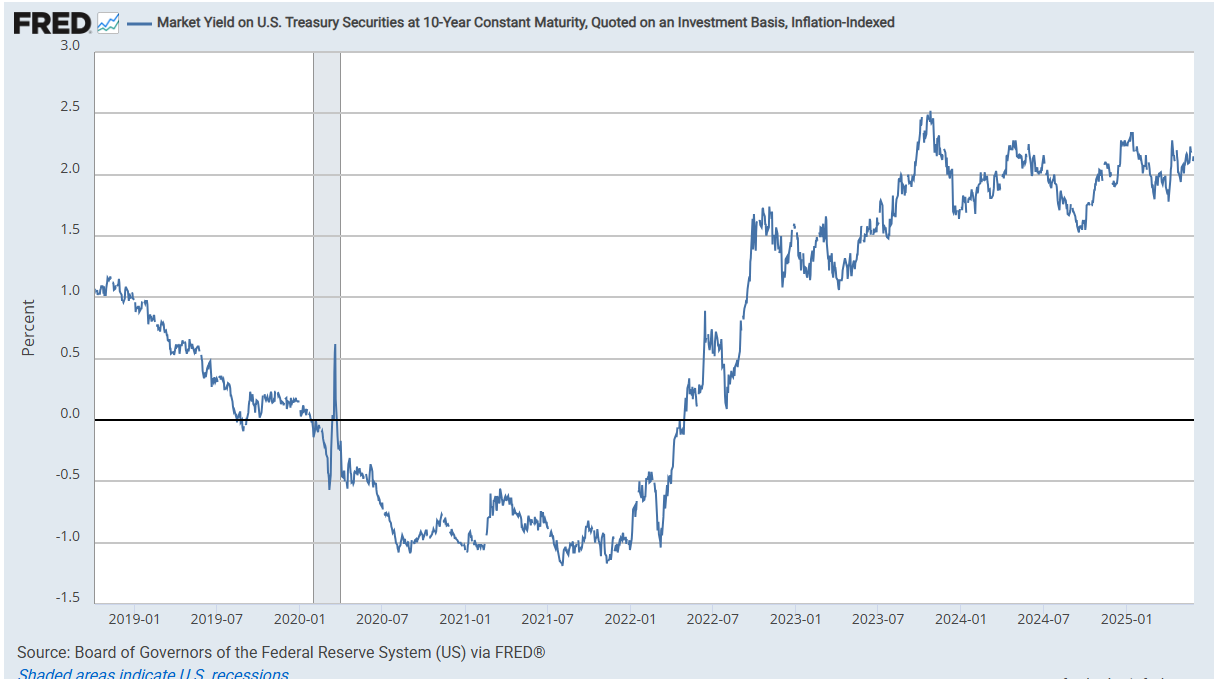
As with 10yr rates implied from market pricing, backing into 10yr real rates using 5-yr, 5-yr forward inflation expectations (subtracted from the 10yr nominal yield) similarly edged back to 2.27% Thursday, -18bps from the Jan peak. These remain over four times the 2013-2020 average of around 0.5%.

And as a reminder according to BoA the importance of real rates on equity returns has seen the largest increase in the factors they track over the past 5 yrs and explains a larger proportion of stock returns (83% correlation) in their data (to 2006), with the dollar close behind the most correlated (76%) since 2015.
Short-term real yields (Fed Funds - core PCE) rose to 1.81% in April from 1.67% in March, the highest since October, although still down from 2.70% last June, which was the highest since 2007.

Not much relief for small businesses or HELOC borrowers as the real prime rate (inflation adjusted using core PCE) increased to 5.0% from 4.8% in March, edging closer to the 5.9% last June, which was the highest since Sep 2007. It remains more than double the 10yr pre-pandemic avg.

And looking out longer term, a little surprising to many was the FOMC’s median long run projection for the endpoint of the Fed Funds rate (the “neutral rate”) remained at 3.0% (but note the average moved up to 3.11% from 2.97% (so +14bps)). It is still the highest since Sep 2018. [this gets updated in June]
The ACM model of the 10yr term premium (which is solely based on interest rates), edged down from the +0.92% hit on May 21st which was the highest since July 2014, to +0.75% Wednesday, still up +53bps since Apr 2nd but with some welcome softening of late.

The extended discussion on term premium (what it is, why it’s important, etc.), can be found in this section in the Feb 4th Week Ahead.
The MOVE index of expected 30-day Treasury note/bond volatility like the VIX is back down to around March levels.

Despite overall Treasury volatility drifting lower, 30yr mortgage spreads continued to drift higher to 2.43%, +7bps w/w, although they are just +16bps from the 2.27% hit Dec 19th which was the least since 2022, and they remain well off the 2024 peak of 2.73% and the 37-yr high of 3.1% in June ‘23. The 2025 peak was 2.53% May 1st. But they are still around +70bps above the 2010-2020 avg level.

Chicago Fed National Financial Conditions Index and its adjusted counterpart (the latter attempts to remove the correlation between the various indicators due to broad changes in economic conditions), both of which are very comprehensive each w/105 indicators, in the week through May 23rd fell for a 6th week now back down to the least (loosest) since Feb (-0.61 & -0.64 respectively and around the lows of the 2015-2020 period.
https://www.chicagofed.org/research/data/nfci/current-data


Turning to RRP, some background:
As the Fed continues to drain liquidity from the system via QT, I think it’s important to watch for stresses which give an early warning signal that they are perhaps going to far as they did in 2018 which led to a near bear market. One area I am monitoring is reverse repos (which is an overnight secured place institutions (mostly money markets and banks) can park excess funds to accrue some interest, designed by the Fed originally to keep excess liquidity from pulling down rates too much in other short term markets and provide a “risk free” place to park short-term funds). RRP grew rapidly in 2021 & 2022 as money was pumped into the system and needed a home, but since May ‘23 has been steadily drained down by the Fed’s QT program and higher bond issuance with banks discouraged by regulatory rules from taking up the increased Treasury supply.
In particular, the continued sizeable issuance of T-bills (<1 yr duration) of around $800bn/month (accentuated by the $60bn in balance sheet runoff (meaning the Fed has reduced its buying of maturing Treasuries by that amount which the private market has to fill)) drained ~$1.75 trillion from RRP in the year through March 1st. From then until early July RRP levels had remained relatively stable in the $375-$500bn range, but then resumed their decline (in fits and starts (seeing spikes at most month-ends but then coming down to hit new lows), with the lowest level hit Feb 14th at $58bn, the least since Apr ‘21 on the back of the Fed cutting RRP rates to the low end of the Fed Funds band which made parking funds there (versus lending overnight to other institutions or buying T-Bills) less attractive in line with their desire to sop up most of this “excess liquidity” (as they have described it).
As noted in previous weeks, since then RRP had rebuilt as with the Treasury up against the debt ceiling they have had to stop issuing new Treasuries only refinancing maturing ones. This has taken away a source of investment for money markets and other buyers who have had to turn to the RRP in part despite the lower rates. The expectation was for RRP to continue to slowly build until the debt ceiling is raised, at which time (when the debt ceiling is raised) it is predicted to drop quickly as the Treasury “catches up” on the Treasury issuance currently on hold, which will force the end of QT (concerns about that have already seen the Fed cut QT by $20bn), but we saw an unexpected drop in April to a new low ($54bn) Apr 16th, although they have rebounded a bit.
I noted four weeks ago the decline in RRP post-quarter end was much more than expected given the debt limit still hasn’t been raised and QT has been slowed, hitting $54bn at one point, the least since 2021. I said “this is slightly concerning to me, as the expectation was that RRP was going to build until the debt limit was raised. This leaves very little cushion, and it may prompt the Fed to turn to QE earlier than anyone is currently expecting.”
But then as noted three weeks ago, since hitting post-2021 lows, RRP had built back up to around $150bn and remained there the past month coming into this week, when we saw the typical month end jump as banks shrink their reported balance sheets at quarter/month-end when they have to report their asset mix to regulators (RRP doesn’t count against their regulatory ratios while cash & T-Bills do). I would expect this to come back down but even at $150bn it indicates there’s currently sufficient liquidity in the system.
Still expectations were that this would build while the Treasury was drawing down their TGA account (due to the debt ceiling). The fact that it hasn’t leaves insufficient cushion when the debt ceiling is raised and the Treasury boosts auctions to refill the TGA (estimates for this rebuild are as high as $450bn in extra issuance currently).


BoA who I have often highlighted pushed out their expectation for the end of QT to December, and they continue to say to watch RRP as the trigger (which they expect now to hit zero in September, but which it appears may come well before that):
"We expect the Fed will wait until after the debt limit resolution and TGA rebuild to reevaluate their balance sheet policy. We expect a debt limit resolution in late July/August, which would imply a large TGA rebuild from near $0 following the resolution....We revise our QT end date to Dec ’25 as slower QT implies a slightly longer runway. We expect the Fed ends QT after TGA is rebuilt and clearer funding pressures are evidenced. At this time we expect the Fed’s 'dashboard' of money market & liquidity indicators will clearly shift from green, past yellow, and towards red. We continue to believe UST repo is the single best indicator for flagging when QT should end."


Also (like RRP) rebounding have been the even more important bank reserves after touching $3tn in April (which is the level where we saw indigestion in the credit markets in March ‘23 (which contributed to the banking issues (SVB, etc.)). Robert Perli, head of the SOMA desk of the NY Fed confirmed we did see some of that in April.
Bank reserves (which are reported on Wednesday so before the jump in RRP on Friday) edged up to $3.3tn this week maintaining a good cushion over the $3tn level where we’ve seen issues in funding markets (this April and March ‘23 most notably). They hopefully will be safe until we get the debt ceiling raised, at which point the Fed may have to step in to add liquidity as the Treasury re-funds the TGA (see RRP discussion).


For background on various estimates of when reserves will be “too low” see the Feb 4th Week Ahead.
Getting back to rates, I said back in April 2024 that 2-year Treasuries were a good buy at 5%, and as I noted once the Fed started its cutting cycle thereafter the ship has likely sailed on seeing those yields anytime soon (meaning years). In terms of 10yr’s I had advised then grabbing some at 4.7% (which I subsequently sold on the drop under 3.75% as posted here in September) but at the time seemed like something we wouldn’t see anytime soon, but we got back there in January (and I added some as posted here) but it seemed like we might be headed much higher until Treas Sec Bessent noted the administration’s focus on keeping the 10yr yield low (and perhaps more importantly committing to the auction schedule set up by Sec Yellen for the next few quarters in both of the Quarterly Refunding Announcements, which has exerted downward pressure on 10yr yields). I sold that small position on the dip under 4% in April, and it seemed like we were poised to get back up there before they turned down not quite reaching those levels. Yields are currently on a trendline from the Apr lows, so we’ll see where we go from here.
Overall, while 10-yr yields did briefly leave my “2025 likely trading range of between 4 and 5%,” in early April (for one day), it seems like we’re solidly bac in it, which I expect to continue for now.
I still believe that if we do get a recession with the unemployment rate rising over 4.5%, job losses in the employer’s payroll survey, and contractions in consumer spending and business investment, then we’re likely to see 3.6% again (and probably lower). In terms of how high they could go, I still have a hard time seeing them sustaining for long above 5%.

For all the old “final hike” and “first cut” materials, you can reference the Feb 4th blog post.
Note BoA’s Dove-Hawk chart (which they acknowledge is badly in need of an update) is missing Hammack in ‘26 (Cleveland and Chicago vote every 2 yrs), but otherwise looks right. Also note that Philadelphia Fed Pres' Harker’s replacement has been named. She will vote in 2026. While little is known about how she views policy, she does come from Chicago which is headed by the more dovish leaning Goolsbee (but she’s been there for two decades).
One changed has been Hammack (who was previously on the record that there shouldn’t be any cuts unless the labor market weakens dramatically) who now seems to be looking for reasons to cut rates, although probably not until 2H. Goolsbee is the most Dovish but he has cut back his aggressive talk due to concerns about tariffs.

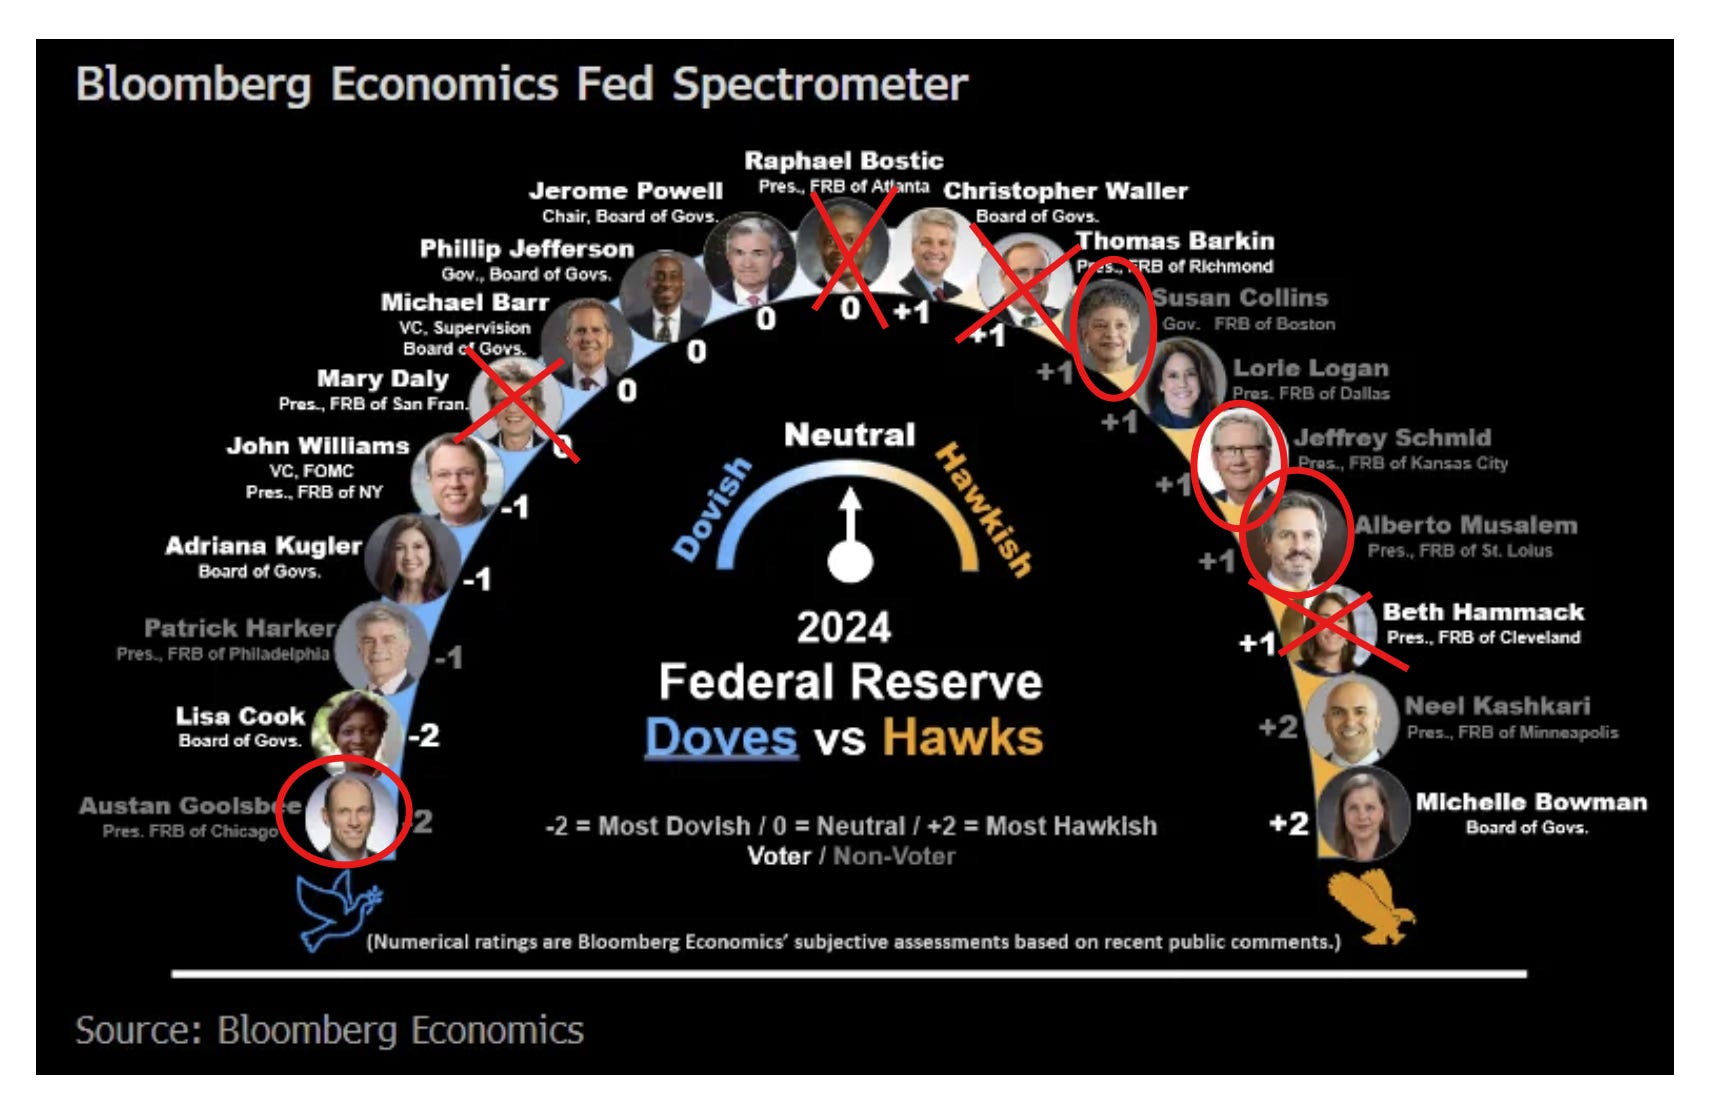
And I came across one from BBG. I think it’s pretty accurate except Kashkari is definitely not that hawkish (he was calling for a December cut in early November):
And here who is rotating off and on for 2025.
Found another FOMC hawk/dove chart to add to my collection. This one from Barclays. Seems pretty accurate except have to wonder how hawkish Hammack really is considering she was talking about a June rate cut right before the blackout. Also, don't think Daly is all that hawkish given she said she was looking for two cuts this year that week as well.
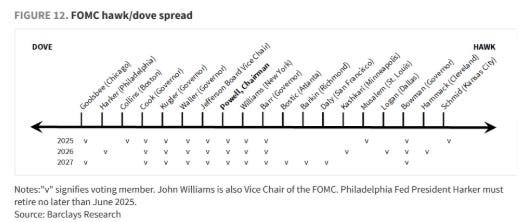
And on Harker’s replacement in July.

Earnings
As a reminder, I have removed most of the background material, which you can get in the Feb 4th blog post. You can reference this post from 12/1/24 for stats on 3Q, and this post from 3/9/25 for stats on 4Q.
98% of SPX earnings were in for Q1 as of Thursday morning) the beat rate remained at 78% above both the 5-yr avg of 77% and 10-yr avg of 75%, and earnings are coming in on average +8.3% above estimates below the 5-yr avg of 8.8% but above the 10-yr avg of 6.9%.

The result of the overall beat rates has been earnings estimates for Q1 are now at +13.3%, +0.4% w/w, and up from 7.2% at the start of the quarter (Apr 1st), and also up from the +12% to start the year. This will be the 8th consec quarter of earnings growth (and 2nd of double digit growth).
The +6.1% improvement since the start of the quarter is below than the 5yr average of +7.4%, but above the 10yr (+5.6%) and 1yr (+3.7%) avgs, a little below Q4’s +6.5%.
Actual earnings by the end of the quarter have not surpassed expectations at the start of the quarter in now only 3 of the past 42 quarters (Q1 ‘20, Q3 ‘22, and Q4 ‘22 are the only exceptions according to Factset).
In terms of Q1 revenues, Factset says through Thursday morning 64% have beaten equal to the 10yr avg of 64% and the 5-yr avg of 69%, and beats are still just +0.8% well below the 5-yr & 10-yr avgs (2.1% & 1.4%). Since March 31, positive revenue surprises reported by companies in the Health Care sector have been the largest contributors to the increase in the overall revenue growth rate for the index over this period.

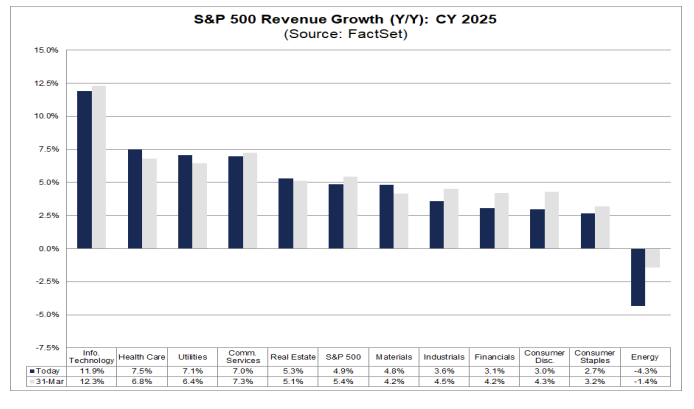
Despite the weak beat rate, SPX co’s are still expected to see revenue growth of 4.9% y/y, in Q1 up from +4.4% on March 31st. It is the 18th consecutive quarter of revenue growth for the index. Industrials was the only sector not to report a y/y increase in revenues.

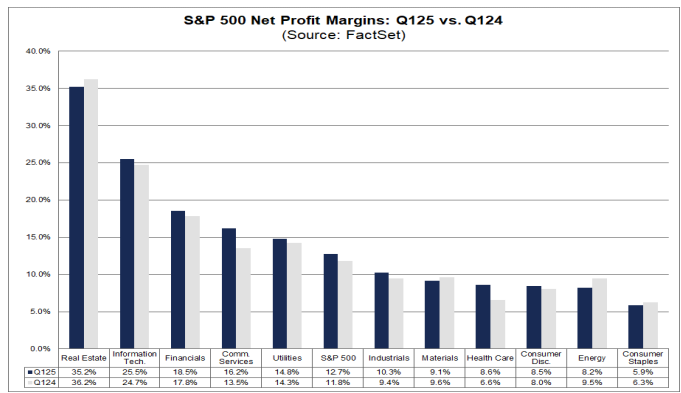
In terms of Q1 profit margins, Factset says those are expected to come in at 12.7%, up from 12.6% in Q4 and from 11.8% a year ago and also above the 5-yr avg of 11.7%.
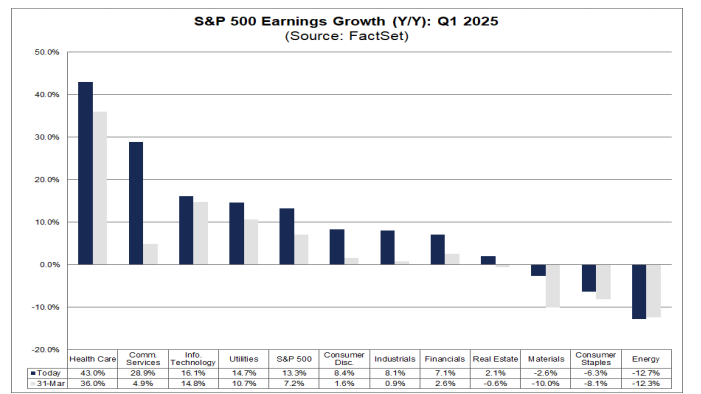
At the sector level, seven sectors are reporting (or have reported) a year-over-year increase in their net profit margins in Q1 2025 compared to Q1 2024, led by the Communication Services (16.2% vs. 13.5%) and Health Care (8.6% vs. 6.6%) sectors. On the other hand, four sectors are reporting (or have reported) a year-over-year decrease in their net profit margins in Q1 2025 compared to Q1 2024, led by the Energy (8.2% vs. 9.5%) and Real Estate (35.2% vs. 36.2%) sectors. Six sectors are reporting (or have reported) net profit margins in Q1 2025 that are above their 5-year averages, led by the Communication Services (16.2% vs. 11.9%) sector. On the other hand, five sectors are reporting (or have reported) net profit margins in Q1 2025 that are below their 5-year averages, led by the Materials (9.1% vs. 11.1%) sector.
While Q1 earnings expectations edged higher to 13.3% y/y growth, Factset says the rest of 2025 were mixed but overall little changed after having been marked up the prior week for the first time since the start of earnings season:
-Q2 -0.1% to +5.5% (-4.1% past 8 wks, -8.1% last 18 wks),
-Q3 unch at +7.2% (-4.5% past 8 wks, -8.2% the past 18 wks),
-Q4 +0.1% to +6.2% (-5.1% past 8 wks, -10.5% the past 18 wks).

Factset says the drop in Q2 earnings of -4% since March 31st has been larger than the 5-yr and 10-yr avgs of -2.6 & -2.5% respectively and is the largest since Q4 ‘23.

All eleven sectors have witnessed a decrease in their bottom-up EPS estimate for Q2 2025 from March 31 to May 29, led by the Energy (-18.9%) sector. Next was Cons Discr at -6.6%.

With the drop in Q1 expectations outweighing the slight gain in Q2 & Q3, Factset says expectations for 2025 as a whole fell to the least since the start of their tracking at $264.49 (~-$9.63 since Dec 31st).
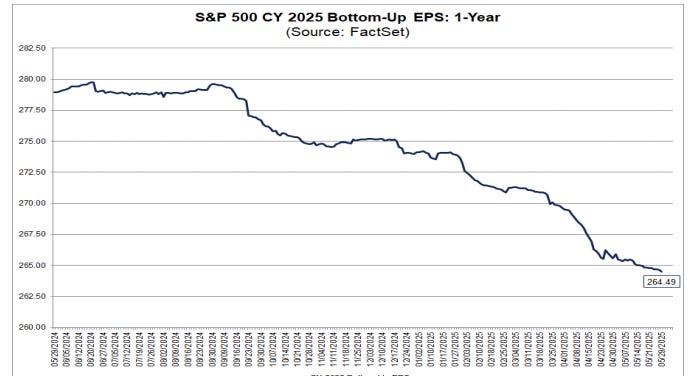
That though still represents a pretty healthy growth rate of +9.1% for 2025 earnings, but that’s also down from 12.6% Dec 31st. A larger drop than average over that period of time according to Factset. Every sector has seen their growth rates decline except Comm Services, led by Energy, the only sector expected to see negative y/y earnings growth in 2025.

Factset: The -3.5% drop in 2025 earnings expectations (not sure why they have a different number here) is larger than the 5 & 10yr avgs (-3.2 & -2.3% respectively).

Factset: Ten sectors have witnessed a decrease in their bottom-up EPS estimate for CY 2025 from December 31 to May 29, led by the Energy (-17.6%) and Materials (-11.8%) sectors. On the other hand, the Communication Services (+2.3%) sector is the only sector that recorded an increase during this period.

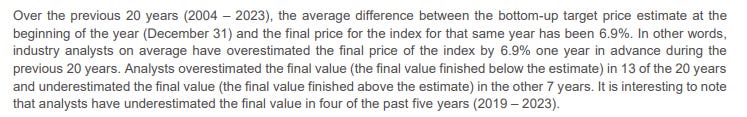
In terms of the earnings growth exp’d for 2025 Factset notes it will be a record, although also notes that there is on average over the past 25 yrs a -6.3% deterioration from where it starts the year ($275.05) w/analysts overestimating in 17 of those yrs (which would equate to $257.72 based on the average deterioration). But it should be noted that average includes 4 outlier years (2001, 2008, 2009 & 2020) where the overestimation was b/w 27-43% due to recessions. Excluding those, the difference is just -1.1% (which would equate to $272.02 (a little below where we are now)).
2025 revenues are expected to grow +4.9% down -0.9% since Dec 31st.
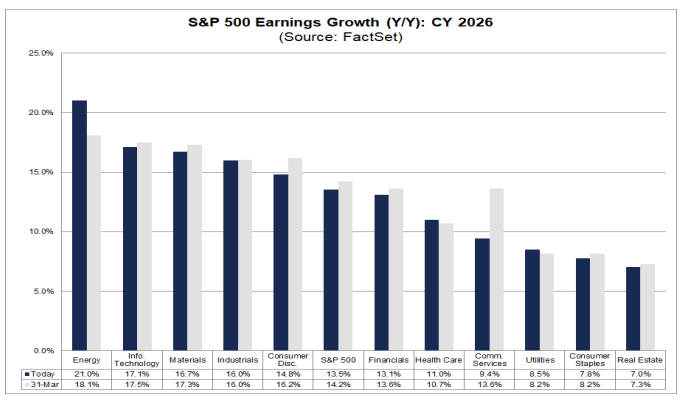
The softening to 2025 earnings expectations (now down to +9.1% y/y growth from over 14% at the start of the year) has been matched by 2026 expectations which have remained near +14% all year (as of Thursday +13.5%, -0.2% since Dec 31st), as they've tracked 2025 lower on an EPS basis.
In terms of how markets are handling earnings beats & misses for 1Q, it seems investors are continuing to take a glass half-full approach as looking 2 days before to 2 days after an earnings release, Factset says beats have seen a +1.9% reaction, the best since Q3 ‘22 (+2.4%) and versus the average of +1.0% the last 5 yrs, while misses are being punished less than average (-1.9%, the smallest since Q4 ‘23 & vs 5-yr avg of -2.3%). That said, take this with a grain of salt as the vast majority of reports came in the context of the huge market rally from the Apr lows.

Factset posits that some of the reason for the better than normal reaction to earnings surprises is better than average guidance for 2Q with 46% of the 78 companies that have provided guidance on the positive side above the 5yr & 10yr avgs (43 & 38%).
Factset’s analysis of analyst bottom-up SPX price targets for the next 12 months as of Thursday saw a second increase after 10 weeks of decreases (the longest period of softening since 2022) +51pts w/w to 6,582 (still -459 pts last 12 weeks, but +55 pts past two weeks) which would still be +11.3% from Thursday's close.
Energy (+20.4%, down from +21.0% the prior week but up from 15.4% two weeks ago) remains the sector having the largest upside seen by analysts followed by Health Care (+19.0% down from +20.7% the prior week), while Financials (+5.6% down from +6.5% the prior week (but up from +3.9% two weeks ago) and Industrials (+5.7% down from +6.4% the prior week but up from +4.7% two weeks ago) are the sectors expected to see the smallest price increase.
As a reminder the last 20 yrs they have been on avg +6.3% too high from where they start the year (which was 6,755), but note they underestimated it five of the past six years (including 2024).

Factset: In terms of analyst ratings, buy and hold ratings continue to dominate at 56.4% & 38.5% (buy ratings are up from 53.6% in Oct ‘24 but have now fallen three tenths the past two weeks), while sell ratings edged down to 5.1%.
Energy (68%), Communication Services (68%, +3% w/w), and Comm Services (65%) sectors have the highest percentages of Buy ratings, while Consumer Staples (39%) has the lowest percentage. Utilities leads sell ratings at 9% (-1% w/w).

And some other earnings stuff:

Economy
Over the past 2+ years part of my earnings optimism has been due to the economy holding up better than expected. While earnings only track the economy loosely (and markets look forward 6-12 months), there is a clear positive correlation between the economy and earnings (particularly a weak economy and weak earnings), and there is a very strong correlation between earnings and stock prices (although stock prices (being as noted forward looking) generally fall in advance of a recession and bottom 6-9 months before the end of one). So if you can see a recession coming it is quite helpful, although very difficult (especially ahead of the market). You can reference this Week Ahead (see the Economy section) for a lot of material on how every recession is preceded by talk of a “soft landing” as close as a month before the start. That report also has the notes about how small caps have shorter debt maturity profiles and more of it (debt).
The intro will likely remain unchanged for the time being as it serves as introductory material:
As long time readers know the beginning of this section hadn’t changed much until this year since I switched to the Week Ahead format in mid-2022, with the indicators to me during that period consistent with solid (which at times has been robust) economic growth, and I have been a broken record that I “certainly do not think we’re on the verge of a recession (although as noted above every recession starts out looking like just some economic softening).”
That said, I started noting in February that the January data had taken a turn for the worse. However, I also said January could be written off due to poor weather, and in that regard we did see some bounceback in most of the “hard” data in February. As we got the March data last month, I noted the pattern had continued with the hard data generally continuing to come in good to very good (the “very good” normally though likely due to tariff front-running), while the soft data continued to deteriorate.
As we have now mostly finished up the April data and rolled into May, that pattern continues. This week was relatively heavy on data, and it continued to be mixed, but in a change this week the soft data was perhaps better than the hard data. On the negative side, durable goods orders were weak at the headline on Boeing orders and the core capital goods orders (proxy for biz cap ex) was quite weak, jobless claims edged higher with continuing claims hitting the highest since 2021 (although both remain low historically), and personal spending slowed both in the April report and in the 1Q GDP revision. But in better hard data news incomes saw another month of very strong growth (could be the most important data point of the week), inflation remained subdued, exports continued to expand to record highs, and home prices moderated but remained healthy. In the soft data, the Conf Bd consumer confidence index saw its largest jump in four years while the U of Michigan report reversed the drop seen in the preliminary read with the inflation expectations components also softening (although confidence remained at one of the lowest readings on record and inflation expectations remained around the highest in decades).
Overall, though, it didn’t put a major dent in my optimism that the economy remains on solid footing:
Hopefully we don’t get much further softening and perhaps we can rebound as we start to (fingers crossed) get past the tariff uncertainty. The good news is the important services sector has so far held up which is keeping overall employment and wages up. That last item is perhaps the most important indicator to watch (real wage growth). We also got a weak productivity report but for now we can look through it given it was based on faulty GDP metrics. Hopefully once they get that all squared away it comes in better, but that’s another thing to keep an eye on. Productivity is incredibly important in allowing the economy to expand with less labor supply and without triggering inflation. Still, for now, I continue to feel that any softening does not appear to be morphing into a recession.”
And as I said at the start of September:
without question, the evidence is building that the days of >3% real GDP growth are behind us, and we should be happy to settle into something more around trend (1-3% real (infl adjusted) growth). That though is far from a disaster. The important thing will be to see the softening level out (L-shape) rather than continue to fall turning the “soft landing” into a recession.
And looking more specifically at the biggest current risk to economic growth, the tariff policies and uncertainty they’re creating until finalized, as I mentioned 7 weeks ago,
I am now a little less concerned than I was the week the reciprocal tariffs were first unveiled given we’ve seen a clear acceptance by the administration that they likely overreached and are now dialing things back (including now China) with continued positive noises coming out of the White House regarding “deals”, etc. As I also noted we saw that there is a definite pain threshold for the administration which means to the extent things start to look shaky, we seem to have a “Trump put”, although there are perhaps longer term ramifications that we’ll only see months/years down the road in terms of the global view of the US as an investment destination which may have impacts on the cost of capital here. That’s beyond the scope of this note, though, and as I said following the unveiling of the reciprocal tariffs when I noted I didn’t want to forecast a recession despite the numerous calls for one because “I am not an economic forecaster, so I will just continue to follow the data…. I think it’s too early to draw any strong conclusions,” that remains the case. For now, I don’t see any strong signs of a recession.
Finally, on the point I raised last week that we should be getting some level of economic activity coming out of the deregulatory push and the tax bill moving through Congress, both appear to remain on track hopefully offsetting the drag we’re getting from the tariffs and restarting of student loan payments.
With the economic data overall coming in better-than-expected last week the Citi Economic Surprise Index moved up another +5.5pts (after jumping +18.6pts the prior week) to +11.5, the best since early Feb.
It is still -11.0 pts from the highs of the year (22.5) in mid-Jan (and -31.8pts from the December highs (43.3)). It is though +33.3pts off the lows of the year Apr 17th (-21.8).
The 2024 high was 47.2 (in Feb) and the low -47.5 (in July).

And GDP estimates are for now consistent with a no recession call (again though remembering GDP going into recessions generally doesn’t look like one is coming (it was up around 2% in Q2 & Q3 2008 well after the recession had started)), and while the Q1 number was weak as I expected, there is broad agreement that it was a function of mismeasurement (even the Fed said that in their May meeting minutes), but it looks like instead of that getting revised higher, it is flowing through to 2Q GDP estimates which are now in the 2-4% range with the Atlanta Fed at +3.8%.
In that regard, 2Q GDP estimate from the Atlanta Fed (whose GDP tracker was right in line in its 3Q & 4Q ‘24 first est’s of GDP (and just a tenth off for 2Q), but who was -1.2% too low for 1Q ‘25) jumps to 3.84% from +2.18% on Tuesday as the larger than expected decline in the goods trade balance outweighed softening in most other areas.

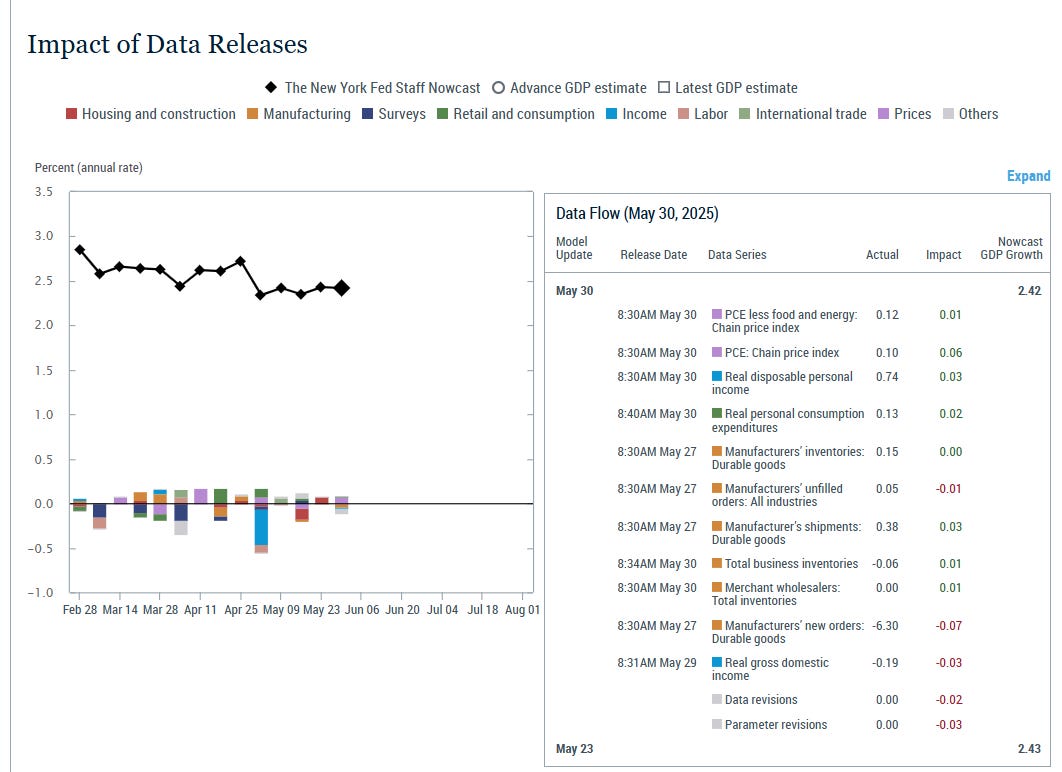
NY Fed’s 2Q GDP Nowcast (as a reminder, they were way off for 1Q seeing +2.6% vs the actual 1st est of -0.3% (although they were closer in most other estimates and that will be closer after revisions)) edged down to 2.42% from 2.43% the prior week but it looks like it did not incorporate the Friday data (in particular the huge drop in imports).
As a reminder the model is “dynamic” and so adjusts in real time as data evolves and “parameter revisions” subtracted -0.03%.
St. Louis Fed Q2 GDP tracker (which has had a mixed track record the past few years, often undershooting actual GDP since Q2 ‘22, but was right on in Q1 & Q4 '24, but then way too high at +3.07%(!) for Q1 ‘25), moved up +27bps w/w to +2.71%.

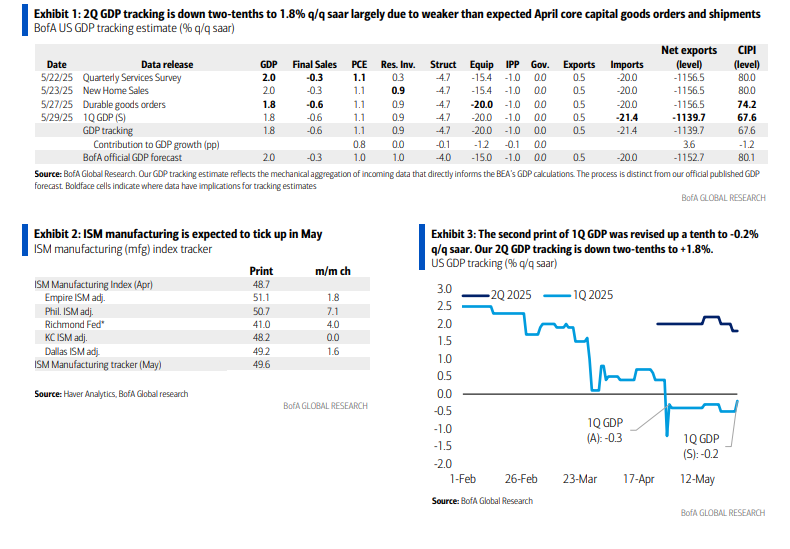
BoA (who as a reminder was just a tenth high for 1Q ‘25 GDP vs the 1st estimate, right on for 4Q ‘24 GDP & two tenths high for 3Q), dropped their 2Q tracking two tenths to +1.8% but note it was only through Thursday so didn’t include the Friday trade data. It should see a big bump next week. This week the drop was on core capital goods numbers from the durable goods report coming in weaker than they expected.
Goldman’s 2Q tracker moved up +1.2pts to 3.3%.

As a reminder they did upgrade their 2025 GDP forecasts after the US-China trade deal:
[We] now forecast 2025 real GDP growth of 1.0% (Q4/Q4, vs 0.5% before), a year-end unemployment rate of 4.5% (vs 4.7% before), and 35% odds of a recession over the next 12 months (vs 45% before); and, in turn, now expect the Fed to begin a series of three rate cuts in December and cut at every other meeting (vs. consecutive cuts starting in July before).
Weekly Econ Index from the Dallas Fed (scaled as y/y rise for GDP), which runs a week behind other GDP trackers, in the week through May 24th fell back to 1.88% from 1.91% the prior week (but 2.66% five weeks ago (Apr 19th)) still around the middle of the 1.49 - 2.66% range it has occupied for almost all of the past 3 yrs, only poking above a couple times earlier this year (most recently Apr 5th).
The 13-wk avg also eased back to 2.35% from 2.39% last week and 2.53% four weeks ago which was the best since 2022, continuing though to evidence overall economic momentum that is a little above trend.
https://www.dallasfed.org/research/wei

Other economy stuff:


Valuations
Like the other sections, I’ll just post current week items regarding the multiple. For the historical stuff, see the Feb 4th blog post.
With equities seeing a modest gain and 2025 earnings expectations falling to new lows, P/E ratios increased to near (but not at) the highest since March hit two weeks ago:
-The SPX forward P/E is 21.2 (+0.3pts w/w, +2.2pts since Apr 20th and just -1.1pts from the post-2021 peak of 22.3 in December (on Yardeni’s model, I’ve seen others much higher but still the same relative story)).
-Mid-caps' (S&P 400) is 15.4 (+0.1pts w/w, +1.7pts since Apr 13th, -1.7pts from the highest since early-’21 (17.1)).
-Small caps' (S&P 600 so higher quality than the Russell 2000) is 14.7 (+0.2pts w/w, +1.7pts since Apr 13th, and -2.4pts from the highest since early-’21 (17.1)).
-Yardeni's “Megacap-8” (adds NFLX) P/E is 27.1, +0.6pts w/w, +3.9pts since Apr 20th, -4.4 pts from the 31.5 it hit in 1H 2024 (which was the highest since Jan ‘22)).
Yardeni: “The forward P/E of the S&P 500 has bungeed from 18.0 on April 8 to 21.5 (which oddly doesn’t conform to the chart) at the end of last week. In other words, stocks aren't cheap again, though much of the rebound is attributable to the Magnificent-7's forward P/E rebounding from 21.9 to 27.4. The forward P/E of the S&P 493 is back to 19.2.”
https://yardeni.com/charts/stock-market-p-e-ratios/

Other valuation stuff:
Breadth
Breadth, which had seen softening in growth/value, market cap/equal weight, and large cap/small cap, continued to see those deteriorate while other metrics stabilized.
Evidencing the slowing momentum of the rally, the McClellan Summation Index ("what the avg stock is doing") hasn't turned back up after turning down last week from the highest since October.

The Nasdaq Volume-based version though still hasn’t rolled over yet.

SPX new 52-wk highs remain subdued with the 10-DMA little changed at 17. It at least remains off the lows in April.

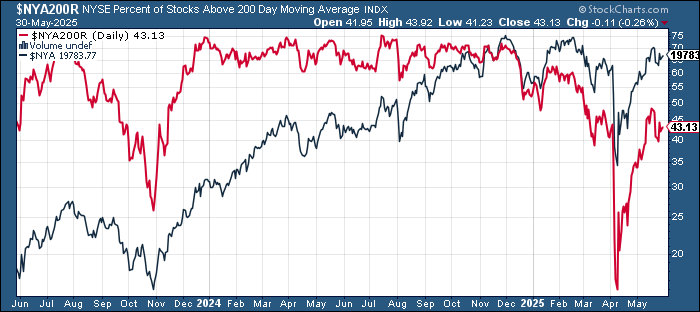
% of stocks over 200-DMAs (red line) was little changed this week right a little below “Liberation Day” levels.

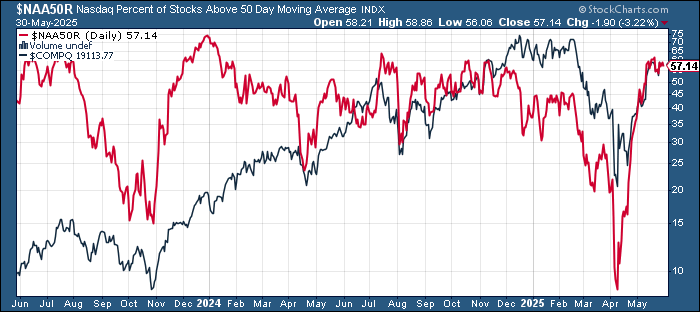
% of stocks above 50-DMAs are stronger remaining near the highest since last July.

And % of stocks above 20-DMAs were able to stabilize after falling back from the best since last July three weeks ago.


Value/Growth back to the least since Jan ‘22.

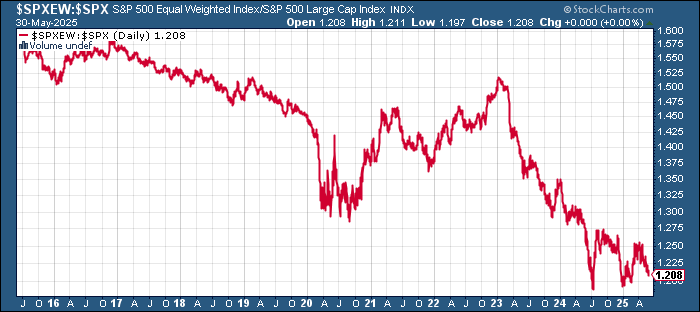
The equal-weighted SPX vs cap weighted ratio remains around the least since Feb near the least since 2009.
IWM:SPY (small caps to large caps) now just above the 24 year lows hit in April

SPX sector breadth continued its “all or nothing” weekly performance with 10 of 11 sectors up (just Energy lower at -0.6%) after every sector was down the previous week but every sector up the week previous to that. 9 of 11 sectors up >1% led by RE, the only sector up over 2%.
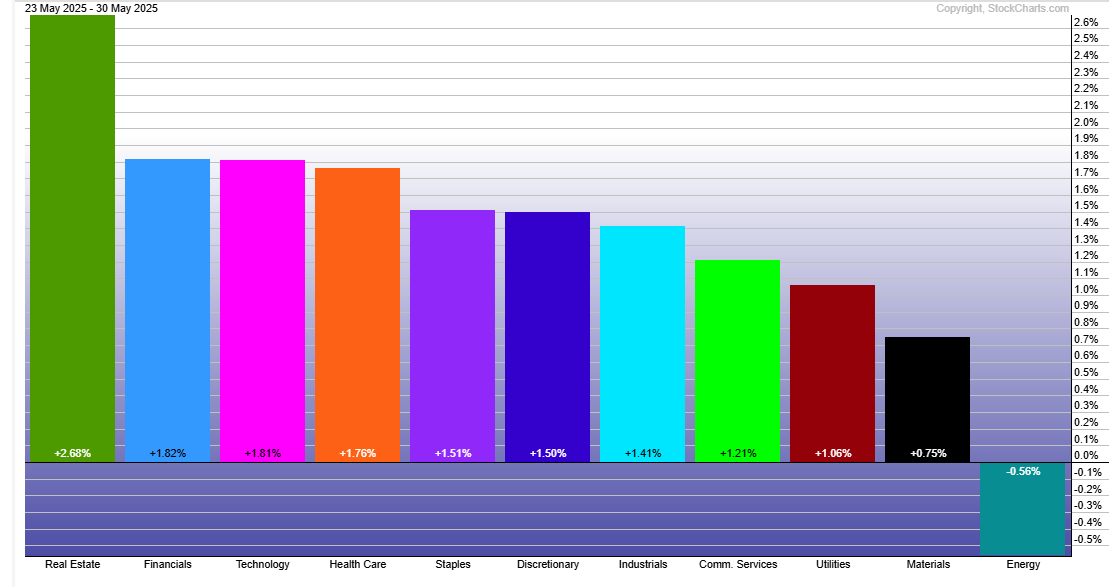
In that regard, after a bright red SPX stock-by-stock chart last week (meaning < -3%) and a bright green one (meaning >3%) the week before that a more moderate chart this week but dominated by green.
Some leaders were PLTR GE, NEE, AMGN, INTU, AVGO, ORCL all up over 5% while just a few stocks (such as CRM, WDAY, ANET, ROST, REGN, COIN) were down that much.

Other breadth stuff:
Flows/Positioning
Flows from BoA’s Flow Show report:


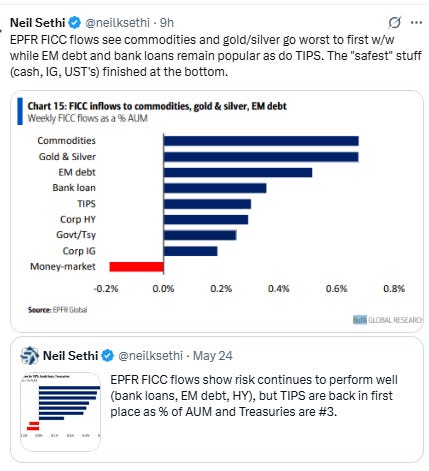


ICI data on money market flows saw a -$19.8bn outflow in the week through May 28th in line with the -$18.9bn EPFR saw. Most of it (-$18.3bn) was institutions reversing last week’s increase (who are a little less than 60% of MMF assets) while -$1.5bn was retail.
Total MMF assets now at $6.95tn, remaining below the record $7.03tn.
https://www.ici.org/research/stats/mmf

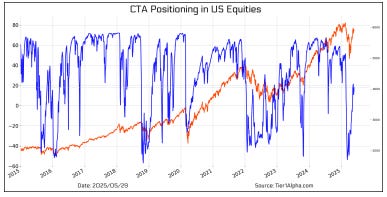
Looking at CTA (trend follower) positioning in the US indices, BoA like others sees buying in the upcoming week, although they seem more constructive than Goldman, UBS, etc., who think CTAs will be tepid buyers at this point, saying “US equities, specifically the S&P 500 and NASDAQ-100, have notched meaningful gains in price trend which may have led some short to medium-term trend followers to get long. We expect CTAs that are already long in these indices to build the positions outside of a bearish path next week. Meanwhile, shorts that may remain from longer term trend followers could continue to fall off next week. Russell 2000 trends are more likely to still be negative.”
Price trends continue to recover but as they note remain negative on the Russell 2000 with the $SPX at +23% (from +6% the prior week (and -50% three weeks ago)) the $NDX at +41% (from +27/-14%), while the $RUT is -22% (from -32/-49%).
#Japan’s #Nikkei225 is +22% (from -7/-32%) where they see buying while the Euro #Stoxx50 leads at +85% (from +65%) where they see selling.


Tier1Alpha’s model also shows CTA positioning in US equities now back to more neutral levels requiring further price gains to see them add.
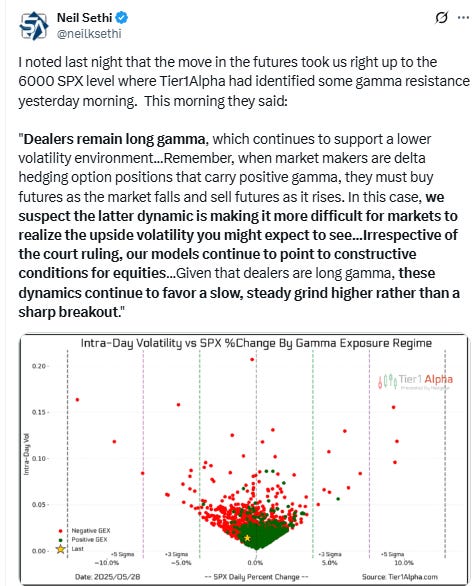
BoA notes on gamma positioning "SPX dealer gamma continues to be minimal in size: +$0.4bn (22nd 1y %ile) as of Thursday’s close. However, gamma is not uniformly muted across tenors. The contribution from <1wk options is indeed near-zero, while the 1wk-1m (+$2.6bn) and >1m (-$2.1bn) tenor buckets have more meaningful but roughly offsetting gamma footprints. The 1wk-1m gamma appears overwhelmingly due to long calls for dealers, while the >1m gamma is largely from dealer short puts. All told, option flows are more active than the residual SPX gamma footprint might suggest.”
So like others BoA sees gamma remaining very low for now which should keep it an accelerant to volatility in both directions at current levels, although as they model it, again this week declining on a rally and increasing on a decline which makes it an increasing accelerant to rallies until the 6200 area but a decreasing accelerant to declines until the 5750 area.
The color on the different time gamma time horizons is interesting but fits with the discrepancy between retail (more <1mth calls) being more bullish than institutional (>1mth puts).

BoA models risk parity funds as having seen their (leveraged) overweight to bonds start to flatten out at 3-yr highs, while their commodity and equity exposure look to be curling up from near the least in a year and the least in two years respectively.
#oott

With realized volatility falling sharply at the 1-mth horizon and starting to fall at the 3-mth horizon (we have a ways to go), BOA sees vol control (volatility targeting funds) exposure continuing to slowly rebound but remain well off even their lowest positioning of 2024.

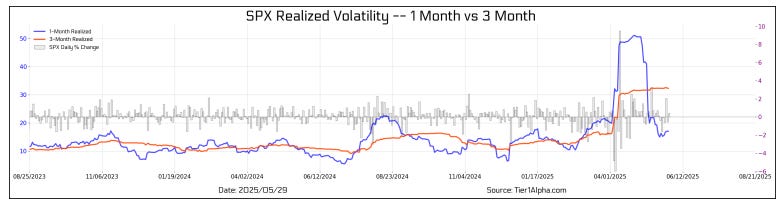
Tier 1 Alpha similar to BoA sees vol control exposure just marginally off the least since 2020 with plenty of room to move higher.


And while we will be dropping just one >1% day from the 1-mth realized volatility lookback this week, we’ll drop four on the 3-mth lookback although nothing larger than 1.8%.

And overall systematic positioning is similarly not far from the least since March 2020 according to Tier1Alpha, just edging back over the -1 z-score (-1 standard deviations from the mean).


Goldman though sees a it a bit higher.
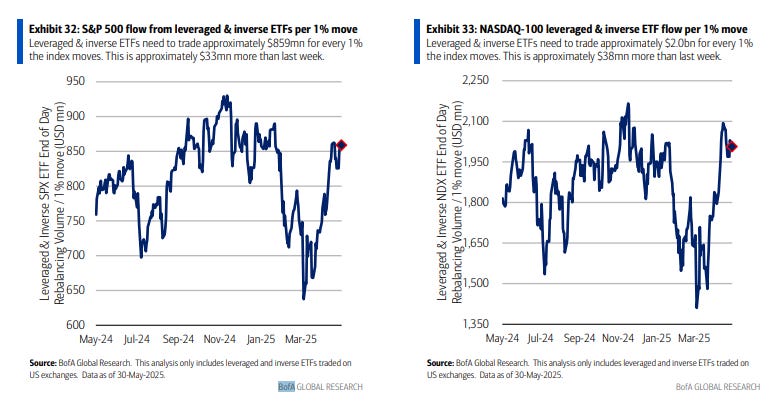
And as you know, I like to look at the notional value in leveraged ETFs as a barometer of risk appetite, and they recovered last week’s drop on the SPX putting them back at the highest since early Feb while the NDX remains below that week’s highs (which were the highest since Nov).
Remember, this is a “constant negative gamma” source as Charlie McElligott put it in a recent Oddlots appearance (meaning that there is double/triple buying pressure from them as they rebalance each day). BoA estimates while they’re just 4% of end of day flows for the SPX, they’re 31% for the NDX in the last 5 minutes.
Leveraged ETF AUM in the two largest single stock ETF’s $TSLA and $NVDA like the NDX saw a tepid rebound last week but TSLA remains near the highest since Nov’s record after increasing +$0.3bn to $8.2bn, while NVDA leveraged ETFs added +$0.1bn to $5.5bn.
3rd place $MSTR though lost -$101mn to $3.2bn. Next is $PLTR at $1.1bn (+$129mn w/w).

And after buybacks ended 2024 at a record, and started 2025 even better, they have slowed but BoA, Goldman, JPM, DB all see them as remaining very healthy. Note the next blackout window is estimated to start June 16th (Goldman).


And some other notes on positioning:


Sentiment
Sentiment (which I treat separately from positioning) is one of those things that is generally positive for equities when its above average but not extreme (“it takes bulls to have a bull market”, etc.) and when it’s at extreme lows (“washed out”). I had said eight weeks ago “I can’t say we’re completely ‘washed out,’ but we’re a lot closer than we were a week ago.” But since then we’ve moved went pretty far in the other direction, but not yet to euphoric conditions, which keeps it a tailwind.


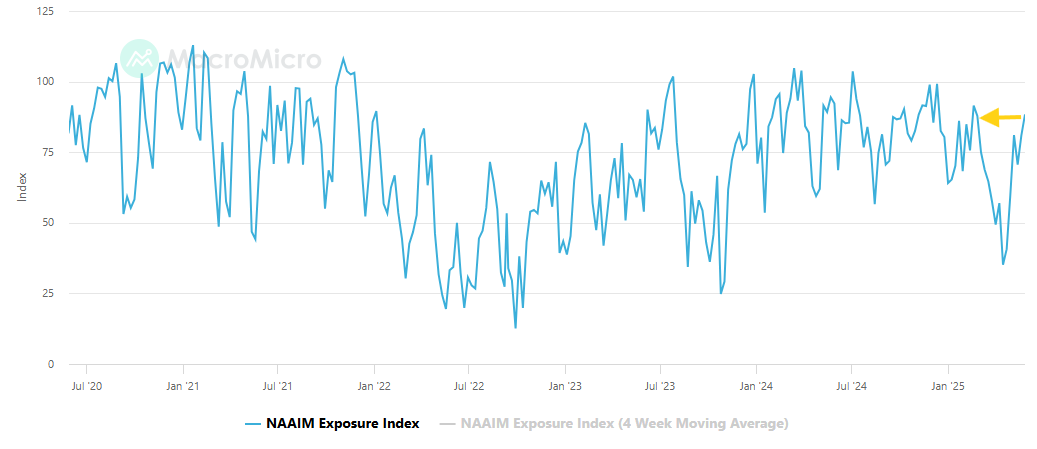
NAAIM's (investment managers) exposure index which "represents the average exposure to US Equity markets reported by our members" and which ranges from -200 (2x short) to +200% (2x long) rose for the 5th week in 6, to 88.41 from 80.87 the prior week, now the highest since Feb 19th, as it continues its rebound from 35.16 seven weeks ago which was the least since Nov ‘23.
https://naaim.org/programs/naaim-exposure-index/
The 10-DMA of the equity put/call ratio (black/red line), rose for a 2nd week after hitting the least since July 2023, consistent with investors becoming slightly more demanding of downside protection after having steadily shed it since peaking in mid-April.
When it’s increasing it normally equates to a consolidation in equities and increase in volatility and vice versa.

CNN Fear & Greed Index edged back -2pts w/w to 62 (“Greed”), -9pts the last 2 weeks from the highest since October, although it continues to have Market Momentum in Extreme Fear despite the fact it’s trading above it.
Just save haven demand moved (to Greed from Extreme Greed):
Extreme Greed = stock price breadth (McClellan Volume Summation Index); junk bond demand
Greed = stock price strength (net new 52-week highs); safe haven demand (20-day difference in stock/bond returns)
Neutral = market volatility (VIX & its 50-DMA)
Fear = put/call options (5-day put/call options) (from Greed)
Extreme Fear = market momentum (SPX vs 125-DMA)
https://www.cnn.com/markets/fear-and-greed


BofA’s Bull & Bear Indicator (a global metric), jumped a half point to 4.2 ("Neutral"), now +0.6pts off the joint lowest in four months and moving further above the 3.2 it hit at the start of the year which was what would now be a 1-yr low.
The increase was due to “HY/EM bond inflows and strong global equity index breadth (for 3rd consecutive week more than 80% of all country indices trading above both their 50-day & 200-day moving averages).”

Helene Meisler's followers remained bearish for a fifth week at 53.7% voting next 100pts lower on the SPX (down though from 55.1% the prior week and 66.8% the week before that which was the most bearish on record (back to late May 2020)).
She says: “Only two other times in the 5+ yrs I've been doing this poll have we been at 5 weeks or more. Once SPX fell 5%+. Once 10%+ although not asap either time.”

Helene Meisler
’s always insightful Saturday Chart Fest. Her message:
“I am not sure much has changed in the last week. Here’s a summary of the month: we had a good first half and since May 12th we have been flopping around. I’ll bet all those seasonality folks like that! So we remain between support and resistance.”
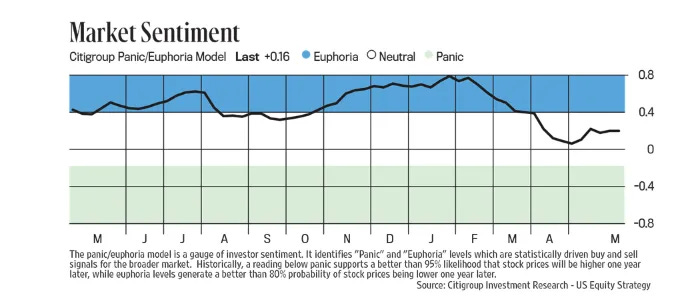
Note it normally includes Citi’s Panic/Euphoria Index which fell almost to the zero line at the end of April but in May has moved higher (still in Neutral) after never getting to Panic.
As a reminder, “[h]istorically...euphoria levels generate a better than 80% of stock probabilities being lower one year later.” In that regard, it first entered euphoria in late March 2024 (when the SPX was around 5200) and then reentered in late October (around 5800).
We didn’t get to 5200 by late March of this year, but we got closer than I would have thought at 5500. We’re remain below 5800. So we’ll see where we are in October.
Seasonality
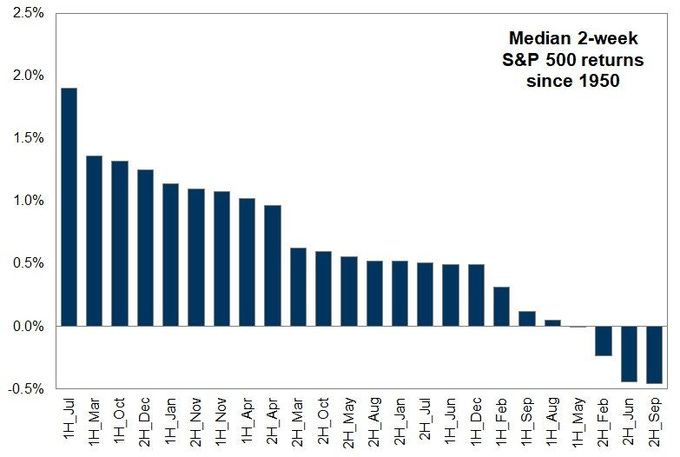
As we move into June it is generally about an average month. Since 1950 goldman says the first two weeks are right about average (which is not bad at a gain of +0.5%). Since 1928 BoA finds the average weak (5th weakest) but the median about the middle but with higher than normal volatility.
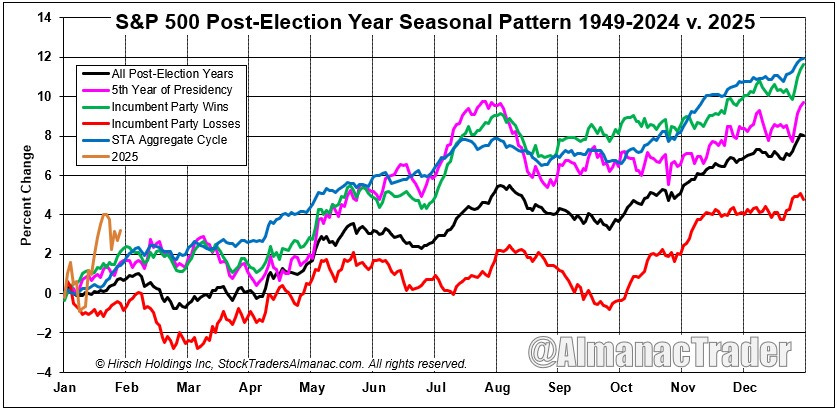
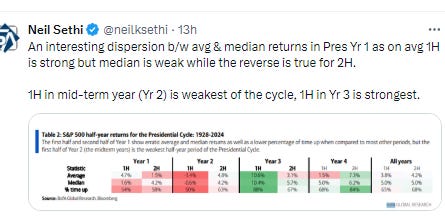
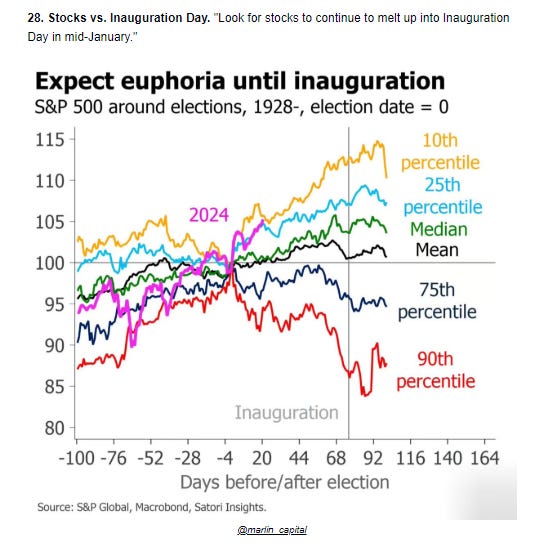
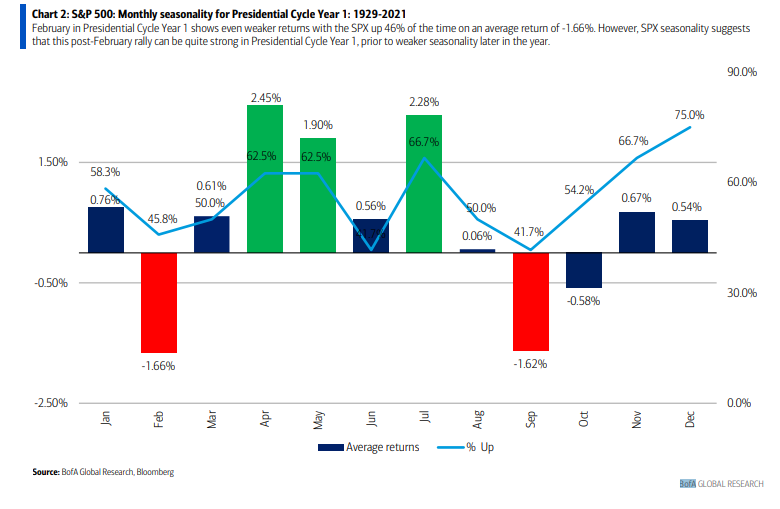
Looking at June as a whole, in Pres Yr 1 it is one of the weakest months up just 42% of the time with an average return of around +0.2%.
As always remember that seasonality is like climate. It gives you an idea of what generally happens, but it is not something to base your decision on whether to bring an umbrella (as the Santa Rally showed us).”


Final Thoughts
I noted at the start of the year,
As we turn the page into the new year, we’re presented with a very different backdrop than what we saw for much of 2024 when the Fed was moving from hiking to cutting, bond yields were falling, seasonality was mostly favorable, systematic positioning was mostly a tailwind, political risk was low, valuations had room to grow, liquidity was very robust, the economy was firing on all cylinders, volatility (until early August) was more subdued, earnings were rebounding, etc.
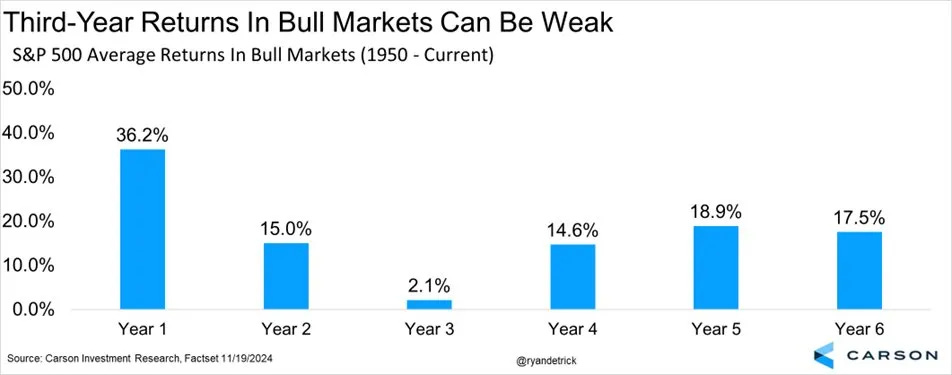
Now we’re in what is historically a more challenging year (1st year of a Presidential term and 3rd year of a bull market following two 20% years) with valuations well above where we started 2024, high expectations (judging from analyst SPX forecasts), higher volatility and political risk…higher bond yields (particularly real yields), a Fed talking more about fewer than more cuts and continuing to drain liquidity that is now hitting levels we’ve run into issues in the past, high earnings expectations, etc.
It doesn’t mean that we can’t have a good or even a great year. Balance sheets remain very solid as does the economy and labor markets (even if slowing), earnings are expected to be very good, buybacks are expected to be a continued tailwind, there’s a lot of scope for the Fed to become less hawkish, the upcoming administration may provide big tailwinds in tax cuts, deregulation, etc., etc. But we need to see at least some of those come through, and disappointments are not going to be welcomed given the set-up, so my expectation is for choppier markets more like we’ve seen since October than what we saw before.
But seven weeks ago I noted that I thought
the upside is much more favorable than the downside…. The tariff issue remains the overhang over things and until things are finalized it will weigh on market, consumer, and business sentiment, and prevent any sort of truly sustainable rebound. At some point we’ll get to a resolution that will “free” the markets to react more typically to the other fundamental inputs….. Positively, we did see that Trump will, as expected, not push things too far in terms of stress on financial markets as evidenced by his pivot following stresses in the bond market (which weren’t actually all that bad outside of the move in yields (things barely registered on the Fed’s radar))…the good news is we have taken all of the “froth” out of the equity markets, which means we’ll be working from a much less extended base with plenty of “dry powder” from hedge funds, institutions, etc. And while the Fed is on hold for now, they still have a bias to cut, and the economy (and most importantly labor markets) remain for now healthy.
And as noted three weeks ago, “given that setup, things have actually worked out pretty well. President Trump has continued to dial down the rhetoric which has allowed volatility to calm down, which has allowed systematic traders to start to reengage to join retail (who never stopped buying) and corporates (who are emerging from their blackout period).”
And then two weeks ago,
and things continue to progress better than I think most anyone thought they would, even with institutions still remaining relatively low in positioning as noted in the Flows/Positioning section. As they continue to catch up to the market, it will be an additional boost. Sentiment has turned markedly more bullish but isn’t quite yet what I’d consider a headwind. Earnings expectations have continued to deteriorate, but so far markets haven’t paid much attention. That said, valuations are getting back up towards frothier levels which may present a headwind before too long. Markets can only outrun earnings for so long. The Fed also doesn’t remain particularly friendly to the markets, but again for now stocks have seemed ok with that. We’ve also run a long way in a short period of time, so some consolidation at some point would be expected.
But as I said three weeks ago, “things look far from dire, meaning just as we can’t take for granted this is not a bear market rally, we shouldn’t take for granted this is not going to end up leading to new highs.” … a lot of course also depends on President Trump. The markets have rode a wave of more positive policy (trade deals, progress on tax legislation, etc.), and with Trump saying twice recently it was a good idea to buy stocks, I think we’ve established a “Trump put” at those levels. That said, as I noted last week, “it is just this sort of calm that Pres Trump has in the past sought to use to inject changes in policy, so that’s something to watch out for.” That continues to be the case.
And while as noted last week President Trump did take advantage of the equity recovery to inject a broadside against both Apple and the EU, he dialed it back almost immediately, as it appears he’s losing his taste for the tariff wars and is wanting to move along to more market (and politically given the upcoming midterms) friendly items such as tax cuts and deregulation. It seems that escalatory statements now are more to move towards resolution than intended to provide policy guidance. If so, this is a definite market positive.
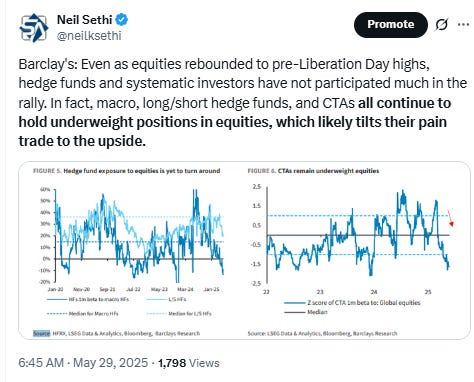
And while as noted last week systematic traders have now started to bring their positioning back to more neutral levels, so there is less firepower there (with CTA’s in particularly appearing to be at neutral levels), we still have the large group of volatility targeters as well as hedge funds broadly underexposed who will need to “catch up” if the rally continues and/or volatility continues to die down, and while retail buying has cooled, it remains positive to join corporates who will remain good support until the next buyback blackout starts towards the end of the month. Valuations though have made the market if not expensive certainly not cheap which doesn’t help as earnings expectations continue to fall, so that is a definite headwind. Technicals, sentiment, and seasonality are also not as favorable as they were back in April, so as I said last week,
Putting it all together, [the recent] consolidative behavior is certainly not unexpected (I’ve been noting it was likely at some point for the past two weeks), and it could continue, particularly if the SPX breaches the 200-DMA (although there are a lot of eyes on the 5700 level as a “buy zone”; if that falls, then this could extend to a longer consolidation than a couple of weeks).
On the upside, 6000 has been targeted as a key level. If we get through that, we could be at the February highs quicker than most think. So, overall, it remains the “tricky market” that I called it several weeks ago, but perhaps (fingers crossed) at least a less volatile one than we saw the last few months.
And in the long term, as always just remember pullbacks/corrections/bear markets are just part of the plan.


Portfolio Notes
Didn’t do much again this week.
Cash = 30% (held mostly in SGOV & BOXX (BOXX mimics SGOV but no dividend, all capital appreciation so get long term capital gains if you hold for a year)
Bonds/Fixed Income (mostly short duration like MINT, SHY, ICSH, etc.) = 20%
Core equity positions (each 5% or more of portfolio (first 2 around 10% each, total around 25%) Note the core of my portfolio is energy infrastructure, specifically petroleum focused pipelines (weighted towards MLP’s due to the tax advantages). If you want to know more about reasons to own pipeline companies here are a couple of starter articles, but I’m happy to answer questions or steer you in the right direction. https://finance.yahoo.com/news/pipeline-stocks-101-investor-guide-000940473.html; https://www.globalxetfs.com/energy-mlp-insights-u-s-midstream-pipelines-are-still-attractive-and-can-benefit-from-global-catalysts/)
EPD, ET, PAA
Secondary core positions (each at least 1% of portfolio, less than 5%)
ENB
And the rest of the top 20 (all >0.5%, less than 1%):
XOM, GILD, SCHW, AM, ARCC, VNOM, MPLX, T, OXY, AGNC, IBIT, NTR, NEM, TLH, RRC, AMZN, GSK, BOND, CTRA, ING, PFE, BTI, CMCSA, VOD, CHWY, BIP, AR, VZ, RHHBY, OWL, MSFT, DVN, VICI, GOOGL, BAYRY
High quality, less conviction due to valuation
Note: EPD, ET, MPLX, PAA all issue K-1s (PAGP is the same as PAA but with a 1099).
Reminder: I am generally a long term investor (12+ month horizon) but about 20% of my portfolio is more short term oriented (just looking for a retracement of a big move for example). This is probably a little more given the current environment. I do like to get paid while I wait though so I am a sucker for a good well supported dividend. I also supplement that with selling calls and puts. When I sell a stock, I almost always use a 1-2% trailstop. If you don’t know what that is, you can look it up on investopedia. But that allows me to continue to participate in a move if it just keeps going. Sometimes those don’t sell for days. When I sell calls or puts I go out 30-60 days and look to buy back at half price. Rather than monitor them I just put in a GTC order at the half price mark.
To subscribe to these summaries, click below (it’s free).
To invite others to check it out,