The Week Ahead - 8/18/24
A comprehensive look at the upcoming week for US economics, equities and fixed income
If you're a new reader or maybe one who doesn’t make it to the end feel free to take a second to subscribe now. It’s free!
Or please take a moment to invite others who might be interested to check it out.
Also please note that I do often add to or tweak items after first publishing, so it’s always safest to read it from the website where it will have any updates.
As a reminder, some things I leave in from prior weeks. Anything not updated is in italics. As always apologize for typos, as there’s a lot here, and I don’t really have time to do a real double-check. This week was (again) particularly hectic.
The Week Ahead
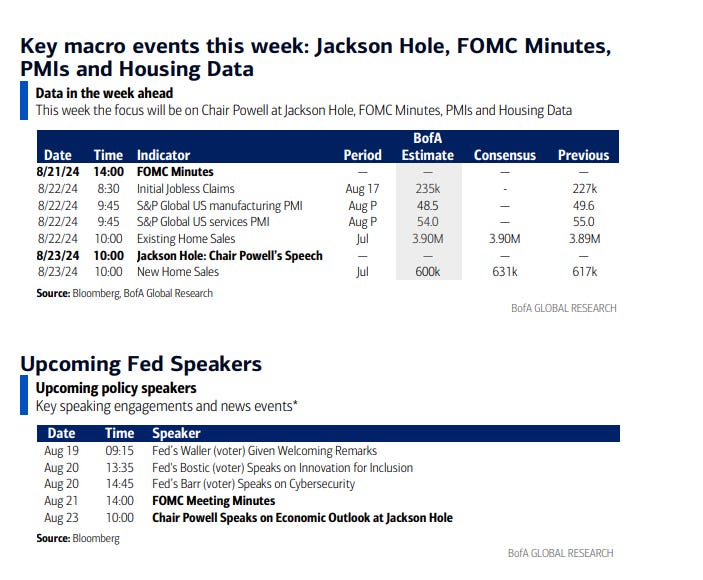
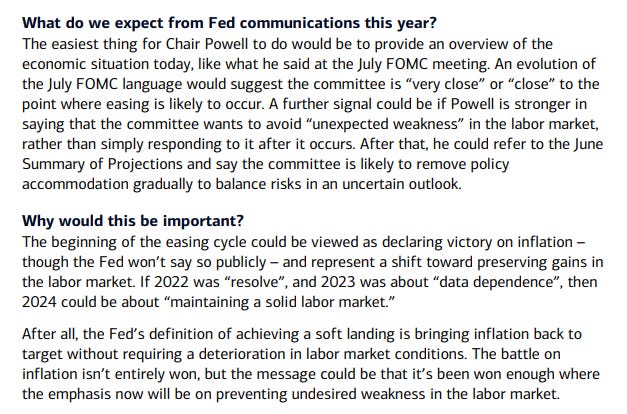
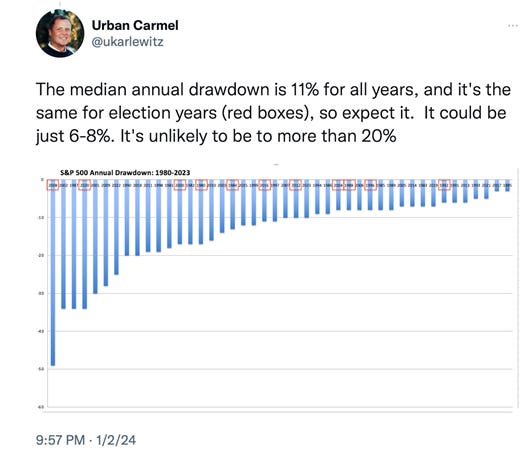
After three weeks packed with central bank meetings, a blow up of the carry trade and huge deleveraging by systematic traders of risky assets, a succession of key economic data points, and earnings from 75% of the SPX, next week will be all about the Federal Reserve's Jackson Hole symposium August 22nd to 24th, one of the longest-standing central banking conferences in the world, the event brings together economists, financial market participants, and U.S. government representatives from around the world to discuss longer-term policy issues. The theme for this festivities is “Reassessing the Effectiveness and Transmission of Monetary Policy,” something that I think is most definitely on the minds of many if not most economists and market participants. But what you really want to know is when Jerome Powell speaks, right? Well, that’s 10 am ET on the 23rd (Fri) so be sure to put that into your calendar. There’s more on expectations around his appearance below, but suffice to say a Fed Chair’s Jackson Hole appearance can be market moving (think Bernanke’s announcement of QE or Powell’s terse 8 minute speech in ‘22 designed to quell what he felt was markets not understanding the seriousness of the Fed’s commitment to fighting inflation which promptly led to a -19% drawdown in the SPX), although definitely not always. This appearance will likely be less dramatic than most will Powell “teeing up” a September rate cut and hopefully giving some clarity around what we should expect for the path of easing.
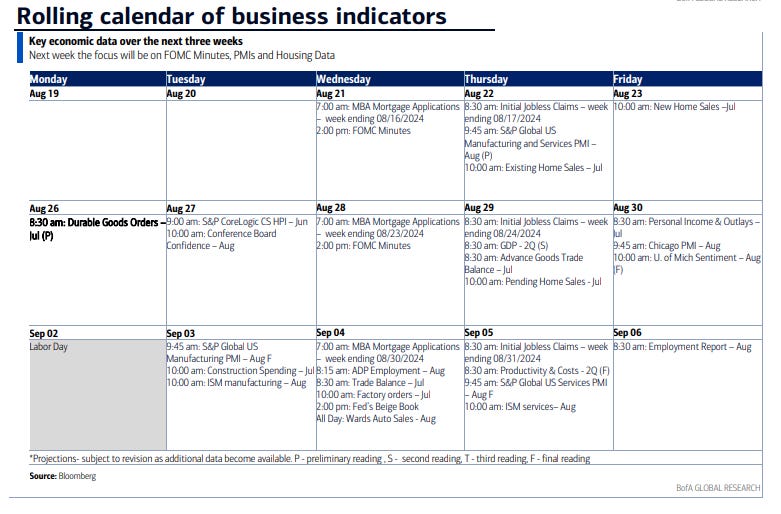
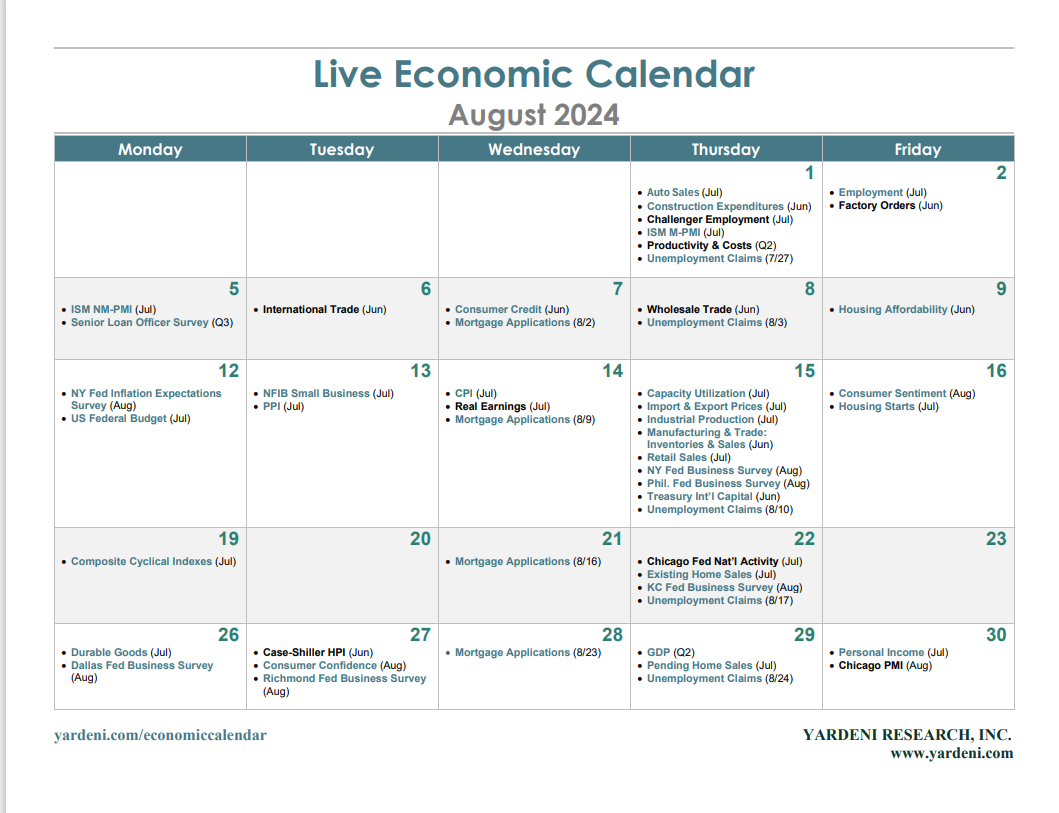
Otherwise as noted it’s a lighter week (or at least it’s supposed to be a lighter week, but that was also true two weeks ago when the Japan carry trade blew up in the midst of a spike in recession concerns). No major US econ data scheduled until Thursday when we’ll get jobless claims, flash PMI’s (which matter until they don’t (when ISM is released)) and existing and new home sales. Perhaps most importantly (not listed) is we'll get the first stab at annual benchmark revisions for NFP payrolls (the full revisions are in February '25, the preliminary just revises up to March '24).
There's a few #FOMC speakers listed on the "official" calendar, but you're going to likely hear from most, if not all, of them in media interviews. That said, normally they try not to be newsworthy so as avoid outshining the Chair’s appearance. Treasury auctions this week outside of Bills (<1yr) will also be light with just $16bn in 20yr bonds and $8bn in 30yr TIPS (reopening).
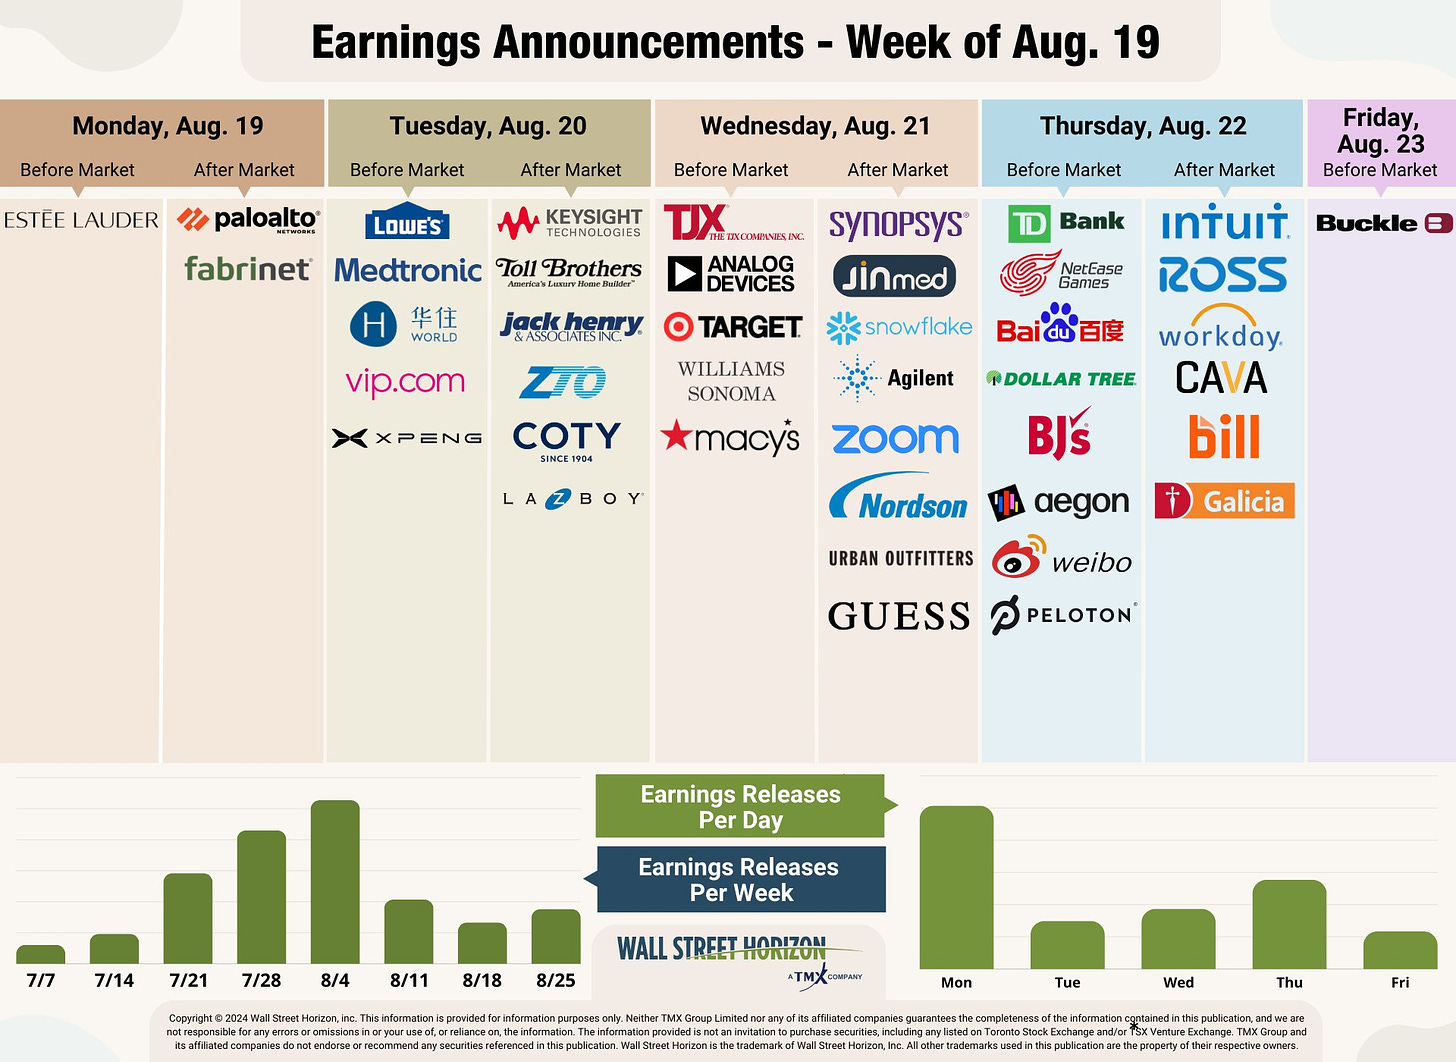
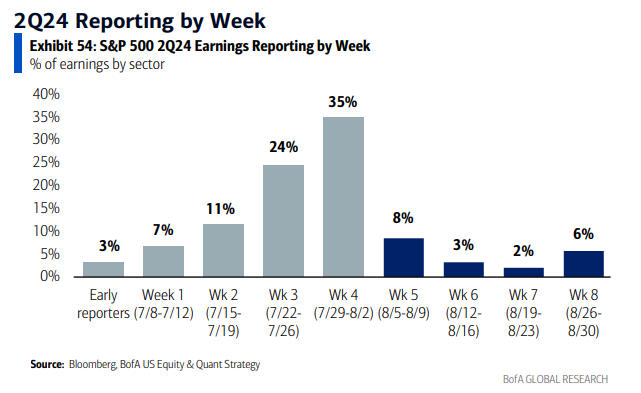
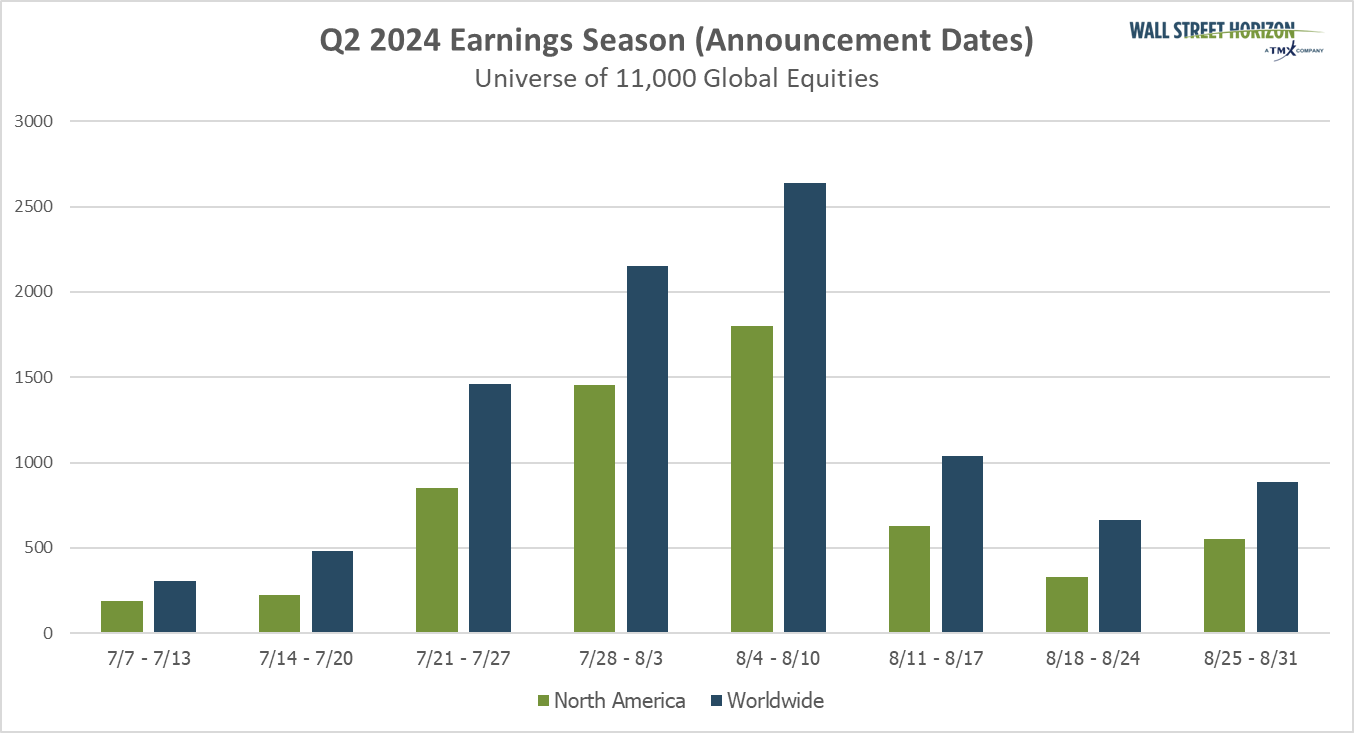
And earnings season will continue to wind down. There’s 14 SPX reporters which include eight $100bn+ companies but just 2% of SPX earnings power: cybersecurity firm Palo Alto Networks (PANW), retailers Lowe’s (LOW), Target (TGT) and TJX (TJX), medical device maker Medtronic (MDT), semiconductor manufacturer Analog Devices (ADI), financial software maker Intuit (INTU), and Canadian bank Toronto Dominion (TD).
We’ll also get the Democratic convention this week.
From Seeking Alpha (links are to their website):
Earnings spotlight: Monday, August 19 - Palo Alto Networks (PANW), Estee Lauder (EL), and Fabrinet (FN). See the full earnings calendar.
Earnings spotlight: Tuesday, August 20 - Lowe's Companies (LOW), Medtronic (MDT), Toll Brothers (TOL), Amer Sports (AS), XPeng (XPEV), and Coty (COTY). See the full earnings calendar.
Earnings spotlight: Wednesday, August 21 - TJX Companies (TJX), Analog Devices (ADI), Target (TGT), Snowflake (SNOW), Agilent (A), and Macy's (M). See the full earnings calendar.
Earnings spotlight: Thursday, August 22 - Intuit (NASDAQ:INTU), Toronto-Dominion Bank (TD), Workday (WDAY), Ross Stores (ROST), Peloton Interactive (PTON), Baidu (BIDU), CAVA Group (CAVA), and Viking Holdings (VIK).See the full earnings calendar.
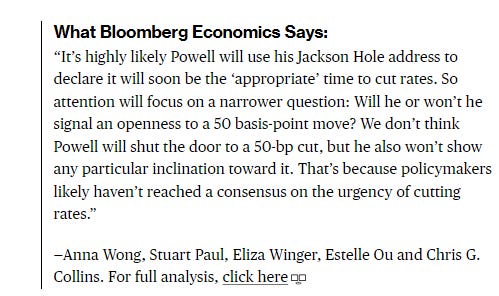
Here’s some thoughts on what we might hear from Powell:
“We look for Powell to signal that given recent progress, the Fed is likely to ease policy next month — without fully committing to the size of the rate cut,” according to TD Securities’ strategists. “We expect a 25 basis-point reduction.”
“Investors will also be looking for any guidance as to whether Powell is leaning toward a 25 or 50 basis-point rate cut,” said Ian Lyngen at BMO Capital Markets. “We’re in the 25 basis-point cut camp to be sure, and we anticipate the Chair will err on the side of flexibility by utilizing the time-tested ‘data dependent’ framing.”
“The main message in Powell’s speech will likely be that monetary policy overall has worked as intended, and the current level of rates is restrictive,” said Anna Wong at Bloomberg Economics. “He may say the balance of risk between the Fed’s mandates - employment and inflation - is about even. We expect him to signal a rate cut is coming, but not to indicate whether it will be 25 basis points or 50 bps. That will depend on the August jobs report.”
The more I think about and discuss the likely outcomes for next week’s Jackson Hole meeting, the more I return to this concern: that Chair Powell will tell us to “curb your enthusiasm,” said Steve Sosnick at Interactive Brokers. “It hardly seems appropriate for Chair Powell to re-affirm (the market’s) likelihood (of more than three cuts this year) at his Jackson Hole address next week given that it would put him well ahead of the last Summary of Economic Projections just weeks before the next one is due,” he noted.
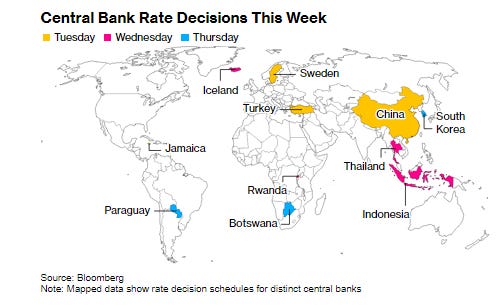
Ex-US it’s similar with a relatively light week. Highlights are Canada and Japan CPI, global flash PMI’s, and central bank decisions from Sweden, Turkey, Thailand, Indonesia and South Korea (all but the first are expected to hold rates). We’ll also hear from Bank of England Governor Andrew Bailey and Philip Lane, chief economist at the European Central Bank at Jackson Hole while Bank of Japan Governor Kazuo Ueda appears before parliament.
Looking north, Canadian inflation data for July will be important to keeping the central bank on track to deliver a third straight rate cut in September. The Bank of Canada expects uneven progress toward the 2% target and is increasingly focused on downside risks, so it’s primarily looking to see sustained evidence of easing. Retail sales data for June and a flash estimate for July will also shed light on the health of the country’s consumer.
Bank of Japan Governor Kazuo Ueda grabs the spotlight on Friday when he appears in parliament to explain the thinking behind the July 31 rate hike after some traders cited the move as a catalyst for market ructions earlier this month. Ueda is also likely to discuss the policy outlook. The People’s Bank of China is expected to keep the 1-year an 5-year loan prime rates steady after last month’s surprise cuts. Bloomberg Economics forecasts the PBOC will cut the rates by 10 basis points in the fourth quarter. The region gets PMI statistics for Australia, Japan and India on Thursday, and Thailand’s second-quarter economic growth is seen accelerating year on year and slowing versus the prior period. Japan’s consumer inflation probably picked up for a third straight month in July, and trade figures are due during the week from Japan, Malaysia and New Zealand. Malaysia also publishes inflation data.
With the European Central Bank widely expected to resume rate cuts in September, all eyes will be on data for negotiated wages and on the account of policymakers’ July decision — both of which are due on Thursday. Flash PMIs for Germany, France and the euro area are also scheduled for that day, with economists predicting similarly poor readings as last month. In situation in the UK — which just saw bumper numbers for second-quarter GDP — is much rosier, and PMI numbers there are likely to be upbeat. On Wednesday data from South Africa is set to show inflation slowed to an 11-month low of 4.8% in July from 5.1% a month earlier. That could open room for the central bank to cut rates at its September meeting if this disinflation process continues. Five central bank rate decisions are scheduled in the region:
On Tuesday, the Riksbank is expected to announce another cut, with Swedish officials likely to resist domestic calls for taking the benchmark rate half a percentage point lower, and go with a more conventional 25 basis-point reduction.
On the same day, the Turkish central bank is likely to leave its policy rate at 50% for a fifth straight month amid visible signs of a cooling economy though annual inflation still hovers above 60%.
On Wednesday, the Iceland is set to keep borrowing costs on hold at 9.25%, the highest rate in western Europe. Market participants expect monetary easing to start in the final quarter of the year, according to a survey by the central bank published Friday.
Also that day, Rwanda is poised to cut its key interest for a second straight meeting as inflation remains subdued.
On Thursday, Botswana will likely leave its key rate unchanged to support the economy that shrank for the first time since the peak of the pandemic in the three months through March and as inflation remains within target.
In Latin America, Chile’s economy likely shrank in the three months through June on weaker investment and exports, but the consensus call is for a rebound in the second half. Argentina last month posted unexpectedly strong GDP-proxy data for May, due largely to a bumper harvest that won’t buoy the the June results reported this week. In Mexico, almost two years of double-digit interest rates are cooling domestic demand, and can be expected to weigh on the June retail sales, GDP-proxy and full second-quarter output results posted this week. Economists in Citi’s biweekly survey see full-2024 GDP growth slowing for a third year to 1.7%. Mid-month inflation data will give Mexico watchers a first chance to evaluate Banxico’s Aug. 8 quarter-point rate cut to 10.75%. The meeting minutes may shed more light on Banxico’s view that a run-up in food prices will prove temporary and that slowing growth should help rein in consumer price increases.
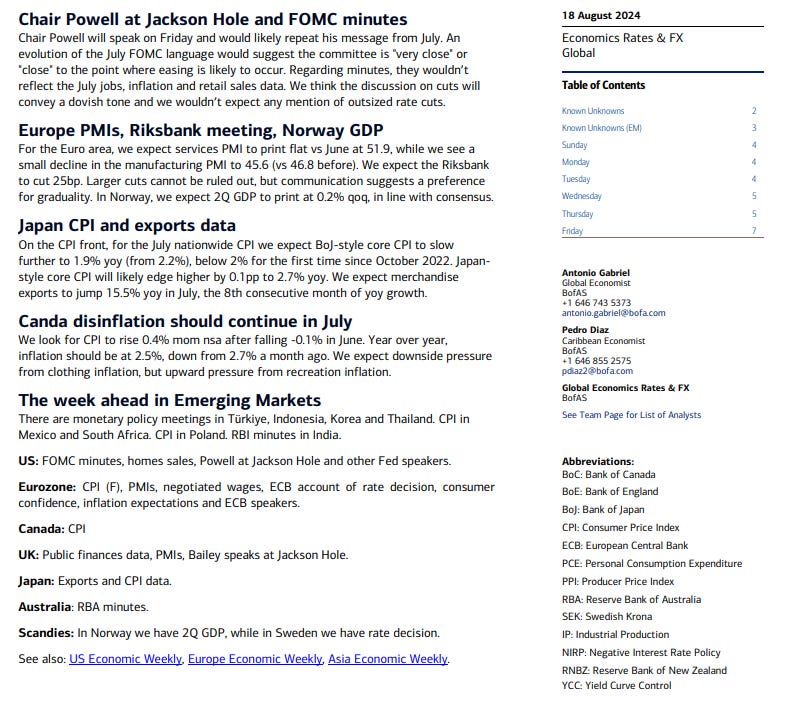
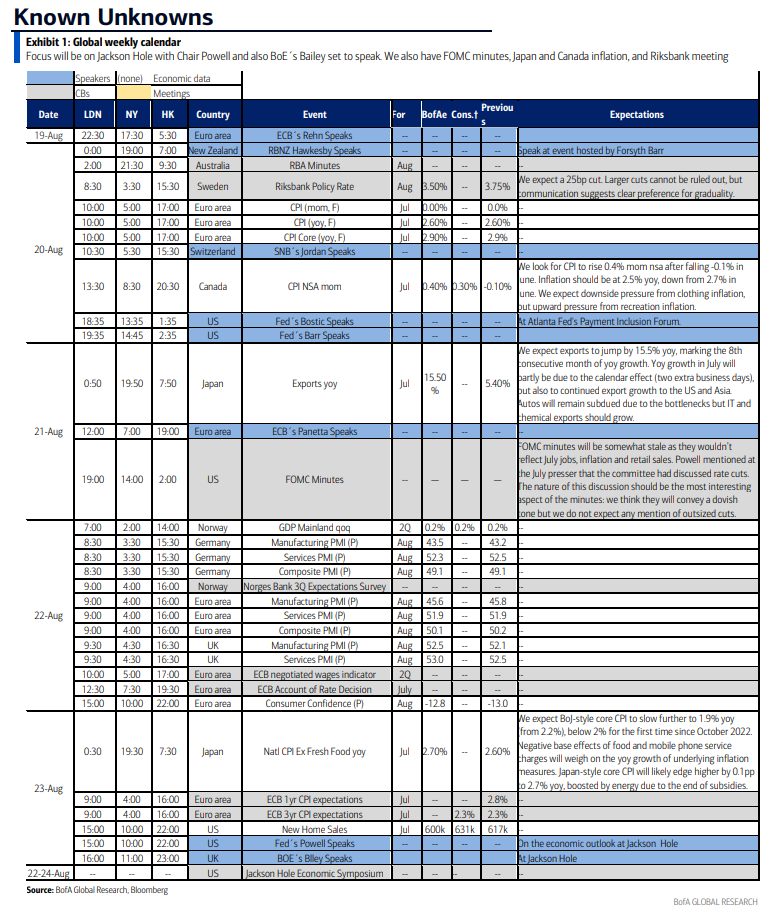
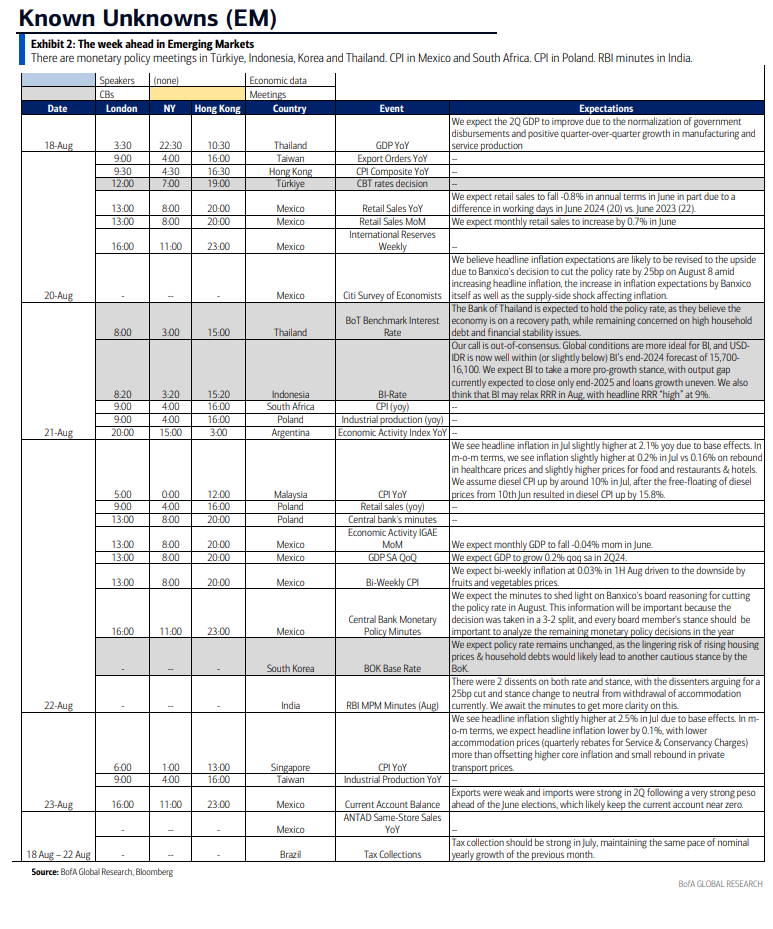
And here’s BoA’s cheat sheets for the week.
And here’s a calendar of 2024 major central bank meetings.
Market Drivers
So let’s go through the list of items that I think are most important to the direction of equity markets:
Fed/Bonds
As noted previously this was one of the sections that had grown unwieldy, so I’ve really pared it down. Given I provide daily updates on Fed expectations, Fedspeak, and analyst thoughts on the Fed, it’s duplicative (and time consuming) to gather it all again so, again, I encourage you to look at those (the daily posts) for updates. I will just give more of a quick summary.
For a refresher on the past 5 weeks you can see last week’s post in this section, but suffice to say a lot’s happened. But after all that, we now find ourselves not far from where we started. Despite another cool CPI report, Fed rate cut expectations fell throughout the week as recession fears were further priced out by better than expected retail sales and unemployment claims numbers. As noted in Friday’s post, markets now have three cuts fully priced but a fourth just 60%. September is most likely not a 50bps (just 28% chance priced). This is more consistent with my expectations, although I think tilt to the high side absent a material softening in the labor market or other key economic numbers.
Another thing I should mention is that I made a big deal last week about the discrepancy between market expectations and Fed speakers who as I said were “on a different page than markets….even the most dovish are talking about a ‘gradual’ pace of declines. Some of the more hawkish (like Gov Bowman this weekend) aren’t even sure they want a cut in September. So I think it will take something beyond just all the economic data coming in as expected between now and Sept to get more than a 25bps cut.”
That gap has now closed in both directions. I noted the markets cutting expectations of Fed cuts. But also the hawks have done a u-turn led by the uber-hawkish St. Louis Fed President Musalem who just two months ago said he was looking for “quarters not months” of cool CPI reports but last week opened the door to a September cut. Atlanta Fed Pres Bostic, another ‘24 voter, who had as lately as two weeks ago said he was looking for a December cut, last week said he was open to one in September. Let this be a good lesson that Fed members may not be quite so entrenched in positions as they may let on. Given that, I think September is a lock absent something completely unexpected (even a warm August CPI print I don’t think changes that) but I think it will take a very weak August employment report (worse than what we saw for July) for it to be a 50bps.
We may learn more this week when we hear from Powell at Jackson Hole. As a reminder, this is a common place for the Fed Chair to “set the stage” for policy pivots so the perfect opportunity to give everyone a roadmap for how the cutting process is going to play out.
As a reminder, here was my thinking at the beginning of the year, but as I said a month ago, at this point a hike has basically become a zero probability proposition, it’s just a matter of when the Fed decides it’s time for the first cut (which now seems to be September) and really the bigger question is what the pace of cuts is thereafter:
What also seems fairly clear, consistent with what I’ve been saying all year, is that this is a Fed that overall wants to cut and achieve the rare “soft landing”, doesn’t want to hike (for that reason), but also doesn’t want to make a mistake. In that scenario, the “right” course of action is to just do nothing until 1) the data gives the all clear to cut (which as Powell made clear can either be cooler inflation prints or a marked softening in the labor market) or 2) the data absolutely forces a hike. So things remain very much one-sided in terms of the hike/cut balance. A cut is far more likely, it’s just a question of when. As such, all that hot inflation prints do (as long as they’re not too hot) is push rate cuts further into the future.
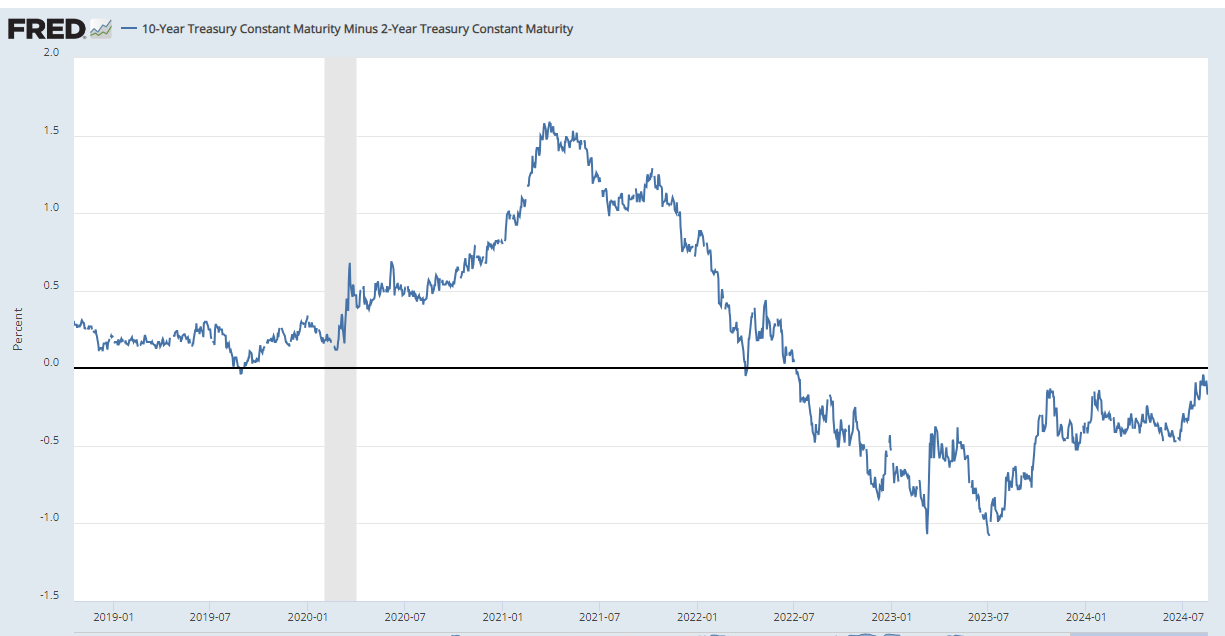
Turning back to where we are now, with yields rising a little more on the long end this week, the 2/10 curve, which at one point disinverted the previous week, pushed lower to -0.17%, -6bps w/w according to the St. Louis Fed. Still, though, the un-inversion feels like a matter of time.
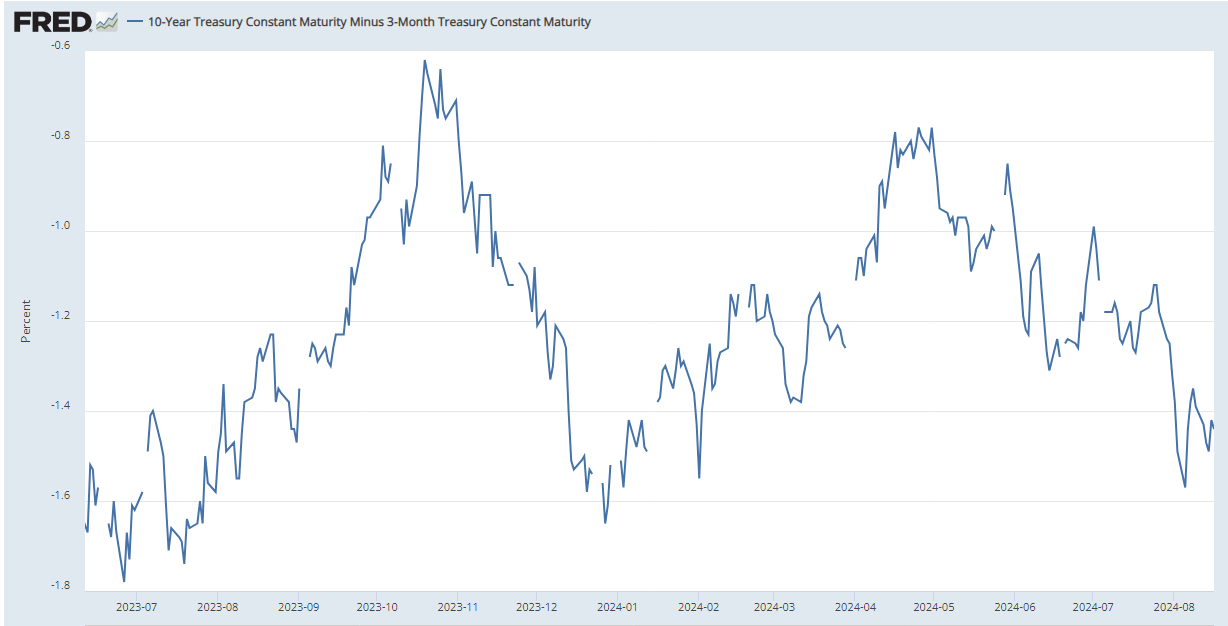
The 3mos/10yr yield curve (considered a better recession signal than 2/10’s) a lot farther from uninverting at -1.44% vs -1.39% a wk ago.
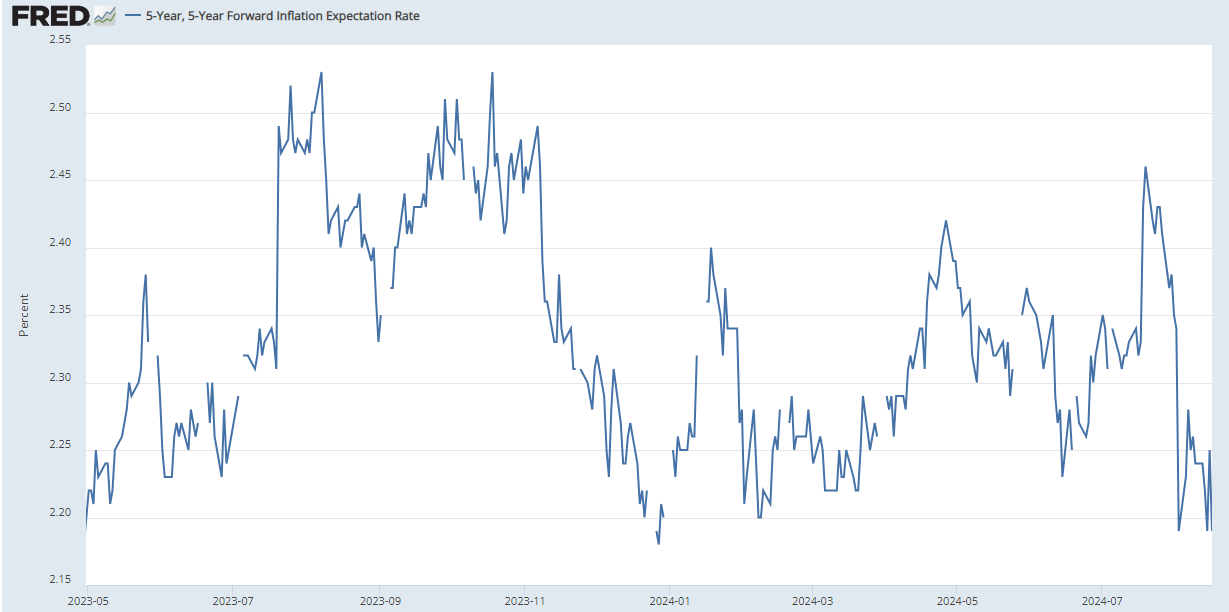
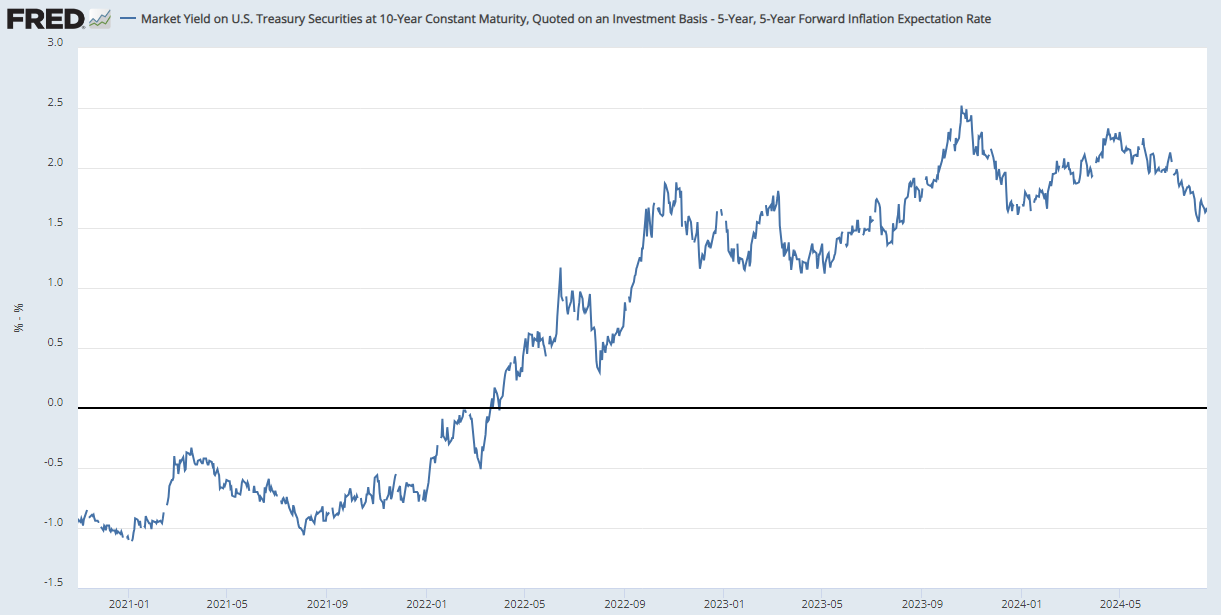
While longer term inflation expectations, as judged by the 5-yr, 5-yr forward rate (exp'd inflation starting in 5 yrs over the following 5 yrs) fell back to the lows of the yr (and just above the least since Apr ‘23 ) -5bps w/w to 2.19%.
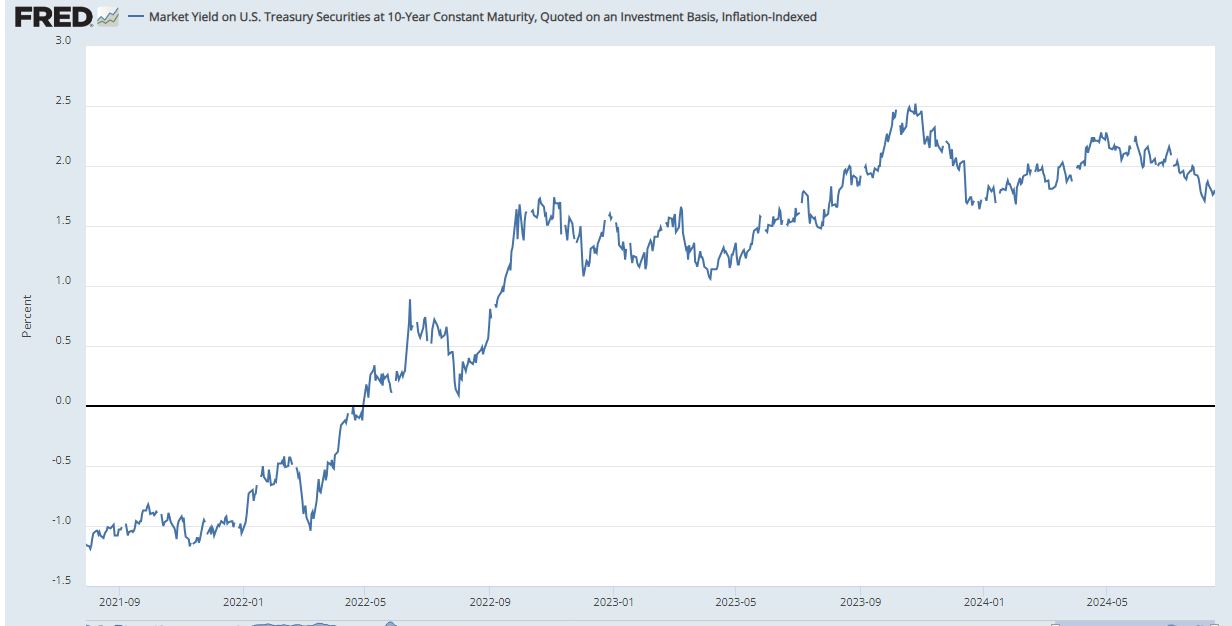
With inflation expectations falling more than yields, 10yr real rates using 10yr inflation-indexed bonds increased +7bps w/w to 1.80% from the least since Jan but overall remaining in their range of this year.
A similar story if you calculate 10yr real rates using 5-yr, 5-yr inflation expectations (subtracted from the 10yr nominal yield) although those come in lower at 1.67% after hitting the lows of the year Aug 5th (but still above 2010-2020 peak of 1%).
Shorter-term real yields though (Fed Funds - core PCE from GDP (3mth annualized as of Q2)) back over 2% at 2.43% up from 1.63% in Q1, but down from 3.3% in Q4 which had been the highest since 2007 (this only updates quarterly).
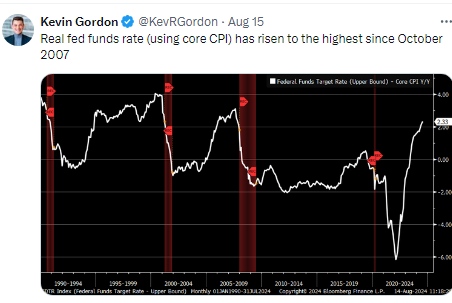
And using core CPI it’s now the highest since Oct ‘07 at 2.33%.
And I’m not exactly sure the reason (I’ve messaged the St. Louis Fed) but the 10yr Treasury term premium on FRED was shifted up (for the entire series) around 0.3%, which is a notable change putting it now in positive territory since early 2022 with just a couple of dips into negative territory. It’s also a week behind now. As of Aug 9th it’s showing +0.16% up 10bps from Aug 5th which was the lowest in a yr.
This is something markets were laser focused on when it hit +0.62% last October (according to the new data), but then lost interest in. I continue to think as you get into 2H of this yr, with a lot of talk about deficits and interest costs (i.e., more supply needed), etc., this may resurface as an issue that will push yields higher and cause some equity indigestion as it did then.
The extended discussion on term premium (what it is, why it’s important, etc.), can be found in this section in the Feb 4th Week Ahead.
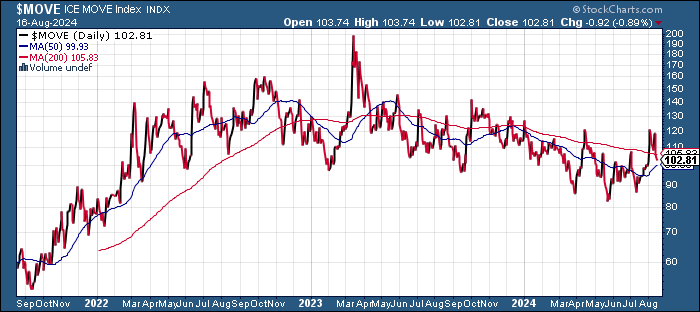
As the MOVE index of bond volatility continues to ease off, but it never even eclipsed the April highs. Still though remains well above pre-2022 levels.
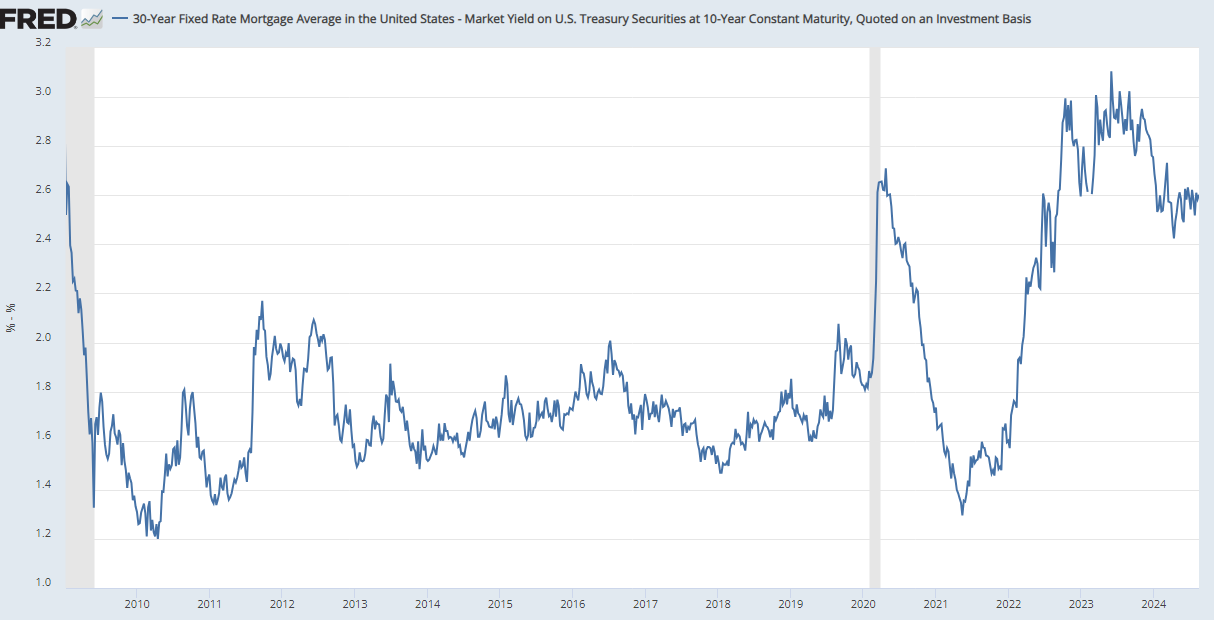
Despite the w/w decrease in bond volatility, mortgage spreads were little changed w/w at 2.60% on Thursday (they’ve been little changed in fact since the end of Apr), remaining well above prepandemic levels but still well below the highs from last year.
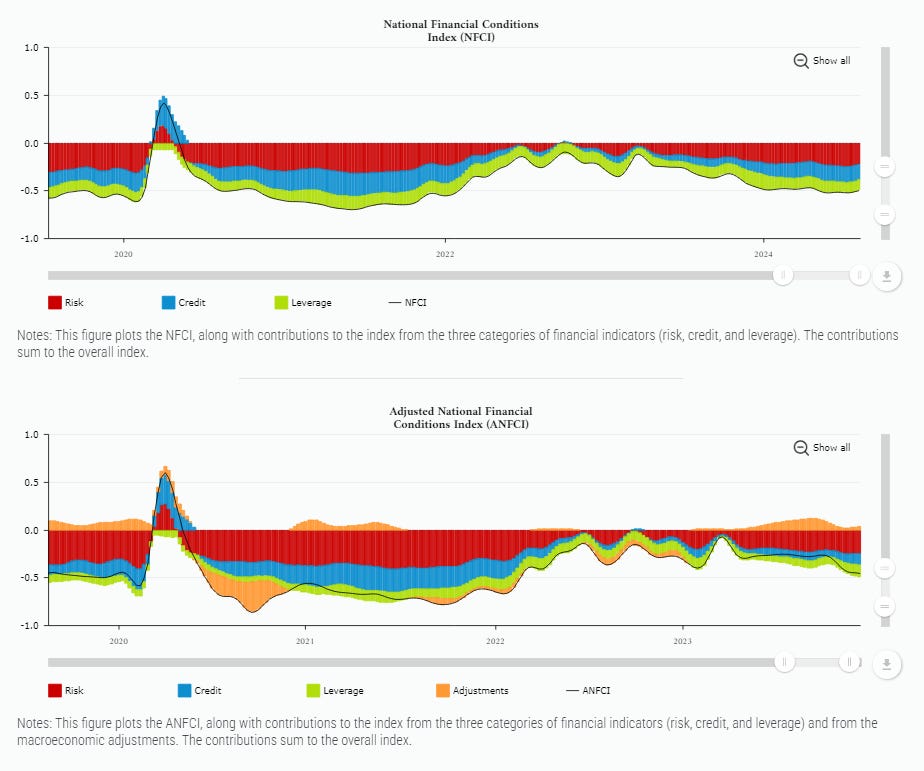
And the Chicago Fed National Financial Conditions Index and its adjusted counterpart (which are very comprehensive each w/105 indicators) in week through Aug 9th saw the former increase for a 2nd week to the least loose since May (but still just +0.02 from the loosest since Nov ‘21) while the latter was unch remaining the least since Feb ‘22.
While BoA’s financial conditions index continues to have a different take from many others remaining “above normal” and tightening for a 2nd week to +0.56 standard deviations above normal in the week ending Aug 1st (+0.01pts w/w) but the language remains the same: “Incoming data that point to slowing activity and cooling inflation have increased expectations of Fed rate cuts. Overall, we characterize financial conditions as moderately restrictive; above average, but well below prior cycle peaks.”
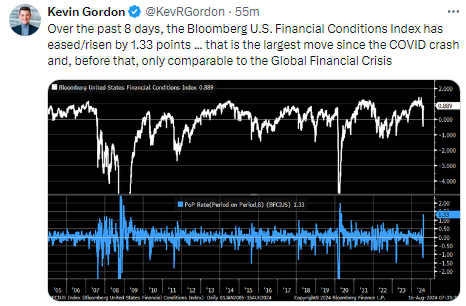
And Bloomberg’s eased the most since Covid.
Turning to the discussion on the Fed’s balance sheet/QT and its impact on RRP this week, we continue to get steady, sizeable auctions of T-bills (<1 yr) of around $800bn/month (which was confirmed in the Treasury Refunding Announcement last month) as well as $60bn in balance sheet runoff which combined drained ~$1.75 trillion from RRP in the year through Mach 1st, but as noted in previous weeks, RRP levels had remained stable in the $375-$500bn range until two weeks ago when they dropped to a new range which seems to be $285-$350bn. This week they came in at $330bn after hitting the least since May ‘22 at $286bn Aug 7th. As a reminder BoA estimates that RRP will be mostly gone by October, but Citi was out this week saying it will likely remain around the $300bn level (more below) for the time being. If they do fall much further it will be time for the FOMC to start to look to further slow QT.
For more on BoA’s forecasts for RRP to drop to near zero ($60bn) by Oct you can follow the link (but it’s mostly due to RRP yields falling below those of money markets and will be soaked up by bonds (from Fed QT), the Treasury (with a higher TGA), and currency growth (in dollars). If bank reserves increase that would also pull from RRP. They see it building again into early 2025 before declining again towards zero.
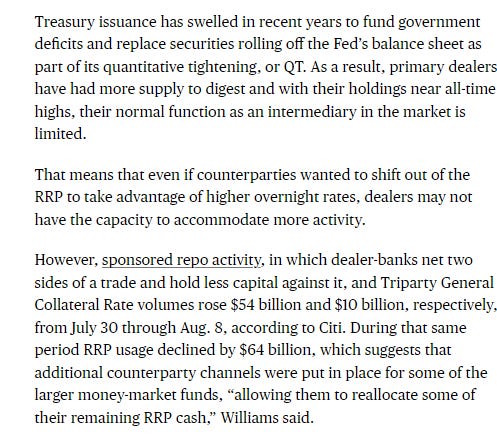
And here’s more on Citi’s thinking that $300bn is a “constraint level” which they say is mostly due to the increased Treasury supply which had absorbed RRP up until March as noted being absorbed by dealers due to just constraints in their ability to intermediate Treasury purchases as well as increased holdings due to “sponsored repo activity”. Still they see it eventually falling lower if/when RRP rates fall.
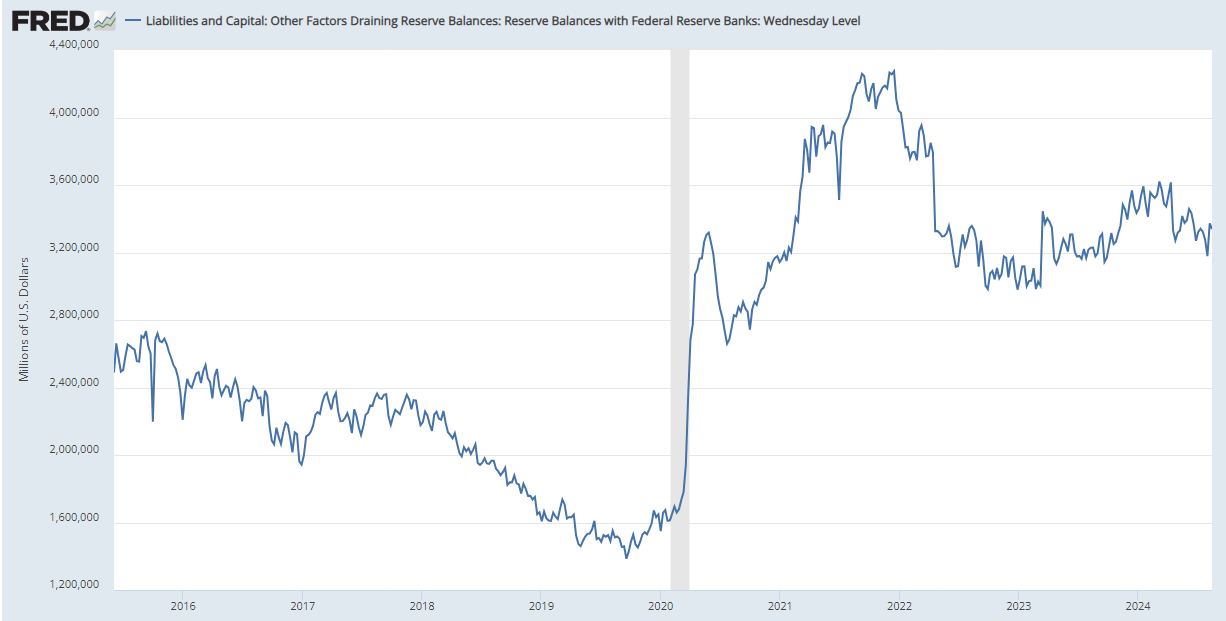
Bank reserves built for a 2nd week after having fallen to the least since fSep ‘23 into the "scarcity" level estimated at around $3-3.25tn, up +$194bn w/w to $3.34tn. I had noted last week was interesting the pullback in stocks occurred as RRP and bank reserves fell in tandem, so I wonder if this is a signal that better liquidity conditions have returned. They now are up $15.5bn since June 1, 2022 when the Fed started QT, a much better result than even the most optimistic estimates at the time. BoA as a reminder expects reserves to remain around $3.3tn indefinitely, a prediction that has so far proven correct.
For background on various estimates of when reserves will be “too low” see the Feb 4th Week Ahead.
Getting back to rates, I said 14 weeks ago 2-year Treasuries were a good buy at 5%, and I had thought we wouldn’t have a chance to get back there again until the next round of inflation reports in June (if they came in hot). As I noted two weeks ago,
Well, they certainly didn’t come in hot, making 5% a long shot now and likely setting up 4.75% as a new ceiling for now (but many think we’ll revisit those levels in coming years and perhaps exceed them). I have also said 4.7% is a good place to ease into 10yr’s and that also seems unlikely anytime in the near future (and those who were waiting for 5% are likely to see a 3-handle first). At this point, the momentum is to the downside, and while I think we may find ourselves back at higher levels at some point, for now I’d be looking lower on yields not higher.
And as I noted last week,
That all is doubly true now following the round of weak economic reports (and mild wage reports). We still do get July CPI coming up which if it comes in hot could see a lot of the move in yields retrace, but it seems at this point that it will be some time before we see 5% on either 2’s or 10’s.
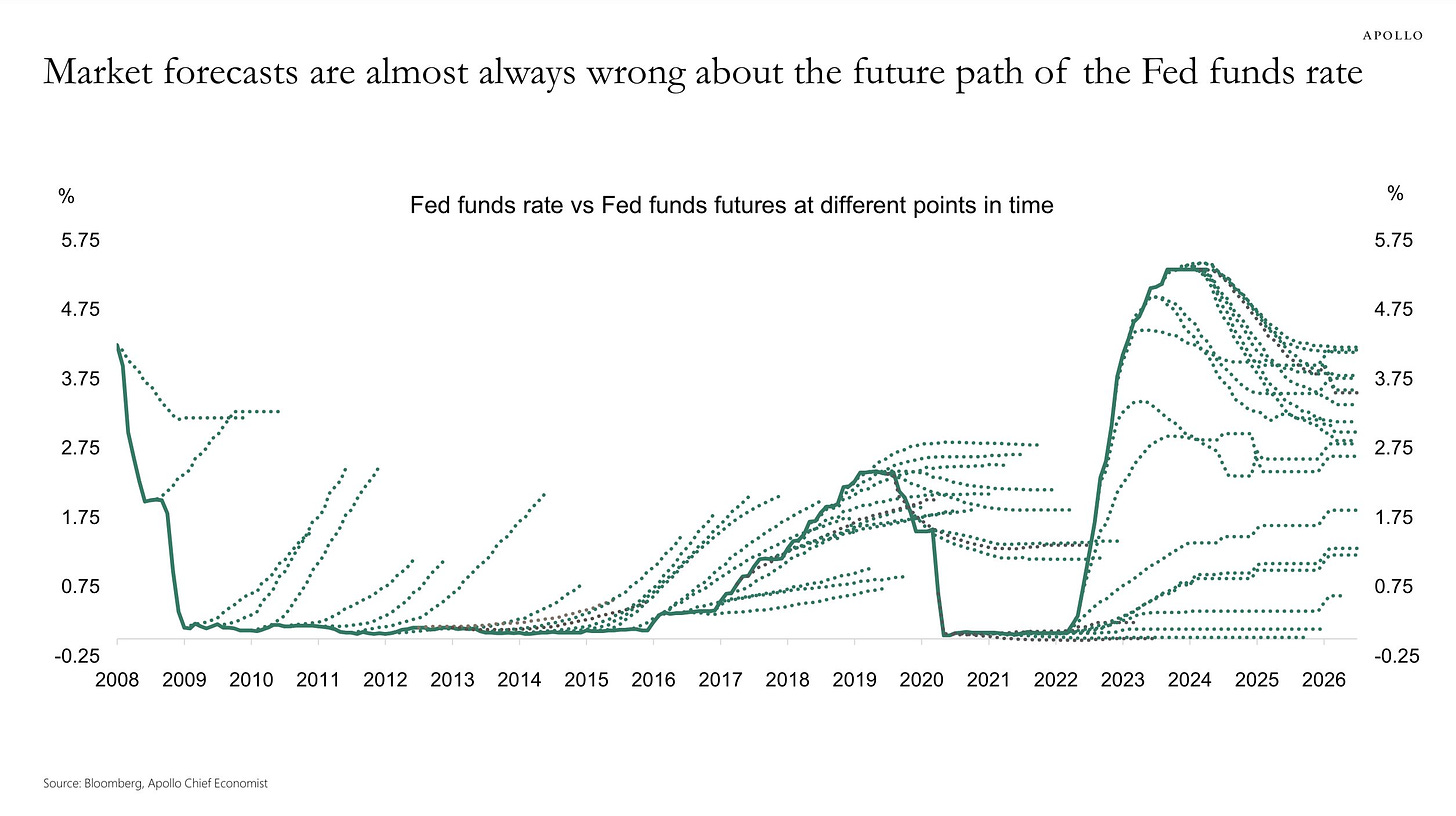
And a nice graphic about Torsten Slok, although you could probably make a similar chart for just about anything related to market expectations.
Also removing all the legacy “final hike” and “first cut” materials, which can also be found in the Feb 4th blog post. I will put in new things if they come up.
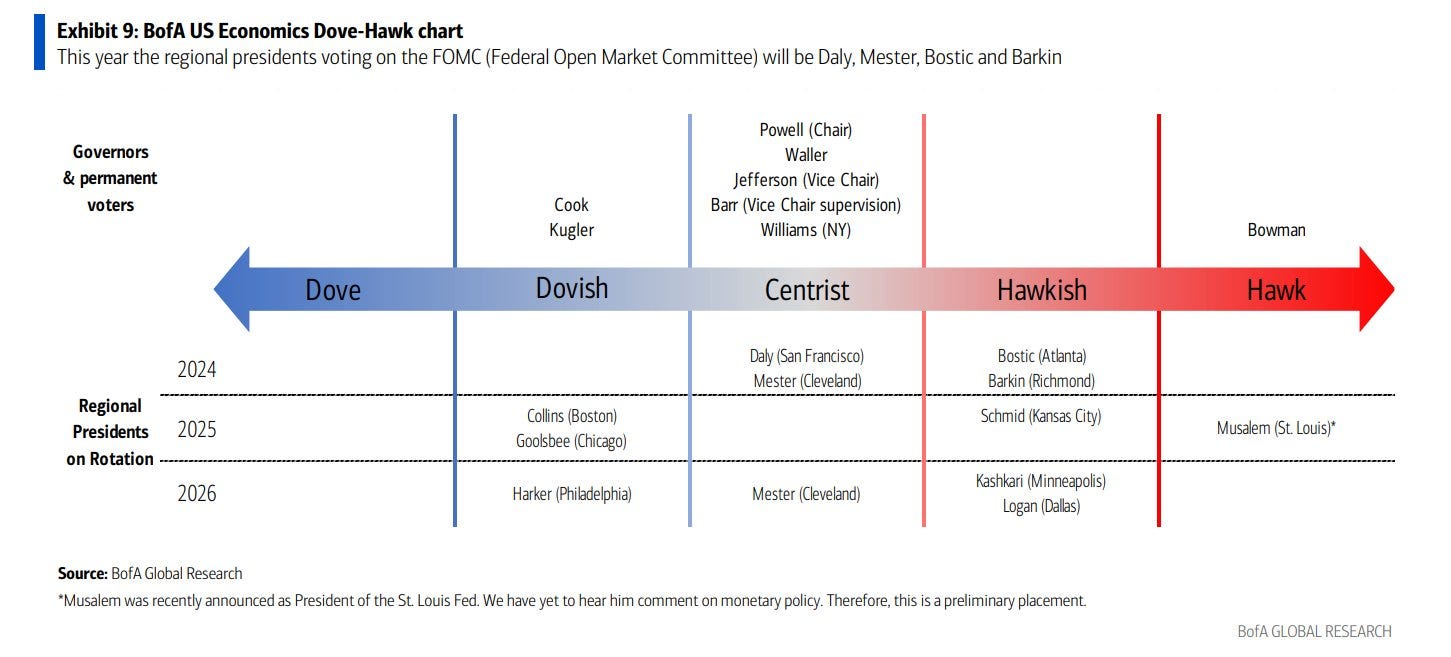
And a change this week in BoA’s FOMC Dove-Hawk chart w/Harker moving to “Dove” from “Dovish”. I think you could put Daly there as well (certainly not a “Centrist"), and I’d probably move Schmid to a “Hawk”.
Note Mester is listed but that should be her replacement Beth Hammock who hasn’t spoken yet, so we can only guess (while Musalem has an asterisk even though we’ve heard from him several times (I’ve messaged them to update this)).
Earnings
As a reminder, I have removed most of the background material, which you can get in the Feb 4th blog post. As you know I’ve moved on to 2Q and beyond. You can reference this post from 5/12/24 for stats on 1Q.
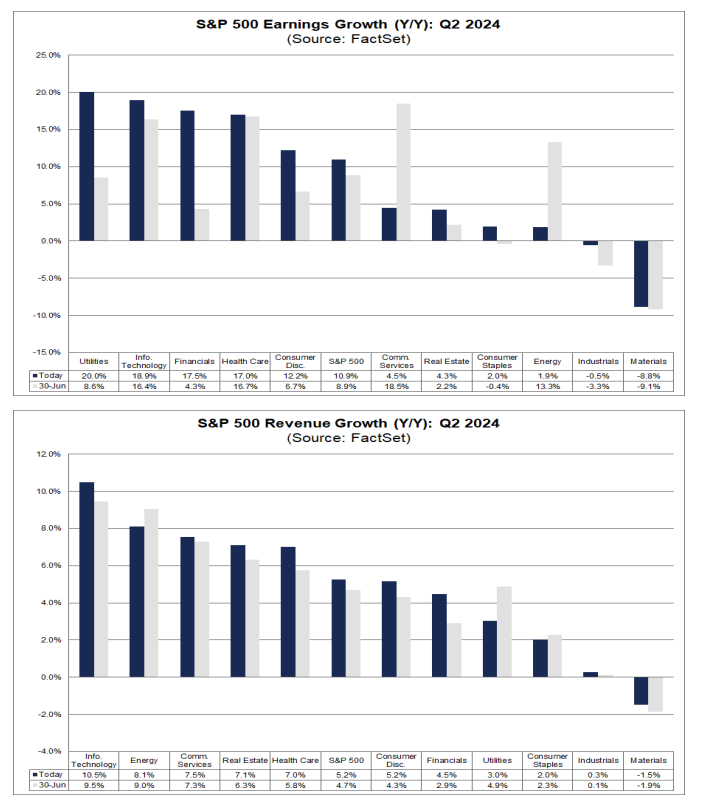
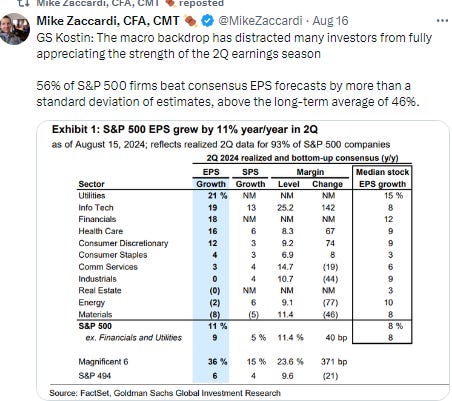
As a reminder, with now 93% of SPX earnings in (by earnings weight), there’s not much point in updating this section as to Q2 as those are basically locked in now. I will leave in those numbers until we get to Q3 earnings. We could see some changes as to future quarters, so I updated the numbers which changed modestly, but this will be the last update for other than perhaps as to where
Through Thursday we had 91% of SPX earnings in (which means things are now pretty much “locked in” for the SPX, so I’ll not update this until we get to 3Q earnings in October), and the good news is 79% have beaten (above the 5yr avg of 77% and 10yr avg of 74%). The less good news is despite the high beat rates, earnings came in just +3.5% above exp’s on avg, well below the 5yr avg of 8.6% and 10yr avg of 6.8%. And the weak results this past week have seen Q2 expectations fall back for the first week since earnings season began, down to +10.9% from +11.4% last week, although still above the +8.8% at the start of earnings season. This is far less than the the avg improvement from the start of earnings season the last 10yrs of +6.8%, which is consistent with what I’ve said the past few weeks (that I don’t think we’re going to get that avg increase this quarter).
Revenues were worse, beating at just a 60% clip below the 5 & 10 yr avgs (69 & 64%), and coming in just +0.5% above expectations, the worst performance since Q4 ‘19 and below the 5yr avg (2%) and 10yr avg (1.4%).
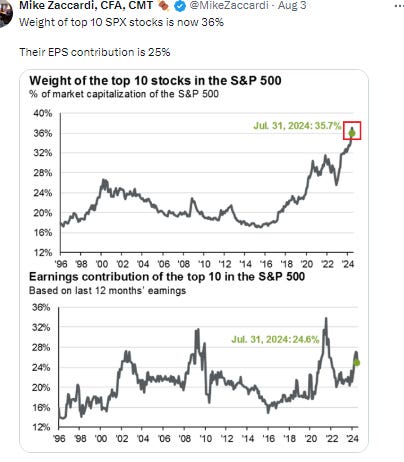
And part of what we’re likely seeing with the weakness in the megacaps is a correction of them outrunning their earnings.
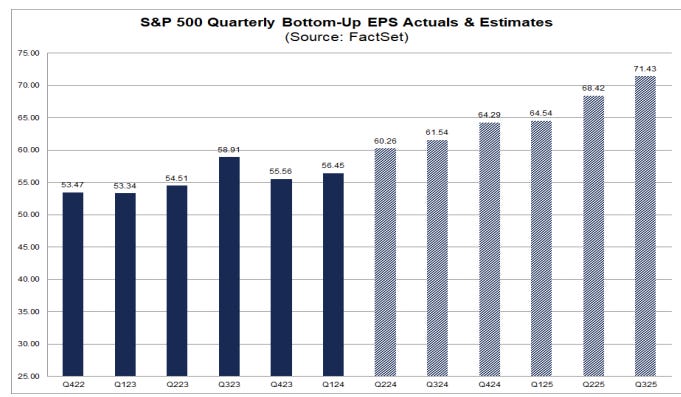
Looking down the line, earnings expectations for future quarters continue to fall more than they typically do somewhat offsetting the increase in Q2 expectations w/Q3 expectations -0.2% w/w, now down -2.9% the past 6 wks to +5.2%, Q4 down another -0.2% to +15.5%, Q1 2025 down -0.1% to +14.4% while Q2 ‘25 dropped -0.1% +13.9%.
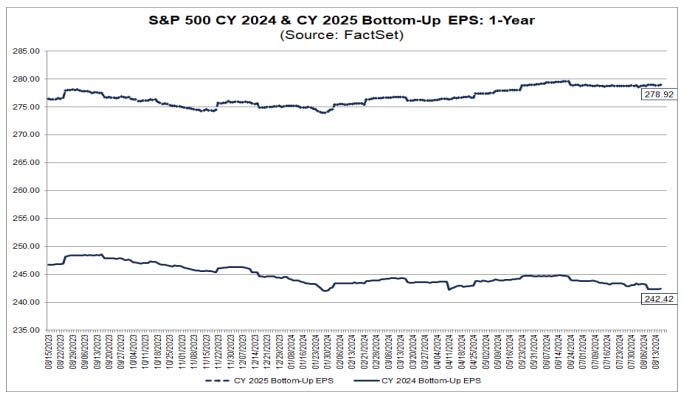
Putting it together FY ‘24 expectations fell to $242.50 (from $242.50 the prior week but $245 on June 26th) as expectations fell for Q2 - Q4, to around the least we’ve seen to date, although it still remains above the typical -6% or so drop we historically see from July of the prior year
2025 earnings expectations continued to remain little changed though at $278.92 up slightly from $278.69 the prior week, remaining up around $4 from the start of the year.
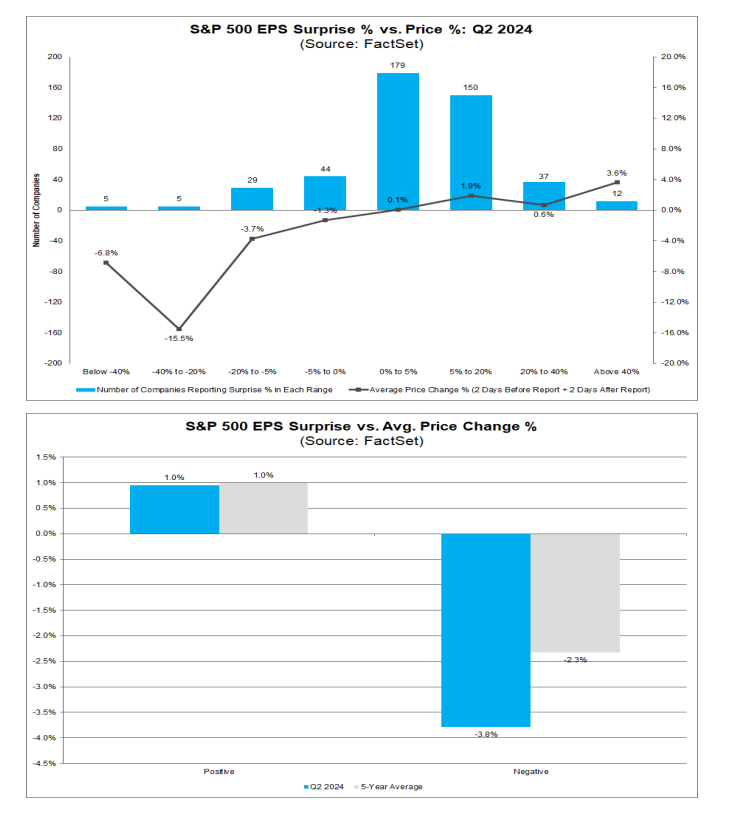
In terms of how the market is digesting results, it’s improved for beats to “average levels” but misses continue to be punished (looking at 2 days before to 2 days after reporting) vs history:
Companies that have reported positive earnings surprises for Q2 2024 have seen an average price increase of +1.0%…equal to the 5-year average price increase of +1.0%.
Companies that have reported negative earnings surprises for Q2 2024 have seen an average price decrease of -3.8%…This percentage decrease is larger than the 5- year average price decrease of -2.3%.
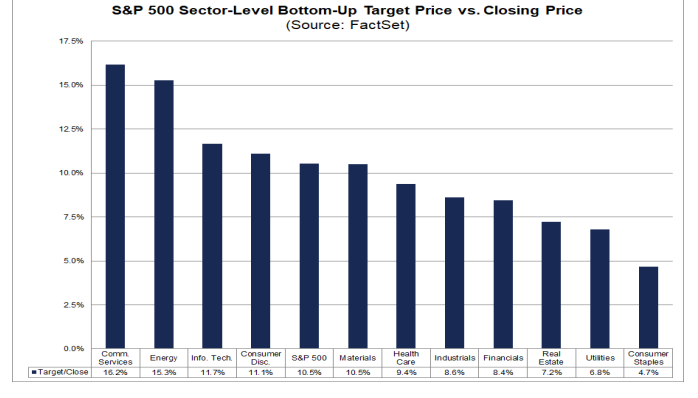
Factset’s analysis of analyst bottom-up SPX price targets for next 12 months as of Thursday got back most of the drop in the previous week +49pts w/w to 6128 now up ~1,090 points over the past 24 weeks. Communications now has the largest gap (+16.2%) from tech last week and staples the least (+4.7%) from RE last week.
As a reminder the last 10 yrs they have been on avg +2.9% too high (+3.4% last 5 yrs). Of course, that avg range masks a wide discrepancy between big up and down years for the SPX.
In terms of analyst ratings, no change this week w/buy and hold ratings continuing to dominate at 55 & 40% respectively (as has been the case all year). Energy (63%), Communication Services (63%), and Information Technology (61%) sectors have the highest percentages of Buy ratings, while Consumer Staples (45%) have the lowest percentages of Buy ratings.
And some other earnings stuff:
Economy
As I’ve written over the past 18 months, part of my earnings optimism has been due to the economy holding up better than expected. While earnings only track the economy loosely (and markets look forward 6-12 months), there is a clear correlation between recessions, lower earnings, and lower stock prices (although stock prices (being as noted forward looking) generally fall in advance of the recession and bottom 6-9 months before the end of the recession). So if you can see a recession coming it is helpful, although very difficult (especially ahead of the market). You can reference this Week Ahead (see the Economy section) for a lot of material on how every recession is preceded by talk of a “soft landing” as close as a month before the start (Note: As I noted a few weeks ago this has become more relevant as we see further signs of slowing). On the IRA infrastructure act, the November 26 report has good info on how that should be supportive at least through the end of this year. That report also has the notes about how small caps have shorter debt maturity profiles and more of it.
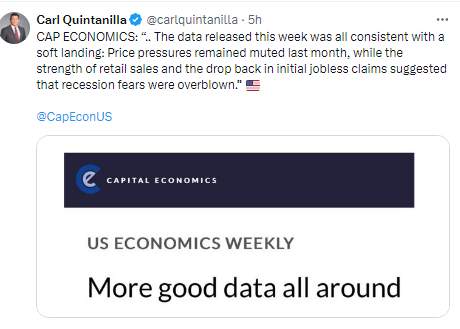
As I’ve been stating since I switched to the Week Ahead posts in mid-2022, the indicators to me are consistent with solid (which at times has been robust) economic growth, and I have been a broken record that I “certainly [did] not think we’re on the verge of a recession (although as noted above every recession starts out looking like just some economic softening).” But a few months ago I added “That said, I’ve also noted over the past __ weeks or so [now 16], we have clearly started to see some moderation in key areas like consumption, manufacturing, construction, exports and housing.” This week was very heavy on data and gave us some relief that the for now it does not appear that the softening is continuing into a recession although some key areas like housing are clearly at recession levels. In particular retail sales and jobless claims gave us some positive news on consumption and the labor market (although it’s important to remember that retail sales are just 40% of total consumption and jobless claims just tell us about firings, not much about hirings of salaries (incomes)). Industrial production and housing starts were very weak, but both were likely impacted by Hurricane Beryl, so we’ll need to see if those bounce back in August data to make any broader statements. But suffice to say neither would have been strong hurricane or not. Both consumer and small business sentiment improved, which is good to see, while price data remains tame for now, also good to see.
Overall, as I said two weeks ago:
without question, the evidence is building that the days of 3+% real GDP growth are behind us, and we should be happy to settle into something more around trend (1-2% real (infl adjusted) growth. That though is far from a disaster. The important thing will be to see the softening level out (L-shape) rather than continue to fall turning the “soft landing” into a recession.
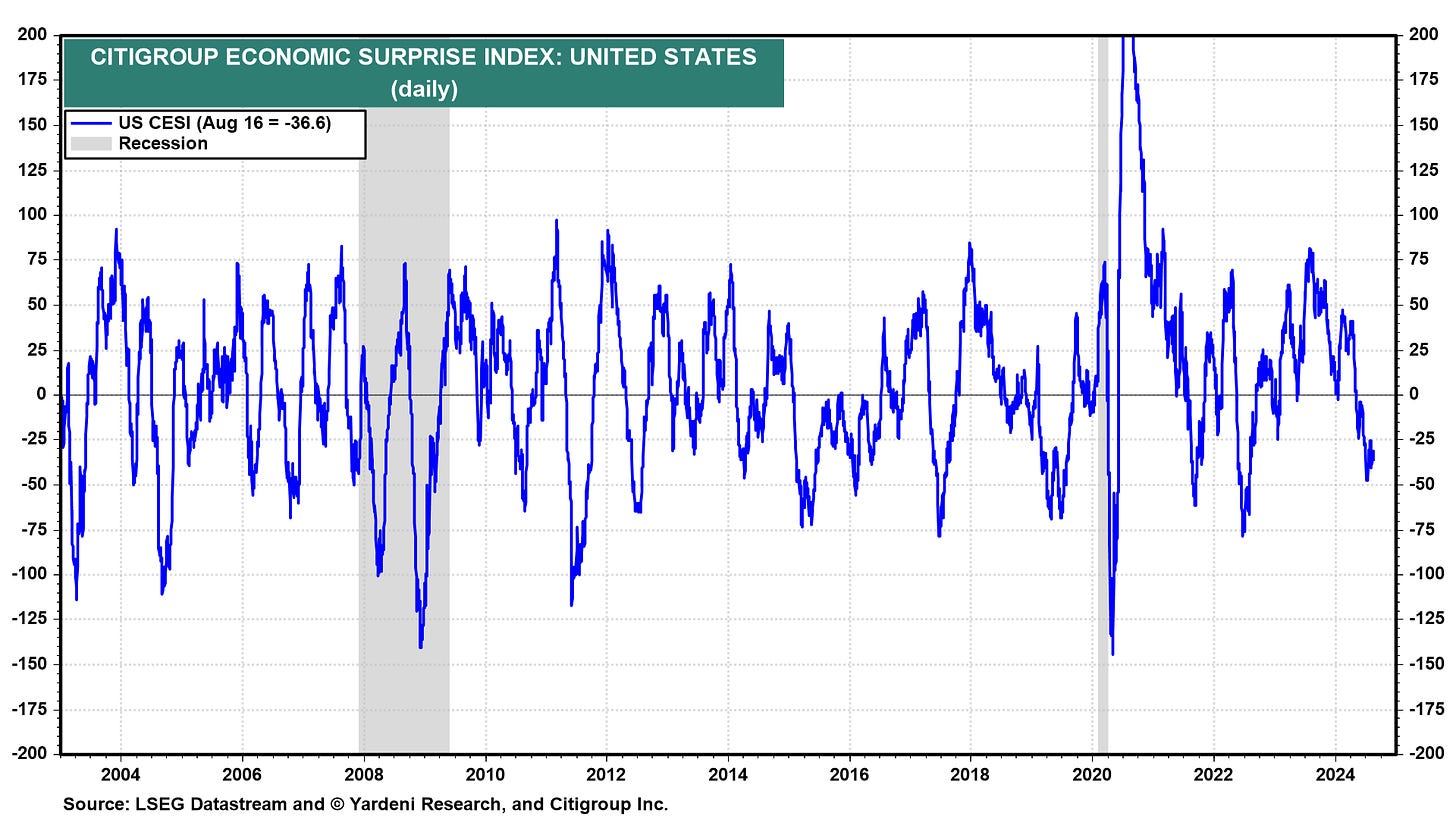
And the Citi Economic Surprise Index reflected the mixed data last week remaining solidly in negative territory at -36.6 down from -34.3 the prior week but also above the -47.5 five weeks ago which was the least since July ‘22).
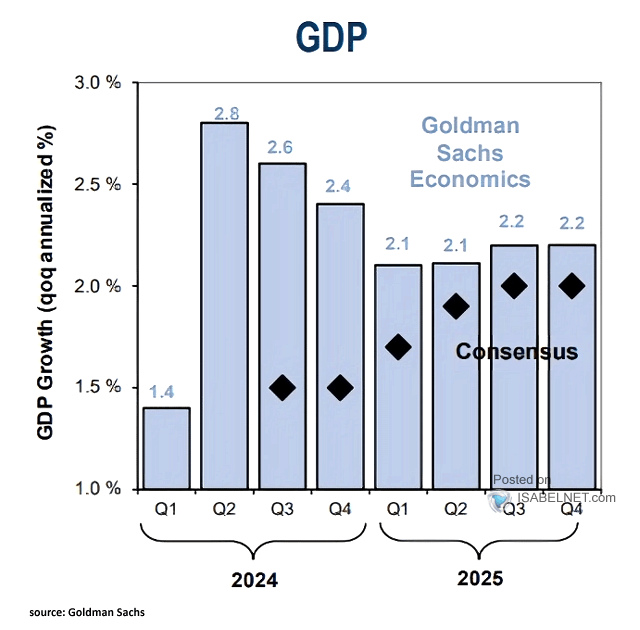
And GDP estimates are for now consistent with a no recession call (again though remembering GDP going into recessions generally doesn’t look like one is coming (it was up around 2% in Q2 & Q3 2008 well after the recession had started)). They did though deteriorate again this week as you might expect.
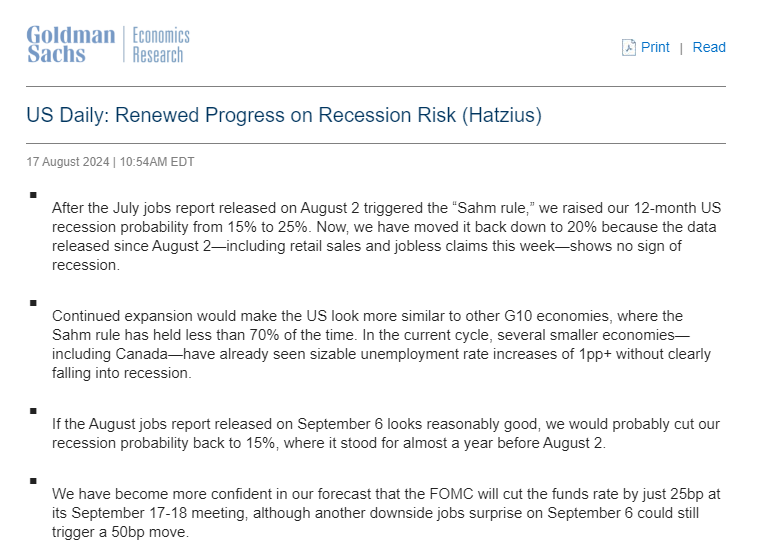
Goldman (who was at 2.3% for 2Q) as of Friday still had their 3Q estimate to 2.6% but I saw a headline that they might have just lowered it to 2.4%. Still, that’s above most other estimates and they also lowered their recession odds to 20%.
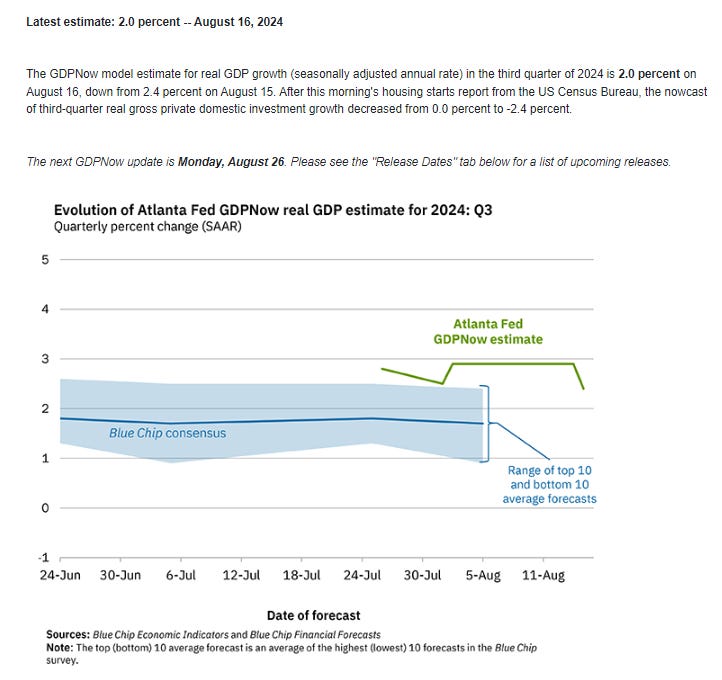
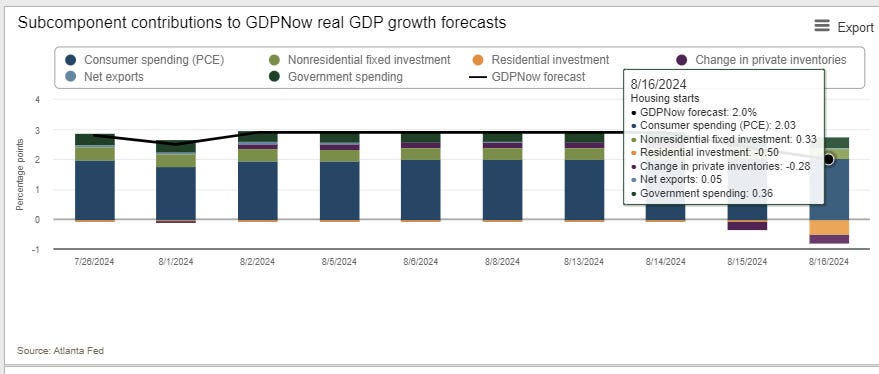
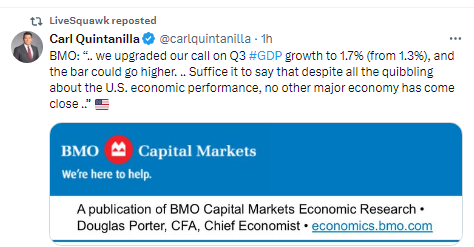
Atlanta Fed (who was the closest of the #GDP trackers for 2Q, just missing at 2.7% vs 2.8% first est), drops its 3Q est to 2.0%, the lowest since it initiated 3Q tracking in late July from 2.4% Aug 15th (& 2.9% Aug 8th) primarily on the back of a -0.44% drop in the contribution from residential investment. Consumption was also marked down slightly (-0.01%). The rest of the drop from last week was primarily due to a -0.45% markdown to the contribution from private inventories (so inventories were drawn down (which reduced GDP)).
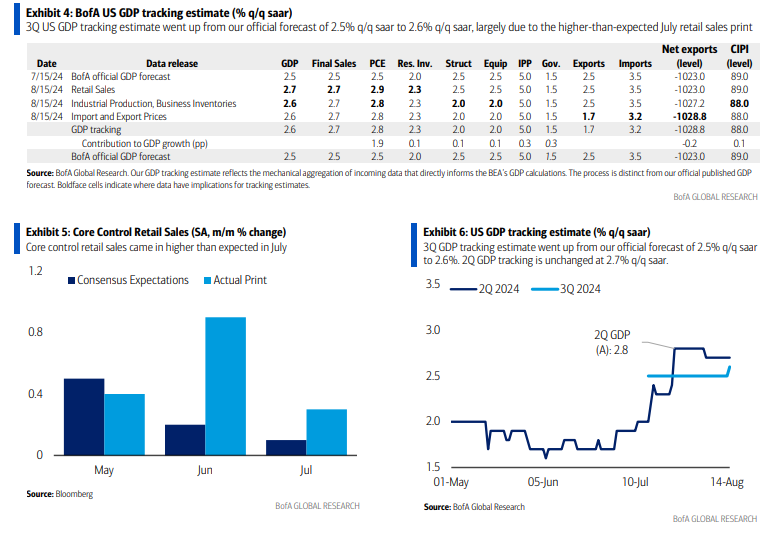
BoA’s initiates their 3Q GDP estimate at 2.6% through Thurs’s data (they had 2.4% ahead of 2Q not far off the 2.8% actual 1st est).
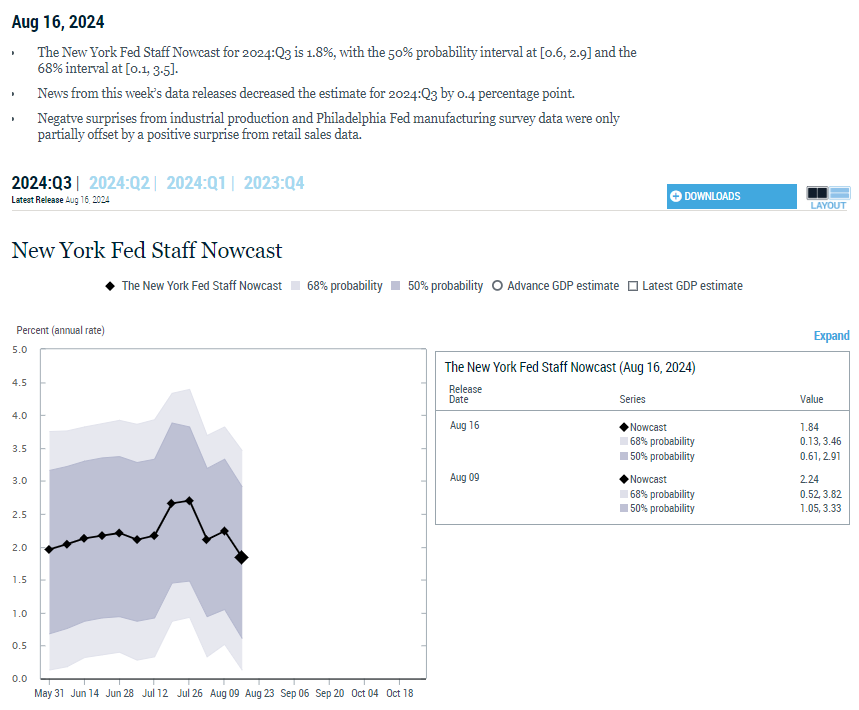
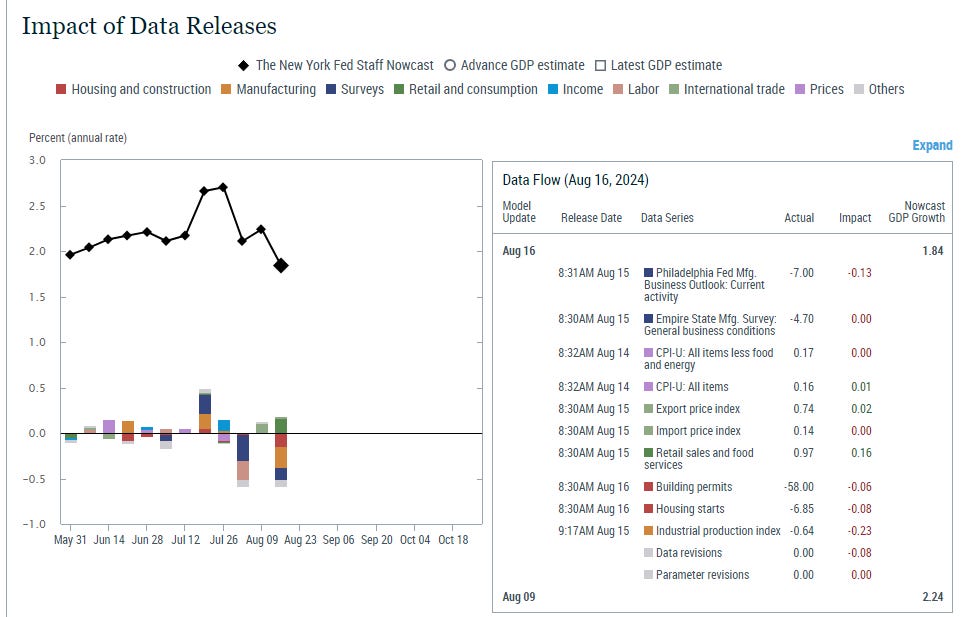
While the NY Fed’s 3Q GDP Nowcast (as a reminder, they had 2.01% for 2Q) like the other trackers falls back in their case to 1.84% from 2.24% the prior wk primarily stemming from the Philly Fed Mfg report (-0.13%), building permits/housing starts (-0.14%), industrial production (-0.23%) offset by retail sales (+0.16%).
And the St. Louis Fed GDP tracker, which outside of Q1 (where it was the closest) has significantly undershot actual real GDP since Q3 ‘22 edges it’s Q3 ‘24 est to 1.3% from 1.63% last week.
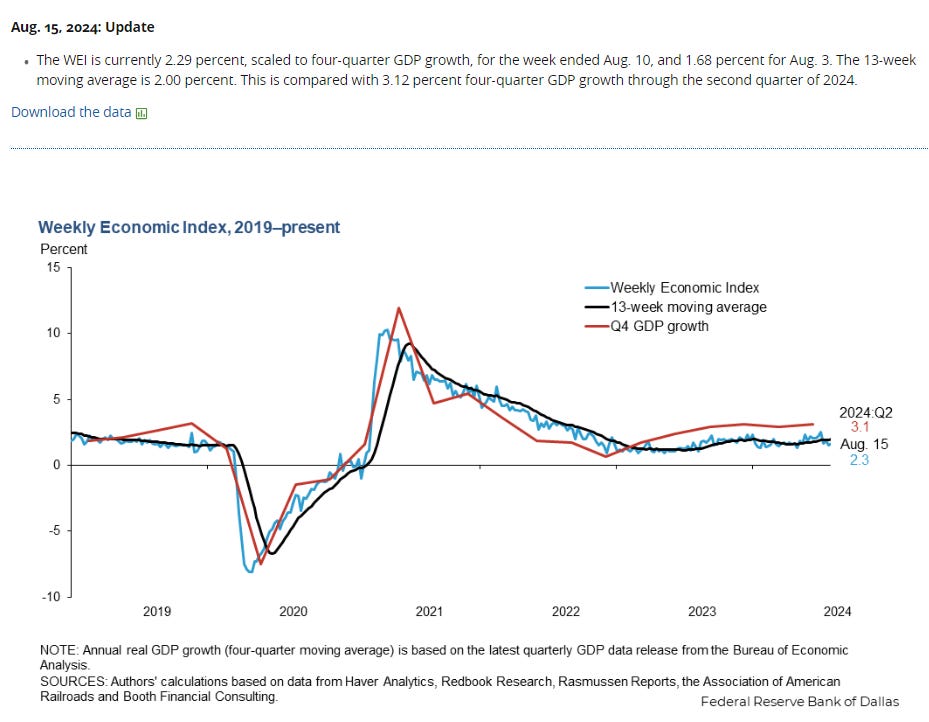
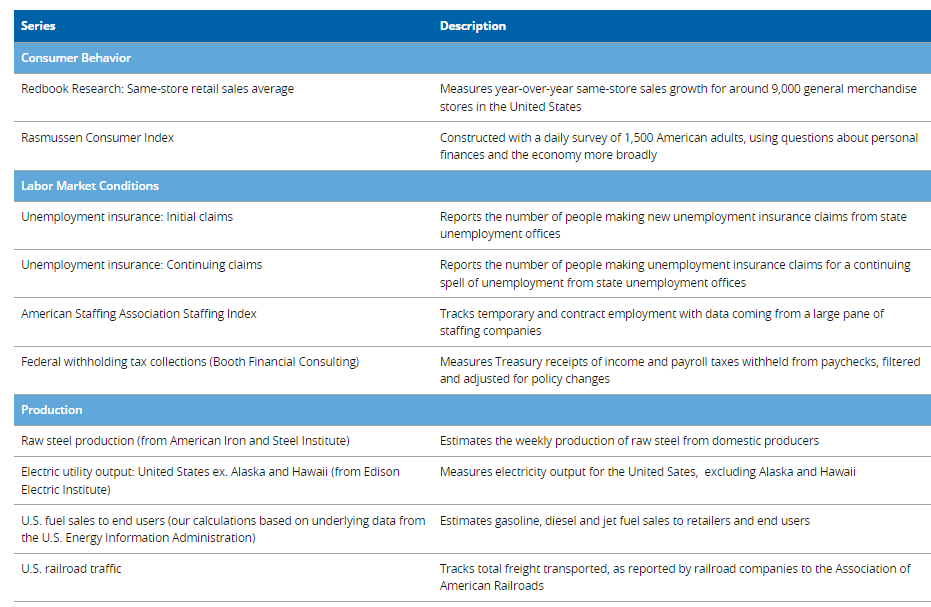
While the Weekly Econ Index from the DallasFed (scaled as y/y rise for GDP), which runs a week behind other GDP trackers, improved in the wk through Aug 10th to 2.29% from 1.68% the prior wk (rev’d down from 2.2% this series is consistently revised lower in the following week but the last 3wks have been larger than normal)). The 13-wk avg held at +2.0%, it’s first week of not improving in a while still the highest since 2022 evidencing improved economic momentum, and the weekly index has moved back over the 13-wk avg (subject of course to the almost guaranteed downward revision we’ll get in the upcoming week).
Here’s the components.
Other economy stuff:
Multiple
Like the other sections, I’ll just post current week items regarding the multiple. For the historical stuff, see the Feb 4th blog post.
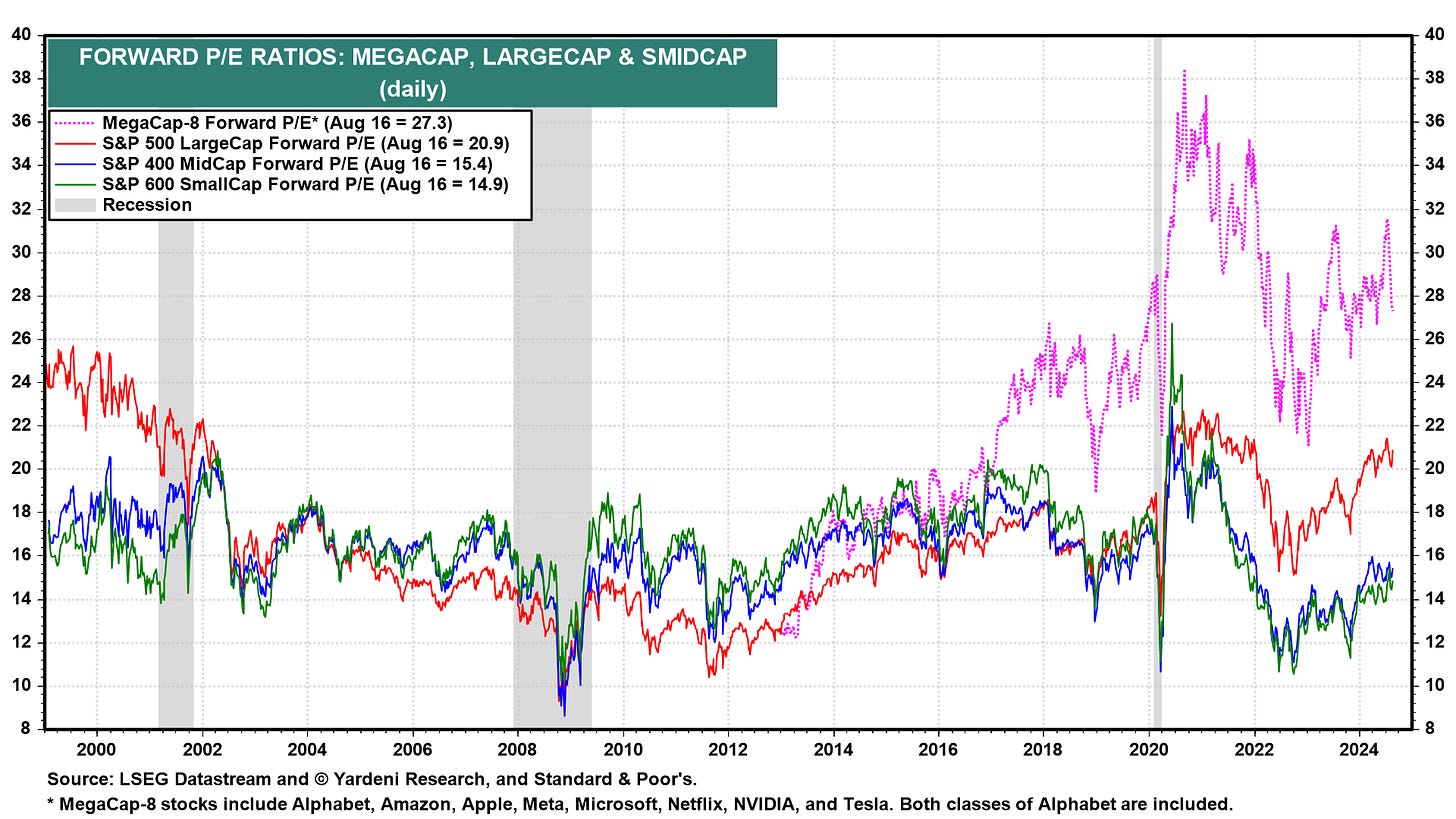
With the SPX jumping higher, the SPX forward P/E did as well up eight tenths to 20.9 still down from 21.4 five weeks ago (which was the highest since Jan '22). The “Megacap-8” P/E though fell four tenths as earnings estimate increases more than offset the rise in stock prices now at 27.3, the least in over a year and down considerably from 31.5 four weeks ago (also the highest since Jan ‘22). Mid-caps and small caps though both up four tenths to 15.4 & 14.9 resp moving towards the highs of the year.
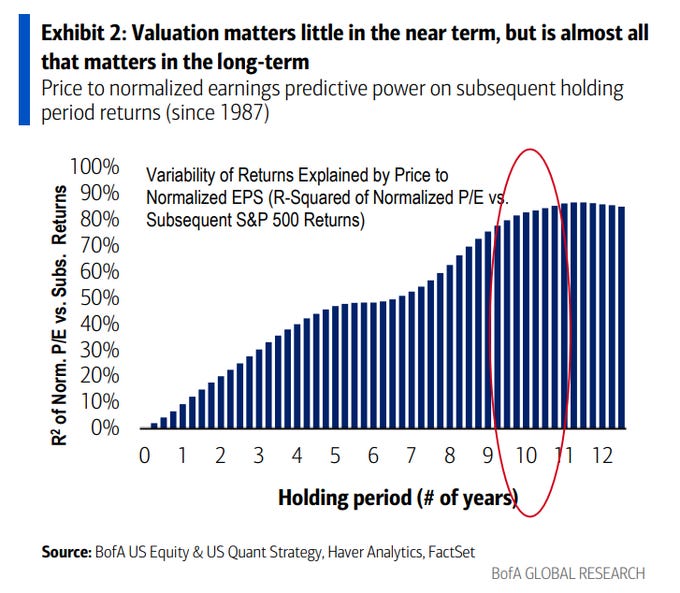
As BoA reminds us according to their work, valuation matters little in the near term, but is almost all that matters in the long-term.
And some analyst thoughts on valuations.
Breadth
Breadth a mixed bag but overall improved. That said, we’re back to growth stocks leading. My take is the more stocks going up the better.
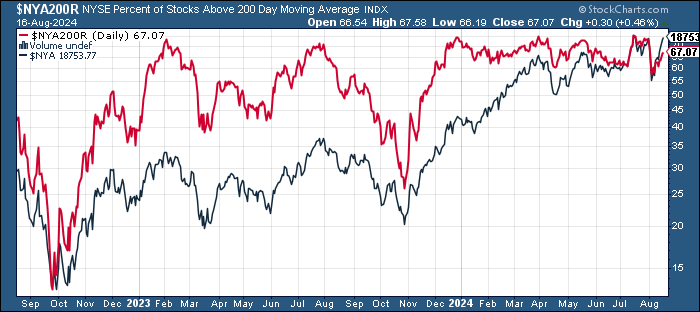
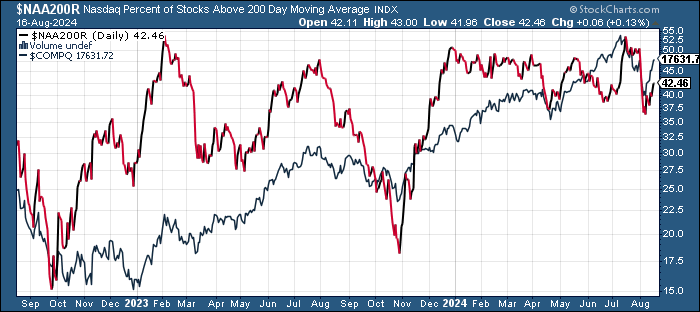
% of stocks over 200-DMAs after hitting at the lows (NYSE) or near the lows (Nasdaq) of the year the prior week, continued their bounce higher, although continuing to lag prices (although the Nasdaq fell further than prices).
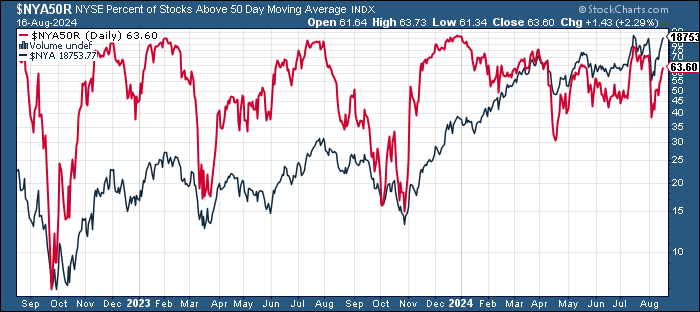
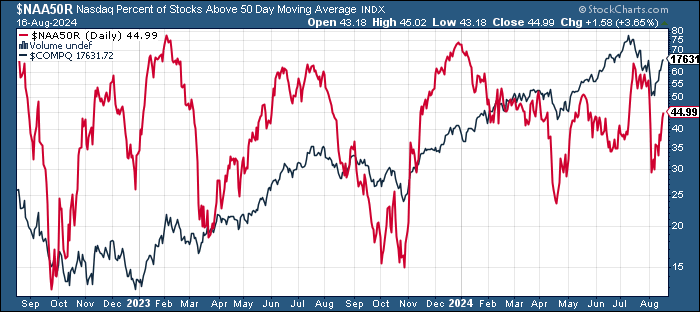
While % of stocks above 50-DMAs also continued their bounce following prices higher.
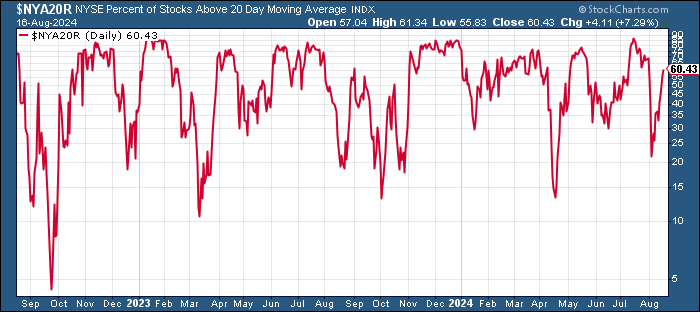
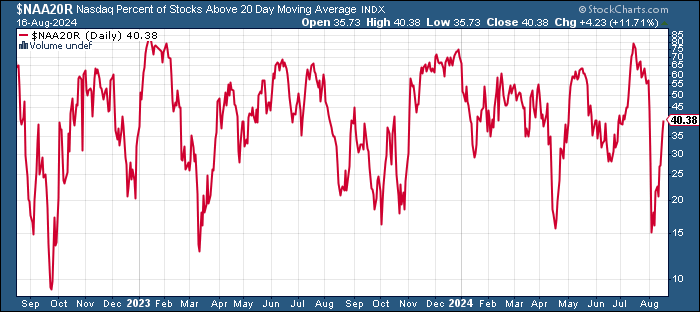
Same story for % of stocks above 20-DMAs with NYSE closer to recovering after not having fallen as far.
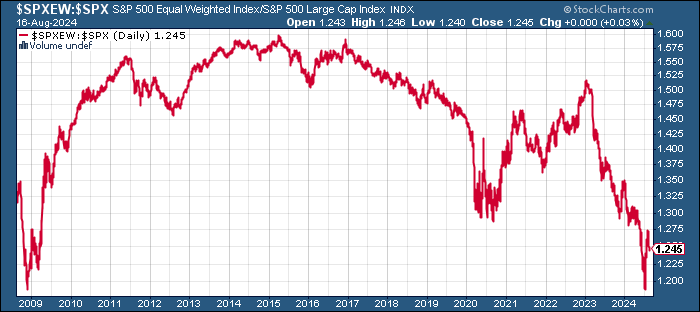
While the equal-weighted SPX vs cap weighted ratio falls back after hitting the best since May. It saw a little bigger bounce, but overall is following the pattern of 2009 where we saw a big retracement from the initial bounce before it embarked on a swift multi-year recovery.
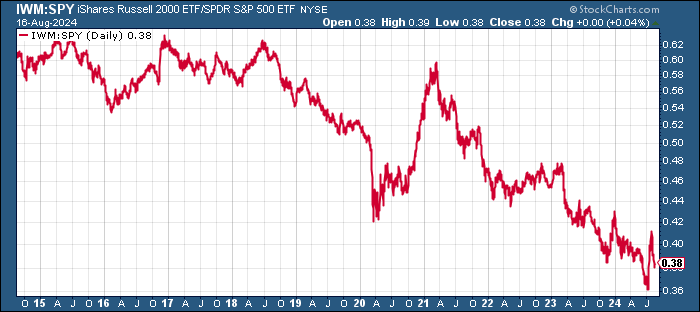
And IWM:SPY (small caps to large caps) ratio also continued to soften notably since hitting the highs of the year at the end of July.
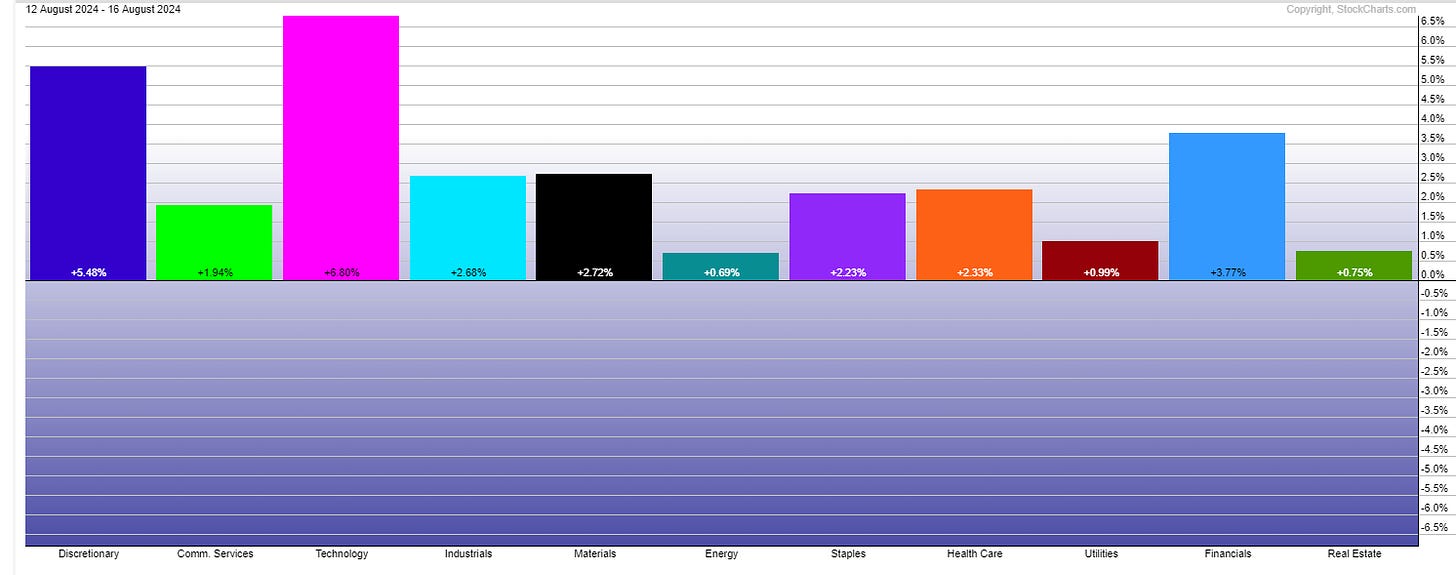
SPX sector breadth was very strong this week with every sector advancing at least 0.7% (even energy), but 8 were up around 2% or more (w/tech almost +7% & discretionary +5.5%.
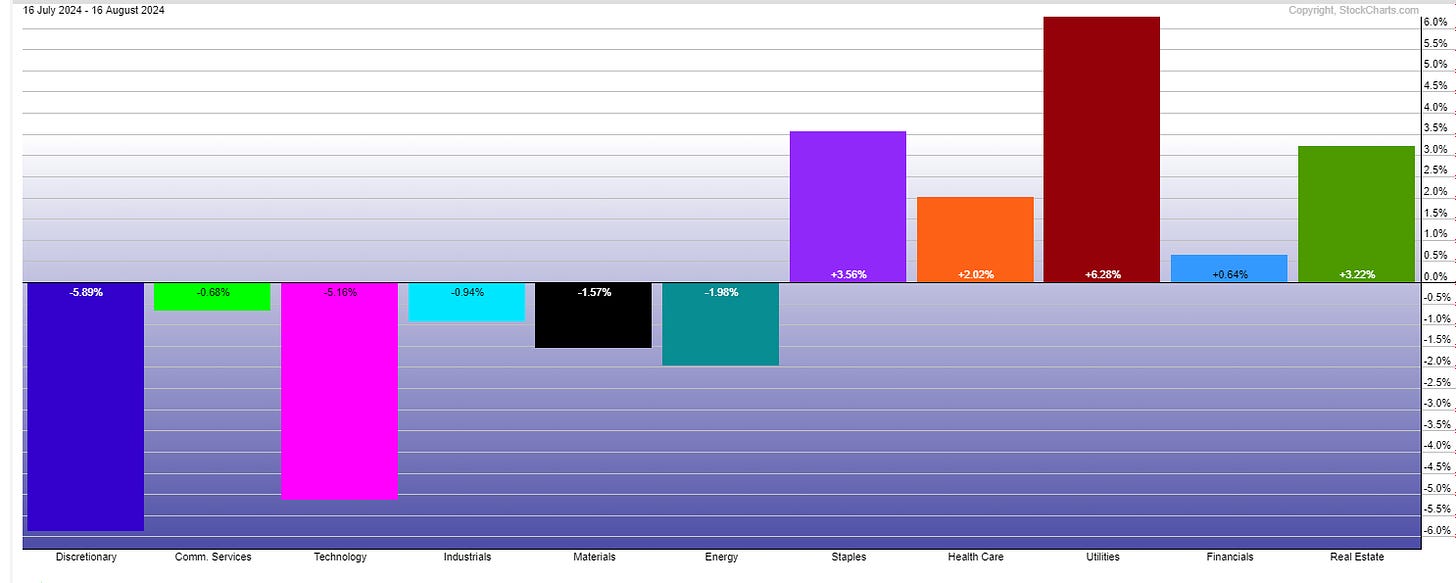
FWIW since the SPX peaked July 16th, five sectors are up with all of them relative yield plays led by utilities up over 6%. Staples & RE are up over 3%.
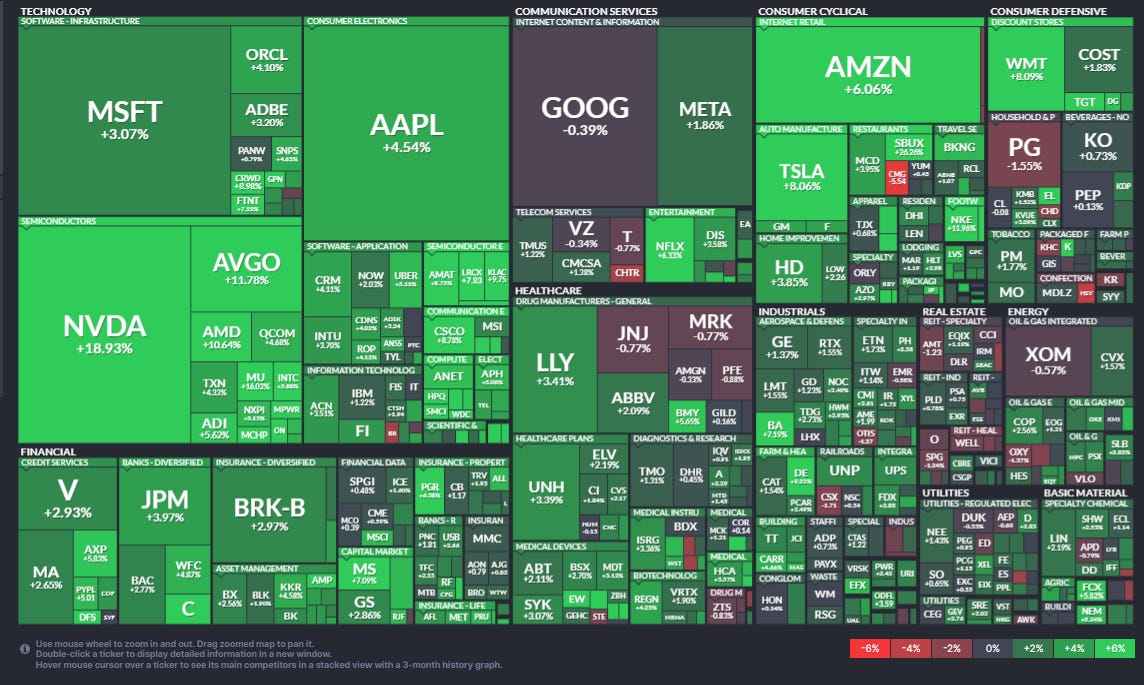
Last week's SPX stock-by-stock chart map from Finviz showed the broadness of last week’s advance. Only a handful of companies down more than 2% (CMG, HSY, CHTR were 3).
Other breadth stuff:
Flows/Positioning
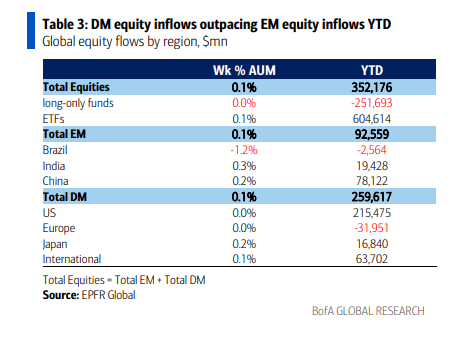
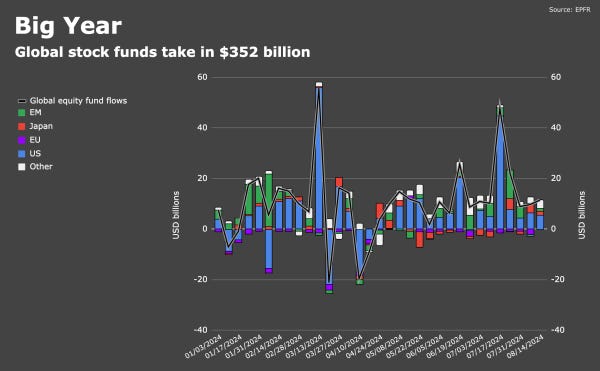
BofA using EPFR data in the week through Aug 15th saw global equity flows remain positive for a 17th week, +$11.5bn, the 35th inflow in the last 42 weeks, +$352bn YTD.
US 7th wk of inflows & 16th in 17wks, +$5.5bn, now ~+$154bn last 17 wks & +215bn YTD.
EM 11th wk of inflows, +$1.0bn, now +$90.6bn YTD, on pace for ~$143bn, as #China saw 12th week of inflows (+$0.7bn, +$33.4bn last 10wks), now +$78.1bn YTD, while #India +$0.3bn, now +$19.4bn YTD and easily on pace for record yr. EM took in +$91bn in 2023.
Japan 5th inflow in 6 wks +$1.6bn, now +$16.8bn YTD after +$7.3bn in 2023.
Europe an INFLOW(!) just the 1st in 13 wks (since May) & 4th in 75wks, but just +$0.1bn, after the largest outflow since Sep ‘23 the prior week, still -$32.0bn YTD after -$66.9bn in 2023.
US large caps 36th inflow in 44 wks (and 2nd straight) +$4.0bn, now ~+$260bn last 39 wks after +$125bn in all of 2023.
US value returned to inflows, 6th in 8 wks +$0.2bn (still ~-$32bn in 2024 after a record -$73bn in 2023).
US growth 6th outflow in 7wks -$0.7bn, now -$23.2bn last 7 wks but ~+$131bn YTD.
Small caps saw 2nd wk of outflows -$1.6bn, still +$9.6bn last 5 weeks and +$6.3bn YTD.
Sector specific flows were positive in EPFR data in the week through Aug 15th on the back of a 3rd week of big tech inflows:
Inflows:
Tech led inflows for 6th wk now coming through in equity performance +$3.0bn, now +$9.9bn last 3 wks, +$44.9bn last 32 weeks (and $70.6bn last 53 wks).
Utilities 5th wk of inflows +$0.2bn (+$1.9bn last 5 wks).
Real estate sees 3rd wk of inflows +$0.1bn, but still -$3.7bn last 18 weeks.
Financials returned to inflows, 9th in 12 wks +$0.6bn (now +$3.2bn last 10 wks).
Healthcare 2nd inflow in 8 wks +$0.3bn (still -$17.5bn last 45 weeks).
Outflows:
Materials 4th wk of outflows -$0.4bn (still +$3.0bn last 13 wks).
Energy led outflows -$0.5bn.
Consumer -$0.068bn (-$26.7bn last 43 weeks).
Commercial services -$0.092bn.
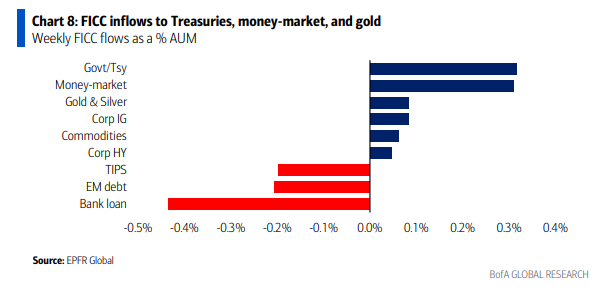
Looking at EPFR data in the week through Aug 15th for fixed income saw a 71st inflow in 72 weeks (and 3th straight) +$6.4bn, now ~+$389bn YTD (annualizing to $613bn):
IG/HG a 42nd consecutive week of inflows (& 68th in 71 wks) +$3.7bn, now ~+$254bn YTD, on track for a record $400bn in 2024 after +$162bn in 2023.
Treasuries 26th inflow in 28 wks (and 15th straight) +$3.9bn.
Munis the 27th inflow in 31 wks (and 7th straight) +$0.7bn.
HY returns to inflows, 6th in 8 wks (and 32nd in 41) +$0.3bn after the largest outflow since Oct, now +$40bn last 41 wks.
TIPS returns to outflows, 5th in 6 wks, 8th in 11 wks & 39th in 49, -$0.3bn, after the biggest inflow Apr ‘22. TIPS saw record outflows of -$33bn in 2023.
Bank loans a 3rd wk of outflows, longest streak since May ‘23, but just the 4th in 18 wks (and 5th in 25) -$0.5bn after the most since Mar ‘20 the prev wk now -$3.3bn last 3 wks).
EM debt 3rd wk of outflows after 3 wks of inflows, but the 39th in 52 wks, -$1.0bn, largest since May. EM debt saw -$37.0bn in outflows in 2023.
In week through Aug 15th, EPFR saw cash funds w/a 2nd wk of healthy inflows (+$27.5bn after +$80.8bn the prev wk) after a rare 2nd wk of outflows, now +$447bn YTD (annualizing to more modest but still very healthy +$704bn after a record $1.3T in 2023 and $3.3T since 2019 through the start of 2024).
Gold/Silver return to inflows, the 6th in 8 wks +$0.2bn, now +$6.4bn last 11 wks.
Crypto funds (#Bitcoin) also return to inflows, the 5th in 7 wks, +$0.2bn, +$7.0bn last 15 weeks.
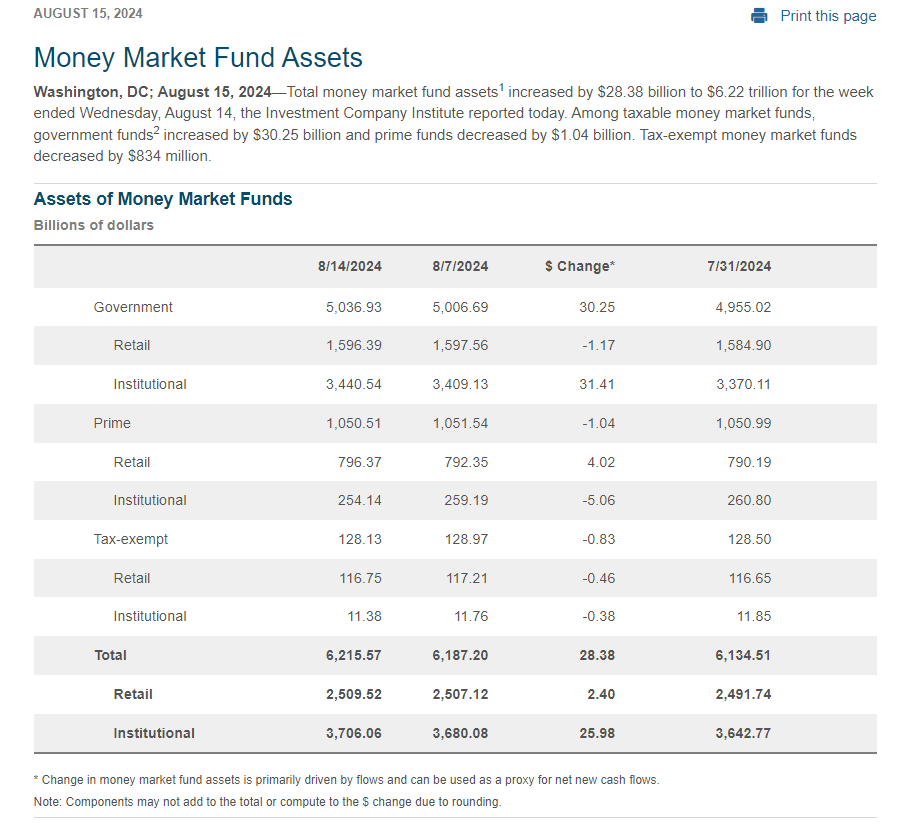
ICI data on money market flows saw a similar increase to EPFR at +$28.4bn in week through Aug 15th, pushing the YTD total in money market funds to ~+$322bn and the total MMF assets to a record high of $6.22tn.
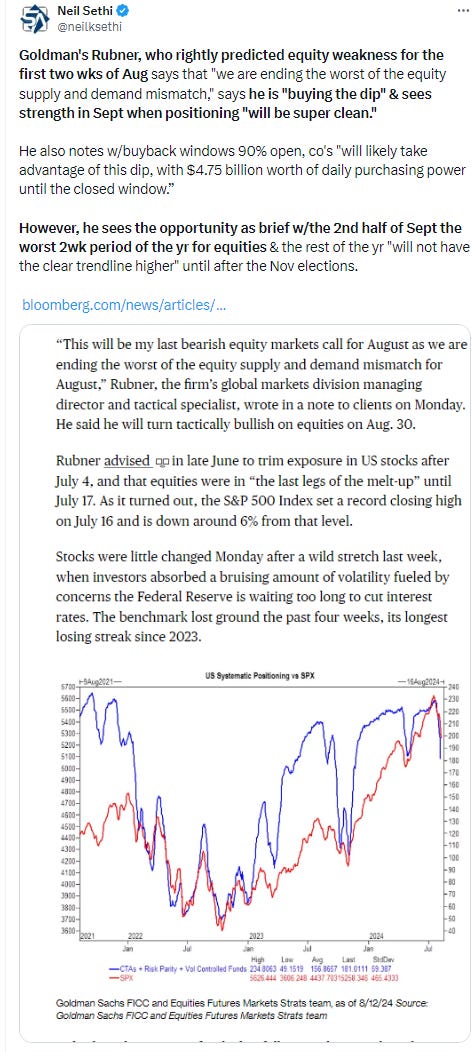
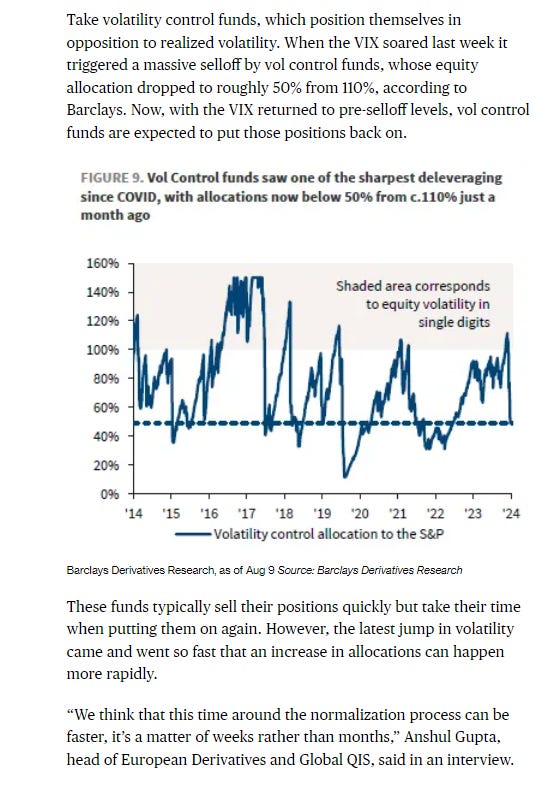
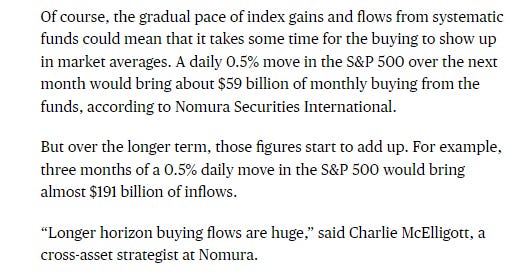
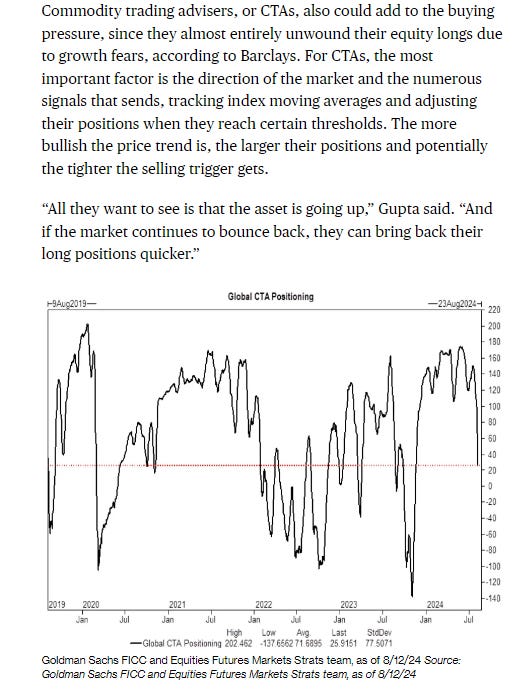
Looking at CTA (trend follower) flows, after we saw exposure go from 2yr highs to the lows of the year the past few weeks, I noted last week “it appears we’re at the point where selling may slow for the time being”. BoA confirms that was the case but says “despite the rally, our CTA model indicates that trend followers are likely closer to flat on equity index futures positions in the SPX & NDX. CTA buying is not expected in the upcoming week, but should the indices continue rallying then trend follower re-accumulation should eventually come alongside.”
Ex-US though the price trend remains negative so those are closer to shorts than longs. Trend strength for RUT though is stronger with the potential for more accumulation if prices can continue moving higher.
In terms of gamma positioning, BoA notes that after hitting the least this year, gamma “has grown rapidly and by Friday was long $9bn [from short -$0.5bn prev 2 wks]. The majority of the rise in gamma this past week occurred on Tuesday (+$3bn increase) and Thursday (+$6bn increase), both days which saw the S&P climb >1.6%. Over the past month our analysis suggests the impact of gamma on S&P realized vol was likely minimal, however if gamma (now elevated) stays near current levels the impact may grow.
The takeaway is the very strong positive gamma which dampened volatility in both directions for much of the summer, which flipped for 2 weeks to a small negative (meaning it was a mild accelerant in both directions)
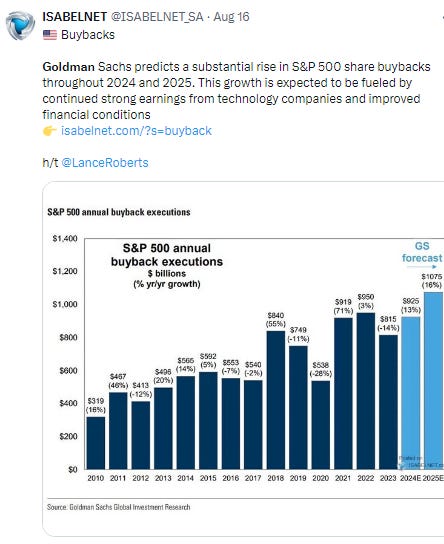
And now we’ve got 90% of the SPX with an open buyback window which Goldman says runs through Sept 6th.
Sentiment
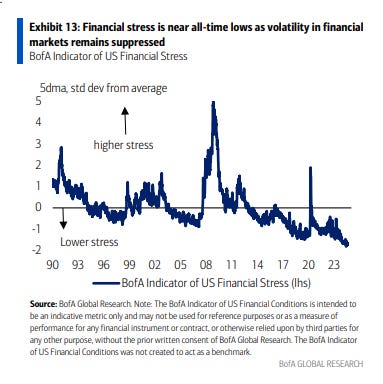
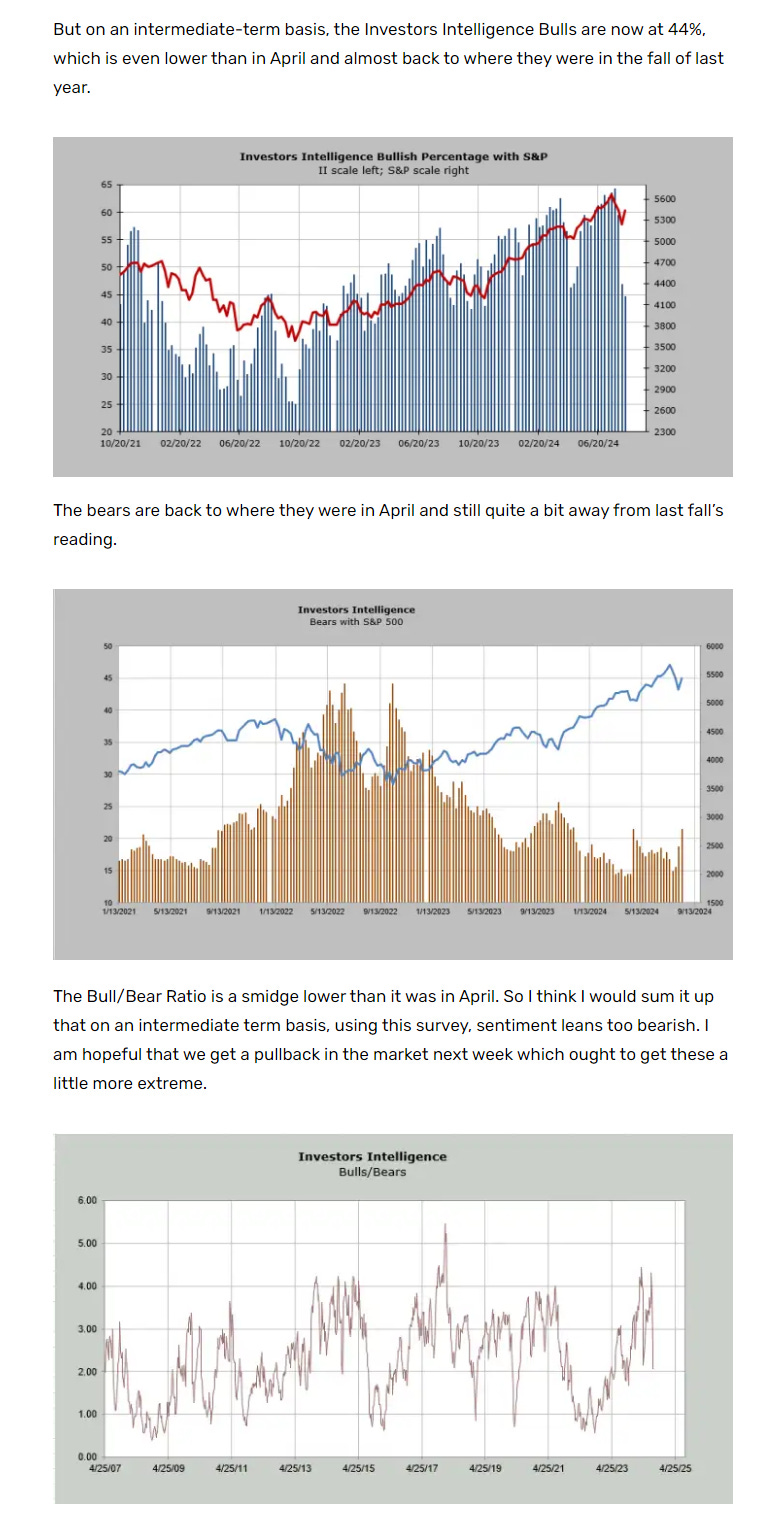
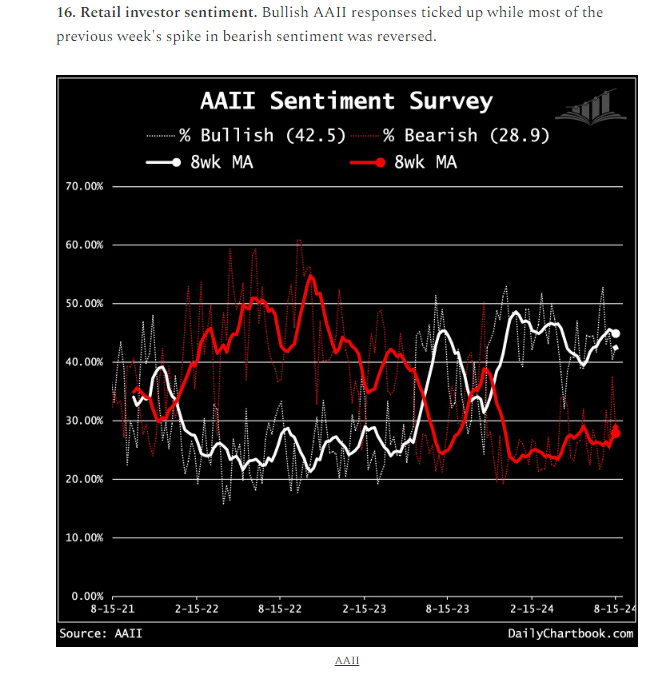
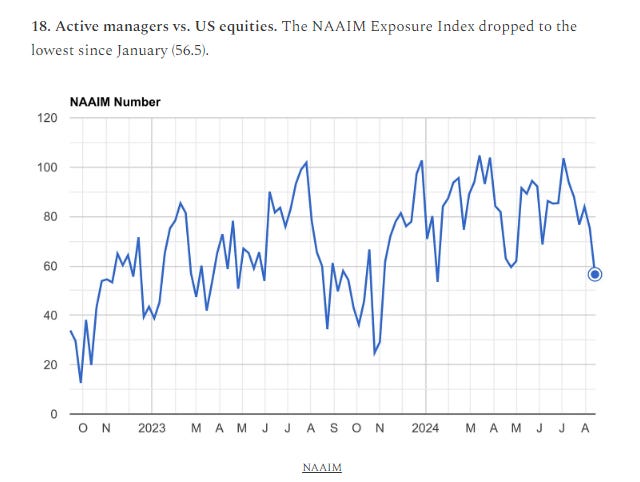
Sentiment (which I treat separately from positioning) is one of those things that really only matters at the extremes (and even then, like positioning, it really is typically helpful more at extreme lows vs extreme highs (“it takes bulls to have a bull market”). I noted five weeks ago we had moved into definite yellow light levels if not red light, and that was likely at least some factor in the ensuing pullback. With that pullback, though every indicator I track had softened as of last week, many considerably, but many if not most remained well off contrarian low levels, more consistent with people looking to “buy the dip” rather than flee the market altogether. This week was mixed with some softening further and some rebounding, but even those that deteriorated are still not washed out, and I’d imagine this will look very different next week. So for now sentiment at least for sure isn’t a headwind (i.e., too bullish).
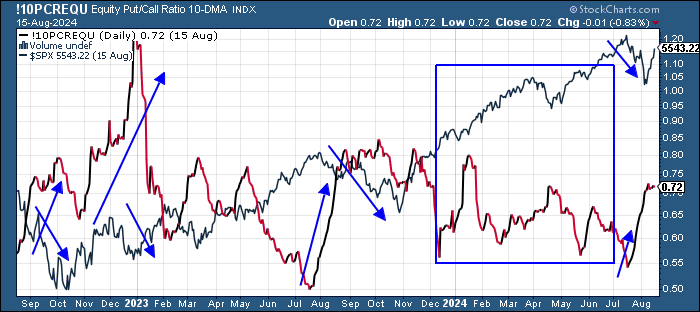
The 10-DMA of the equity put/call ratio (black/red line) continues to reflect higher concern, but is flattening out, not having even reached the highs of the year.
More sentiment indicators:
And as noted previously, I liked this description from Helene about how the sentiment process plays out in her view (seems like we’re getting to the last part of this?):
Now that we got a rally let me reiterate the way I typically see the process playing out. The market plunged. At first folks shrug and think, we’ve seen this before. Then we plunge a bit more and some of that complacency evaporates. Then we plunge a bit more and still more bullishness falls away. Then we get a little oversold and folks start looking for an oversold rally (see my post earlier this week). But we don’t rally immediately, and we get comments like I discussed yesterday—oh no, it’s an oversold market, and we’re not rallying; that’s bearish! Then we rally and the folks who got bearish should slowly turn bullish again.
I can already see it all around me, anecdotally. We finally rallied on Thursday, and now everyone is wondering if the low is in. Some folks who were screaming for an emergency rate cut on Monday have backed off of that too. I suspect if we rally some more, folks will soon forget they were ever bearish on Monday. That is typically when we see the market pull back again.
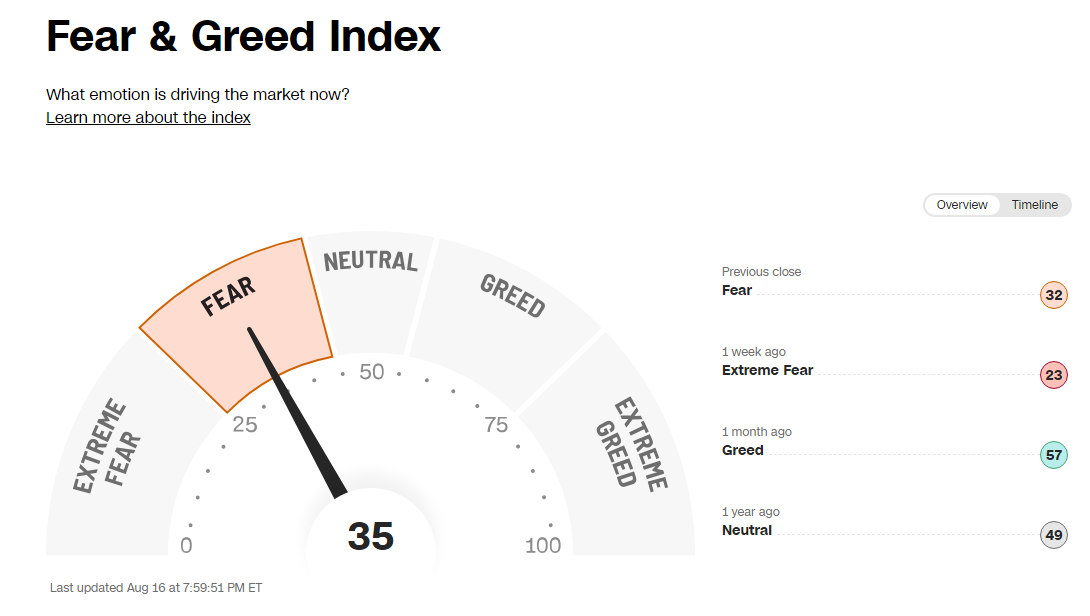
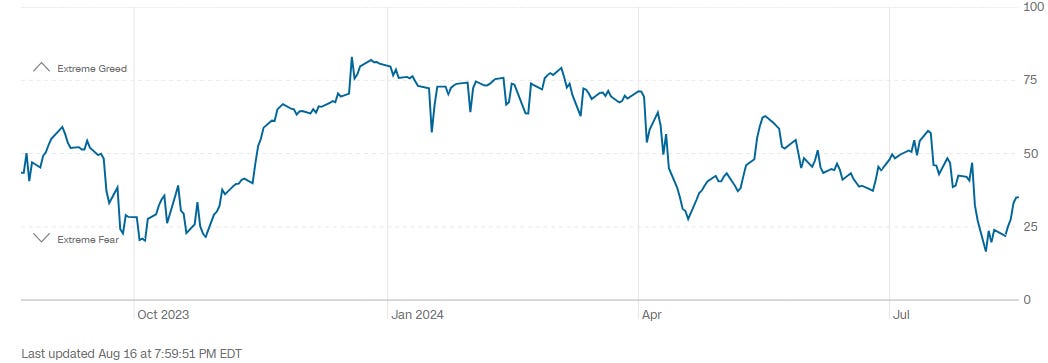
CNN Fear & Greed Index jumped to 35, up +9pts w/w (but up +18pts from the prior week low of 17, which had been the least since Oct ‘22 edging into Fear.
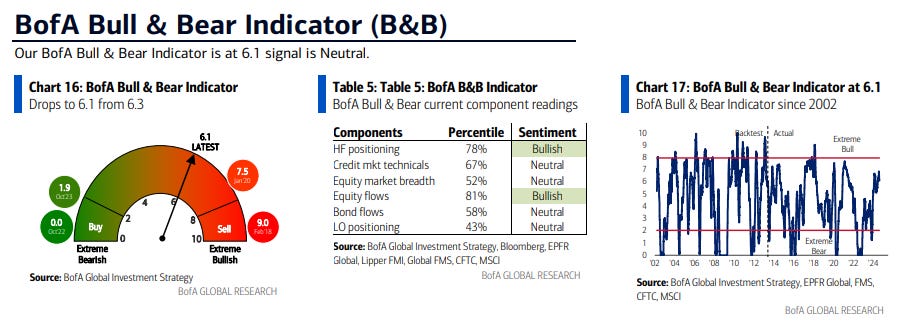
BofA Bull & Bear Indicator fell back for a 3rd wk to 6.1 from the highest since May ‘21 three weeks ago “on outflows from EM debt, credit technicals, and a cautious BofA August Global FMS (less OW stocks vs bonds & cyclicals vs defensive sectors).”
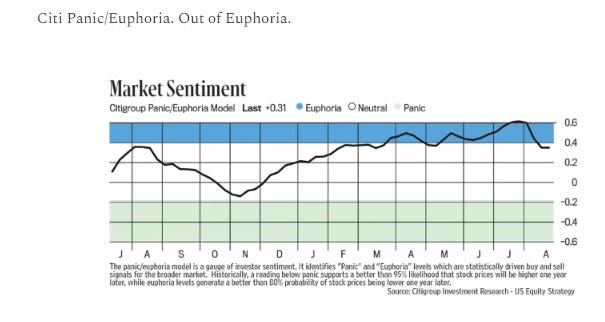
And the Citi Panic/Euphoria model eases now out of “Euphoria.” Still, it entered in later March, and according to the indicator “euphoria levels generate a better than 80% probability of stock prices being lower one year later.” We’ll see.
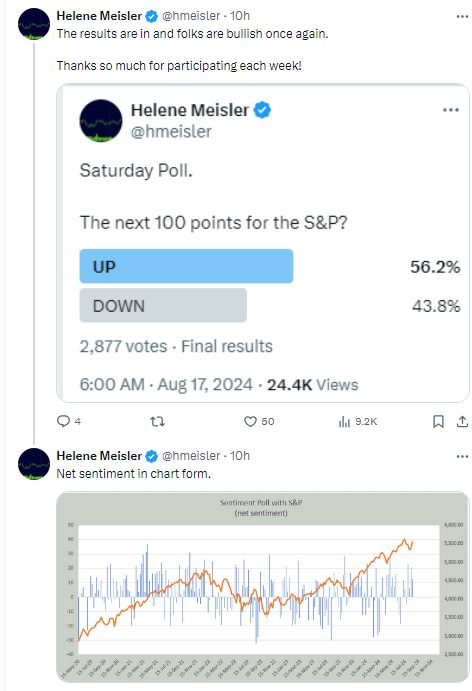
While Helene's followers remained bullish for the 7th week in 8 (and 4th wk straight) although a little less so than last week.
Seasonality
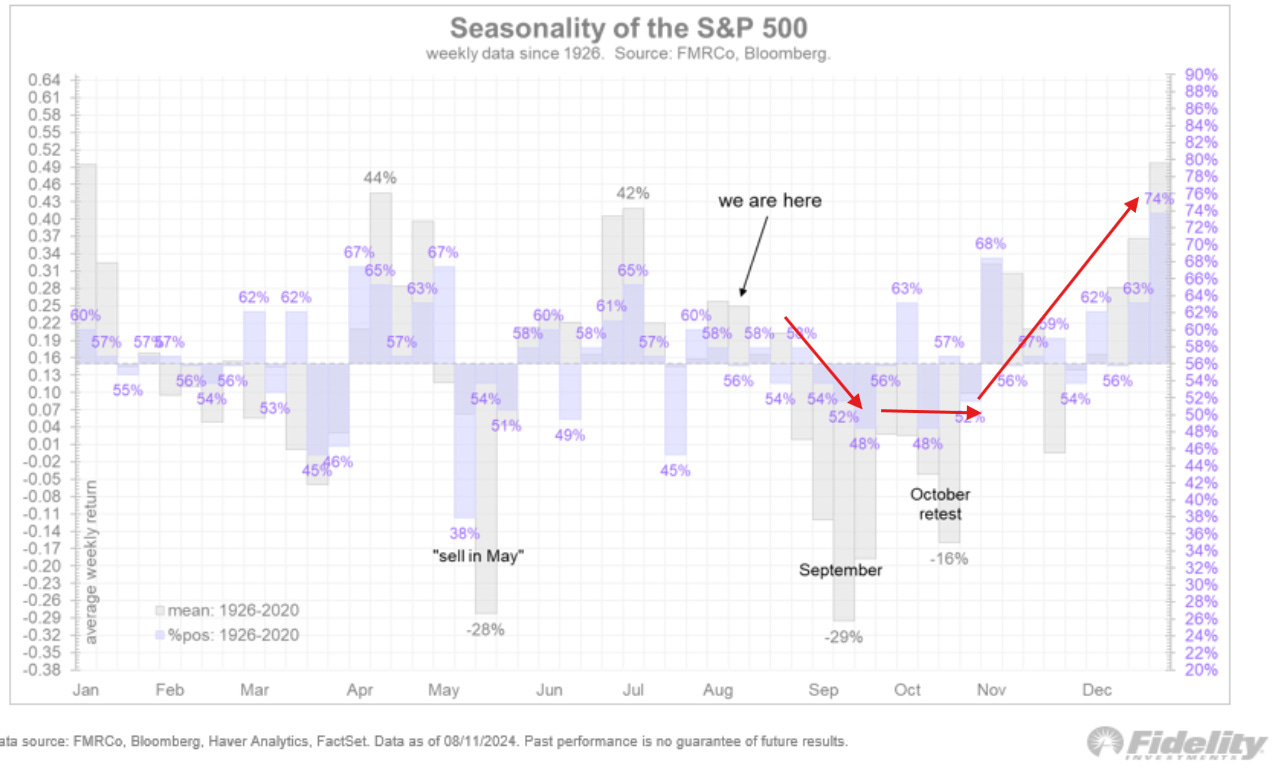
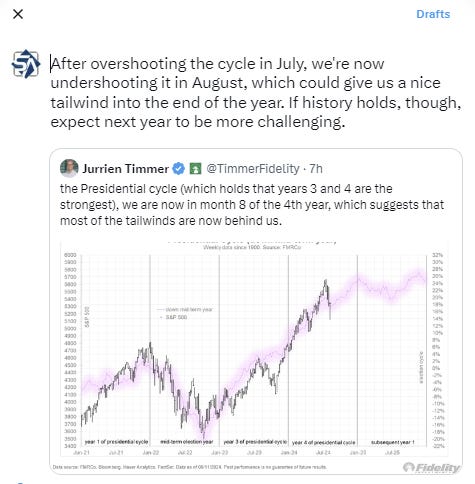
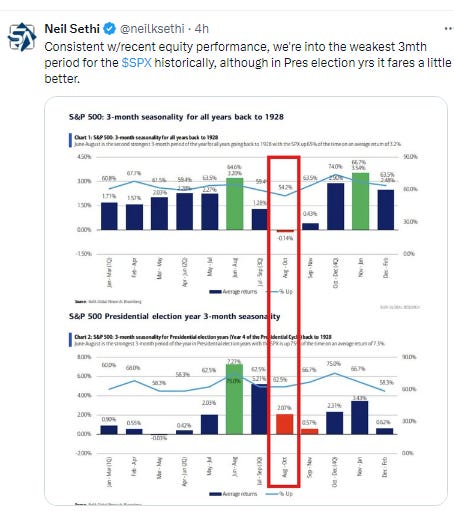
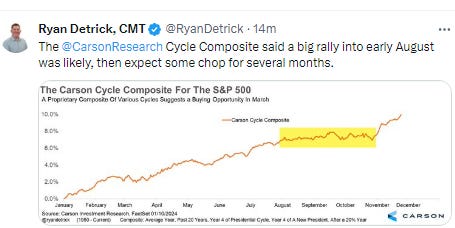
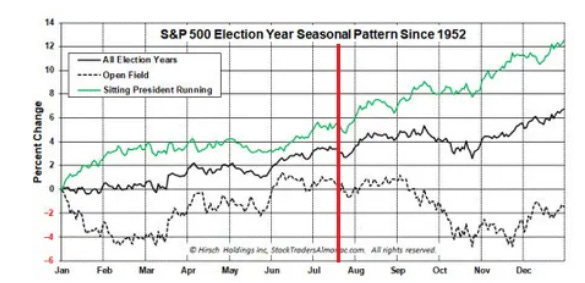
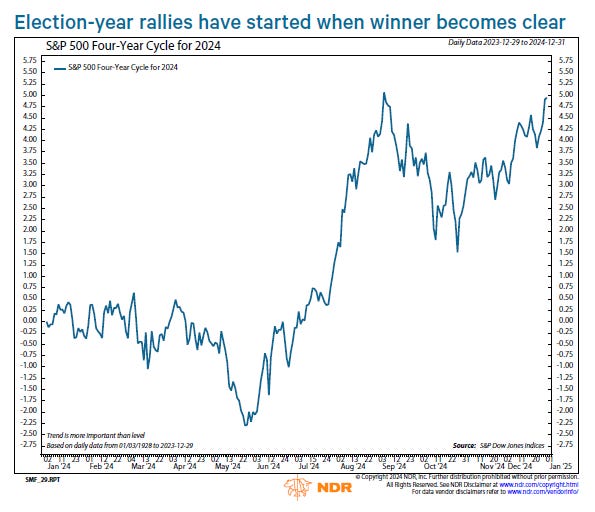
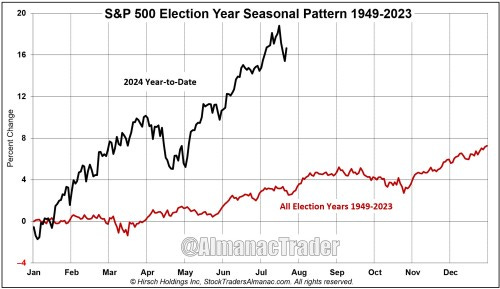
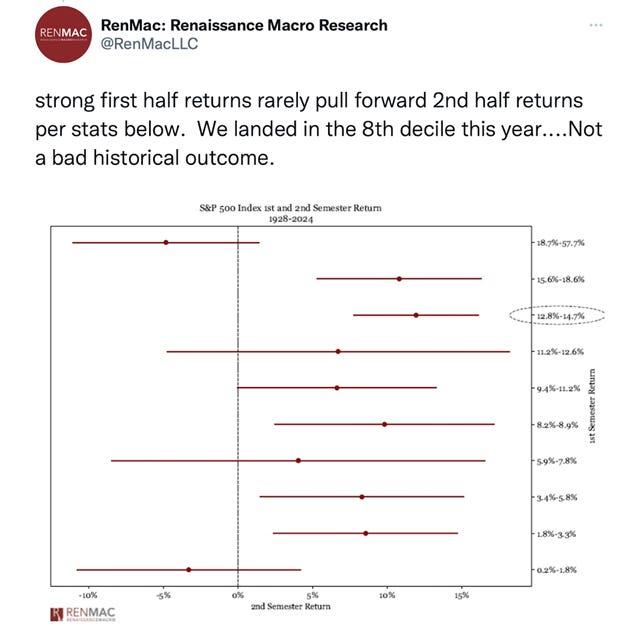
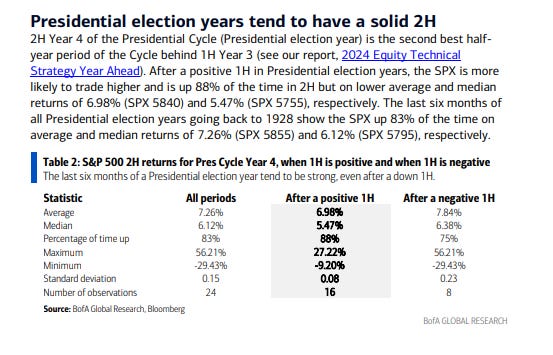
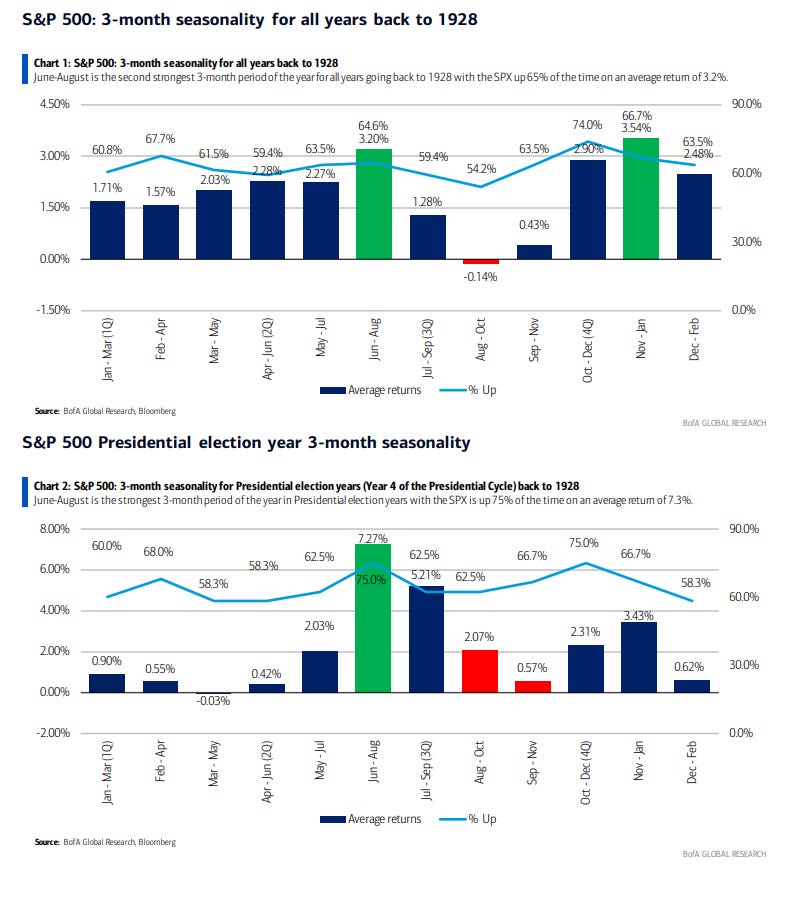
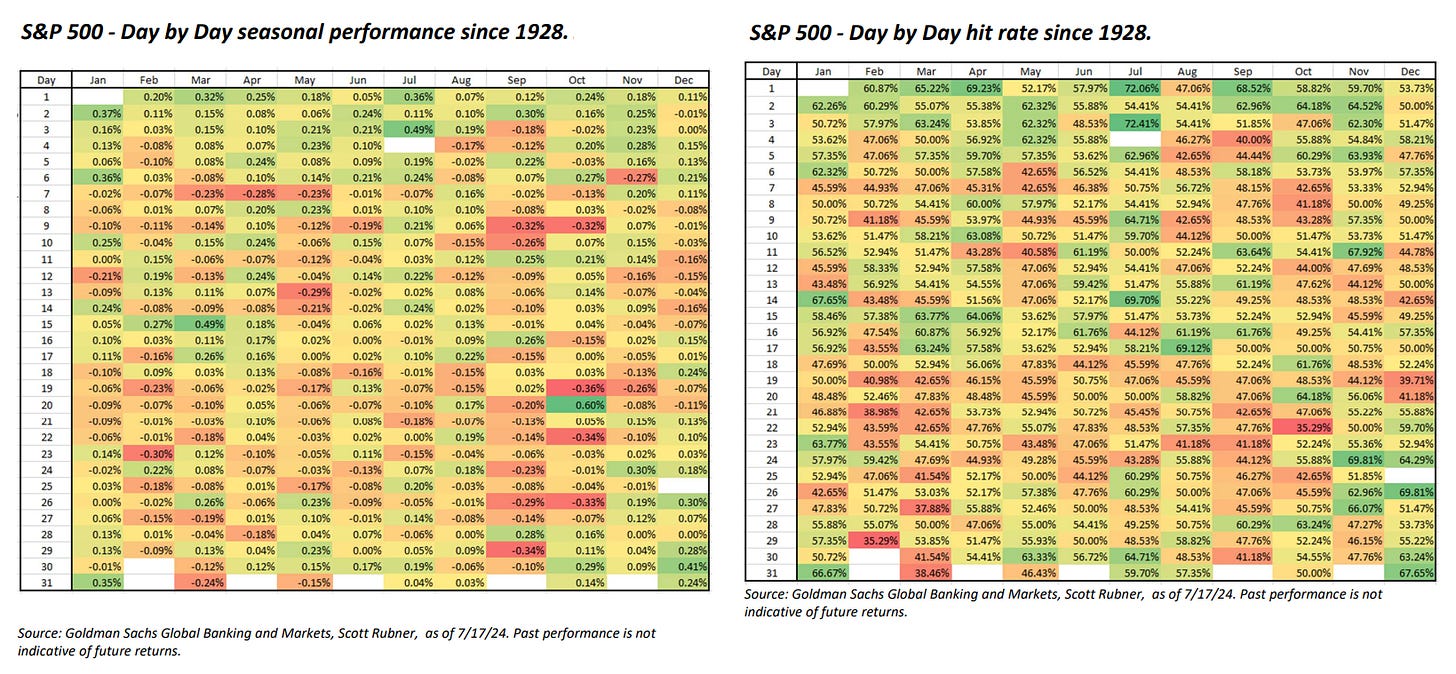
As noted in previous weeks while the May-Nov period is commonly thought of as seasonally weak ("Sell in May” and all that), in reality on average it sees positive returns and also is normally stronger in an election year (at least until around late July). I noted three weeks ago that as we were moving past late July, things were expected to get choppier into the election, and we definitely saw that. But we’re moving past the very weak first half of August into a brief period of stronger seasonality but things will deteriorate into the second half of September and won’t improve until after the election.
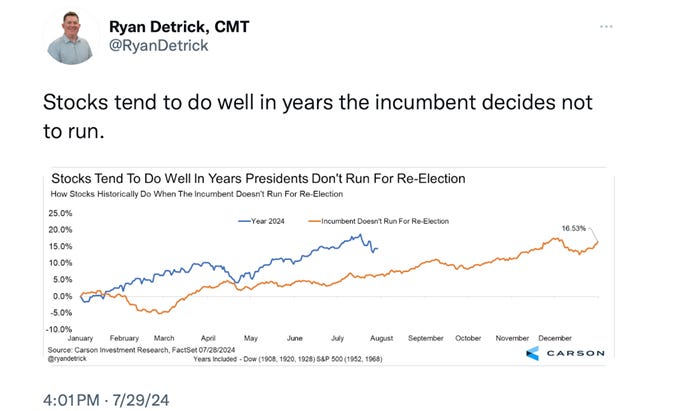
And now we have a new seasonality pattern to consider, an “open field” presidential contest, it's probably no surprise that returns are not nearly as healthy as when a sitting president running (as the incumbent doesn’t have as much interest in a buoyant stock market), but in this case given the very compressed timeframe and the incumbent “choosing” his successor, I think it would be a mistake to follow the open field historical pattern.
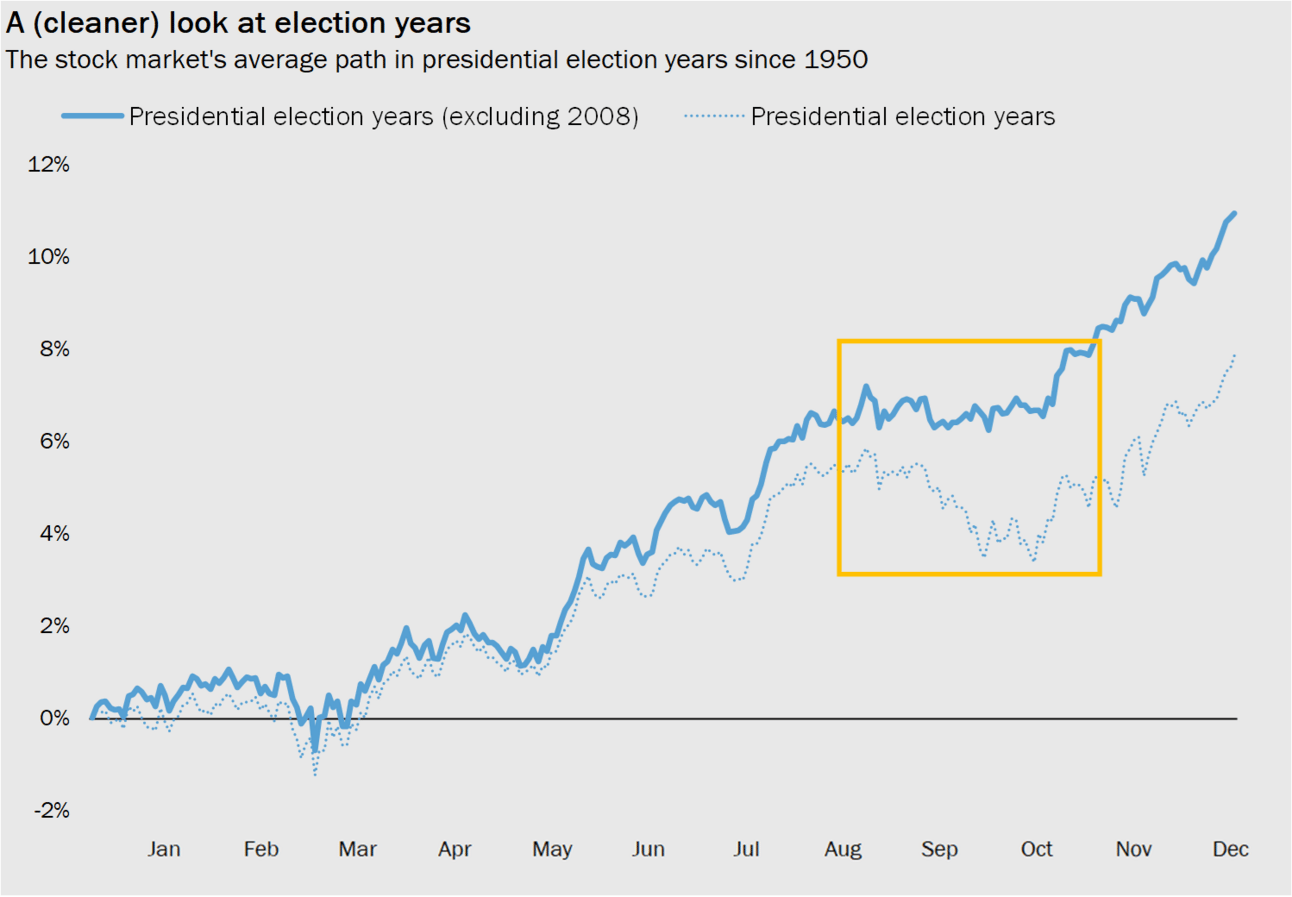
And as we consider seasonality, a really nice post from Callie Cox about how you need to take historical analogies w/a grain of salt (unless you've dug into the history). Her chart on Presidential election yr performance w/ & w/o 2008 (when the SPX was -17% in Oct) is a wonderful example.
https://www.optimisticallie.com/p/a-history-lesson
For references to all of the “up YTD through Feb” see the March 3rd post. For all the very positive stats through March (strong 1Q, strong two consec quarters, etc.) see the April 14h post.
For the “as January goes so goes the year”, see the February 4th Week Ahead.
Final Thoughts
As with the Fed section, a lot has happened the past few weeks, so if you want a reprise on “how we got here” you can reference last week’s post. Suffice to say we got the expected drop in markets when the combination of elevated sentiment, technicals, valuations (of larger caps), systematic positioning, etc., in mid-July ran into recession concerns and a carry trade unwind. But after the harsh selloff we got the also expected bounce. As I said last week,
this week brings a whole new set of catalysts in the form of economic data (and Fed speakers who may potentially push Fed cut expectations this way or that). Wednesday and Thursday will be pivotal days in setting the table for the rest of the month not only for equities but for bond yields and the dollar.
The good news is systematic and much investor positioning has been “cleaned out”, sentiment is much less frothy, technicals while weak may be bottoming, valuations have come down, the Fed remains in cutting mode (it’s just a question of when and by how much), election uncertainties have also come down (we know the candidates, we’re learning their positions, etc.), earnings while not great still saw solid growth, and the economy remains in decent shape even if slowing. So, consistent with my thinking since the start of the year, I continue to overall remain bullish, and I was definitely buying this week.
And that “whole new set of catalysts” was overall relatively benign, with as noted in the economic section mixed reports (but the two most watched (retail sales and jobless claims) coming in better than expected) which saw further undwinding of the recession trades and equities with their best weekly gains of the year. But unlike where we were in late July (when equities were last at these levels), systematic positioning, sentiment, technicals, etc., are all in much better shape, as are the chances for the start of the Fed’s cutting cycle. Earnings haven’t changed all that much (forward expectations are a little weaker but that’s not atypical), so there doesn’t seem a lot that is standing between the large cap indices and their former highs. Small caps have more work to do, but the situation is improving there as well. Seasonality is not the best, but it’s not terrible. So it feels like absent Powell “stepping on” the rally, as much as I thought we’d come back down to retest the lows from earlier this month, it doesn’t feel like it’s coming this week.
And as I’ve said all year:
Overall this feels like a bull market (the economy is growing, earnings are growing, the Fed is much more likely to be cutting than hiking as its next move, the technical picture and seasonality are strong overall for this year, balance sheets are solid, there’s lots of liquidity, and there’s lots of stocks other than the biggest ones that are performing well (the equal weight SPX hit a new ATH in March, etc.) [this last part has taken a step back with the heightened recession fears - to the extent those soften these will start to perform well]. So if/when we do get that sharp pullback I would think it will likely be an opportunity to buy (like most sharp pullbacks are), not a reason to run for the hills.
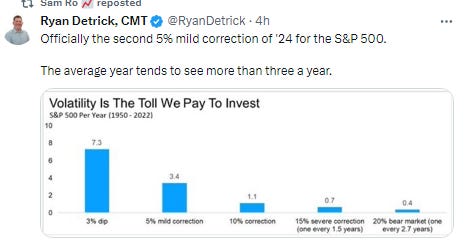
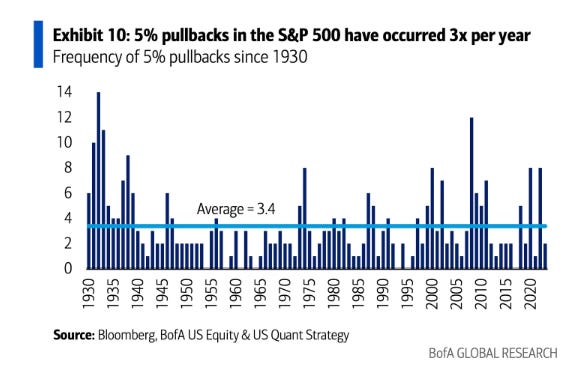
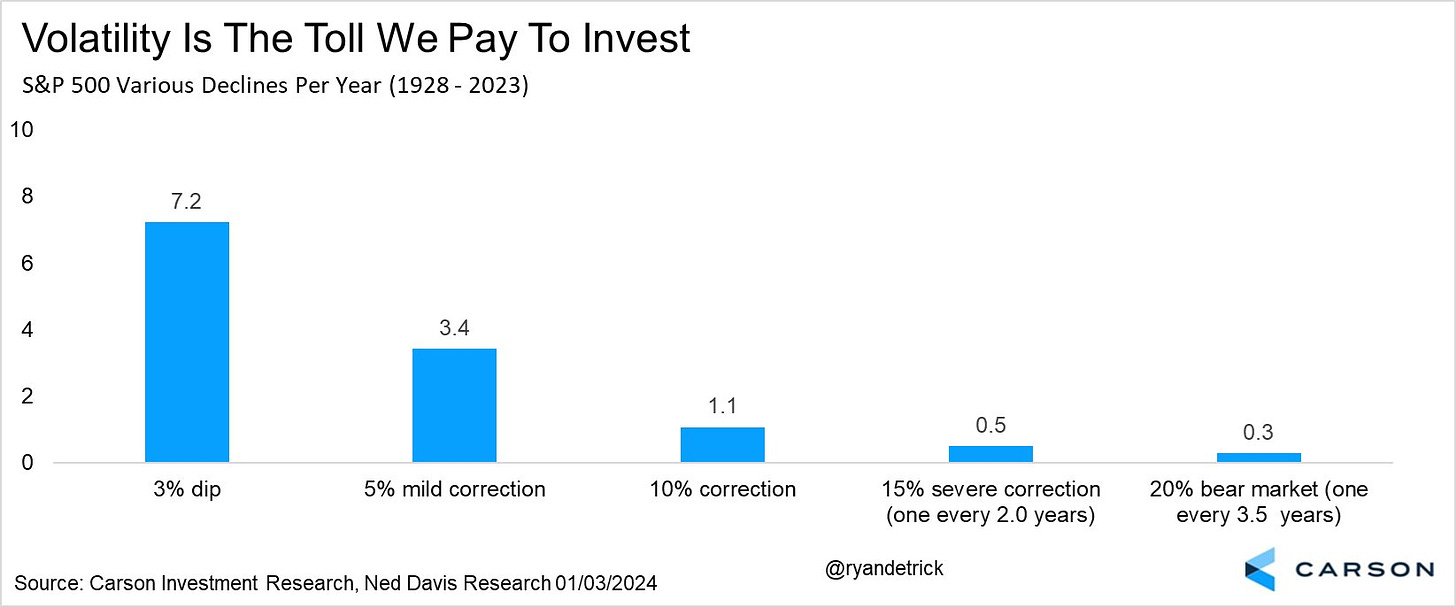
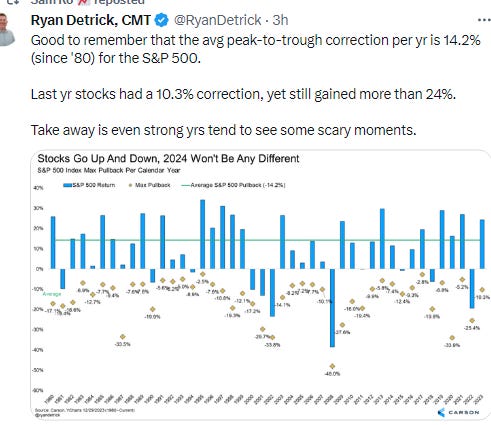
And as always just remember pullbacks/corrections are just part of the plan.
Portfolio Notes
Sold out of SBUX, DOCU, K, ZM, Trimmed VICI, LAZ, MDT, GOLD, CAL, VSS, E, SNOW.
Started new positions in SIRI, PHM, SOYB, added to ULTA. Also I forgot to mention last week I closed out those legacy shorts the last 2 weeks.
Cash = 10% (held mostly in SGOV and MINT but also TLH (if you exclude the longer duration bonds, cash is around 6%)).
Positions (after around the top 20 I don’t keep track of their order on a frequent basis as they’re all less than 0.5% of my portfolio).
Core positions (each 5% or more of portfolio total around 20%) Note the core of my portfolio is energy infrastructure, specifically petroleum focused pipelines (weighted towards MLP’s due to the tax advantages). If you want to know more about reasons to own pipeline companies here are a couple of starter articles, but I’m happy to answer questions or steer you in the right direction. https://finance.yahoo.com/news/pipeline-stocks-101-investor-guide-000940473.html; https://www.globalxetfs.com/energy-mlp-insights-u-s-midstream-pipelines-are-still-attractive-and-can-benefit-from-global-catalysts/)
EPD, ET, PAA
Secondary core positions (each at least 0.5% of portfolio, total around 8%)
ENB
For the rest I’ll split based on how I think about them (these are all less than 0.5% of the portfolio each)
High quality, high conviction (long term), roughly in order of sizing
, XOM, DIS, SHEL, CVS, CTRA, KHC, GOOGL, ADNT, T, PFE, TRP, BWA, SCHW, APA, ADNT, O, GSK, EQNR, BMY, CMCSA, GILD, TLH, TPR, MTB, DVN, OXY, RHHBY, STLA, NEM, NTR, E, ING, VZ, DAL, KMI, CI, AM, JWN, VSS, ARCC, CVX, AES, SQM, BAC, VNOM, PFF, TFC, MPLX, VOD, FSK, DAL, BAYRY, ING, HBAN, CCJ, BTI, FSK, RRC, FRT, VICI, DGS, WES, INDA, CURLF, MPLX, VWAPY, BMWYY, DDAIF, BUD, KEY, CVE, URNM, URA, SWN, SOFI, BEP, BIIB, SAN, OWL, TEF, SPG, KVUE, KT, ALB, F, VNM, WCC, MT, MFC, GPN, TD, LVMUY, SEE, LYG, NKE, AAPL, ADBE, ORCC, EMN, ZS, ON, NVDA, BCE, MDT, BAX, SNOW, SLB, RTX, LAZ, BX, HAS, NOC, CHDRY, WEC, SIG, MSM, PHM, TAP, EL, ABNB, MU
High quality, less conviction due to valuation
Higher risk due to business or sector issues; own due to depressed valuation or long term growth potential (secular tailwinds), but at this point I am looking to scale out of these names on strength. These are generally much smaller positions outside of the top few.
ILMN, AGNC, PARA, PYPL, URNM, WBA, URA, YUMC, STWD, CFG, FXI, ORAN, KSS, CHWY, TIGO, ACCO, KVUE, KLG RMD, CLB, HBI, IBIT, UNG, TCNNF, TCEHY, EEMV, PK, VNM, SABR, NSANY, VNQI, VALE, SBH, ST, WBD, LADR, BNS, EWS, , IJS, NOK, SIL, WVFC, VTRS, NYCB, ABEV, TPIC, PEAK, SEE, LBTYK, RBGLY, LAC, CMP, CZR, BBWI, LAC, CAL, EWZ, CPER, MBUU, TLRY, HRTX, MSOS, SIRI, SOYB
Note: CQP, EPD, ET, MMP, MPLX, PAA, WES all issue K-1s (PAGP is the same as PAA but with a 1099).
Reminder: I am generally a long term investor (12+ month horizon) but about 20% of my portfolio is more short term oriented (just looking for a retracement of a big move for example). This is probably a little more given the current environment. I do like to get paid while I wait though so I am a sucker for a good well supported dividend. I also supplement that with selling calls and puts. When I sell a stock, I almost always use a 1-2% trailstop. If you don’t know what that is, you can look it up on investopedia. But that allows me to continue to participate in a move if it just keeps going. Sometimes those don’t sell for days. When I sell calls or puts I go out 30-60 days and look to buy back at half price. Rather than monitor them I just put in a GTC order at the half price mark.
To subscribe to these summaries, click below (it’s free).
To invite others to check it out,


