


The Week Ahead - 9/8/24
A comprehensive look at the upcoming week for US economics, equities and fixed income

If you're a new reader or maybe one who doesn’t make it to the end feel free to take a second to subscribe now. It’s free!
Or please take a moment to invite others who might be interested to check it out.
Also please note that I do often add to or tweak items after first publishing, so it’s always safest to read it from the website where it will have any updates.
As a reminder, some things I leave in from prior weeks. Anything not updated is in italics. As always apologize for typos, as there’s a lot here, and I don’t really have time to do a real double-check.
The Week Ahead
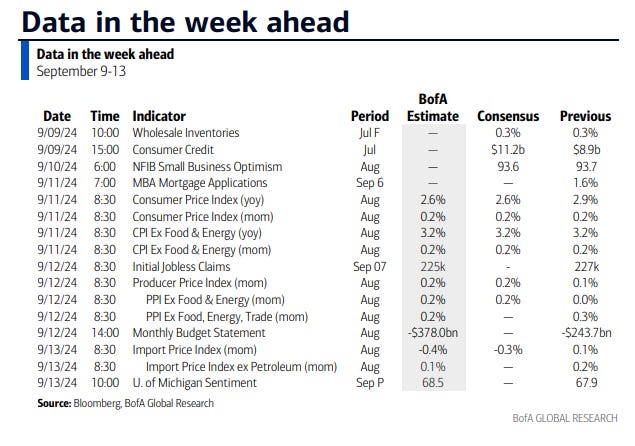
After a packed week of US economic data, things are a bit less hectic in the upcoming week, but it’s far from an empty calendar. The highlight is definitely the Aug CPI report on Wed. While it doesn’t have quite the market moving potential it did earlier in the year (as evidenced by options expecting the smallest CPI-day move this yr for the SPX), with the NFP on Friday inconclusive as I wrote in Friday’s update, there is the potential for a cool print to tip the scales to a 50bps cut.
That’s not my base case as the market isn’t pricing that in, and Powell has not generally been one to deviate from market expectations, going so far as to tip to the markets (via a Timiraos article or similar) what was coming, but I guess he did start off the hiking cycle with a surprise 75bps hike so maybe he starts off the cutting cycle with a surprise 50bps cut, we’ll see. But what CPI will certainly have an impact on is the dot plot which is arguably the most important thing we’ll get from the FOMC as I’ll discuss next week.
We’ll also get PPI and import prices (which combined with CPI will give us a good guess at PCE prices which comes at the end of the month), NFIB small biz sentiment, the NY Fed’s consumer sentiment and inflation expectations, July consumer credit, and U of Mich’s preliminary Sept consumer sentiment and inflation expectations.
FOMC speakers will be on the very light side given they are in their blackout period (so any messaging would likely come through the WSJ's Nick Timiraos (e.g., "Fed Whisperer")).
Treasury auctions will though be heavier as we get our monthly 3, 10 & 30yr auctions (the latter two actually reopening’s, but functionally equivalent) on Tues, Wed & Thurs ($58bn, $39bn & $22bn).
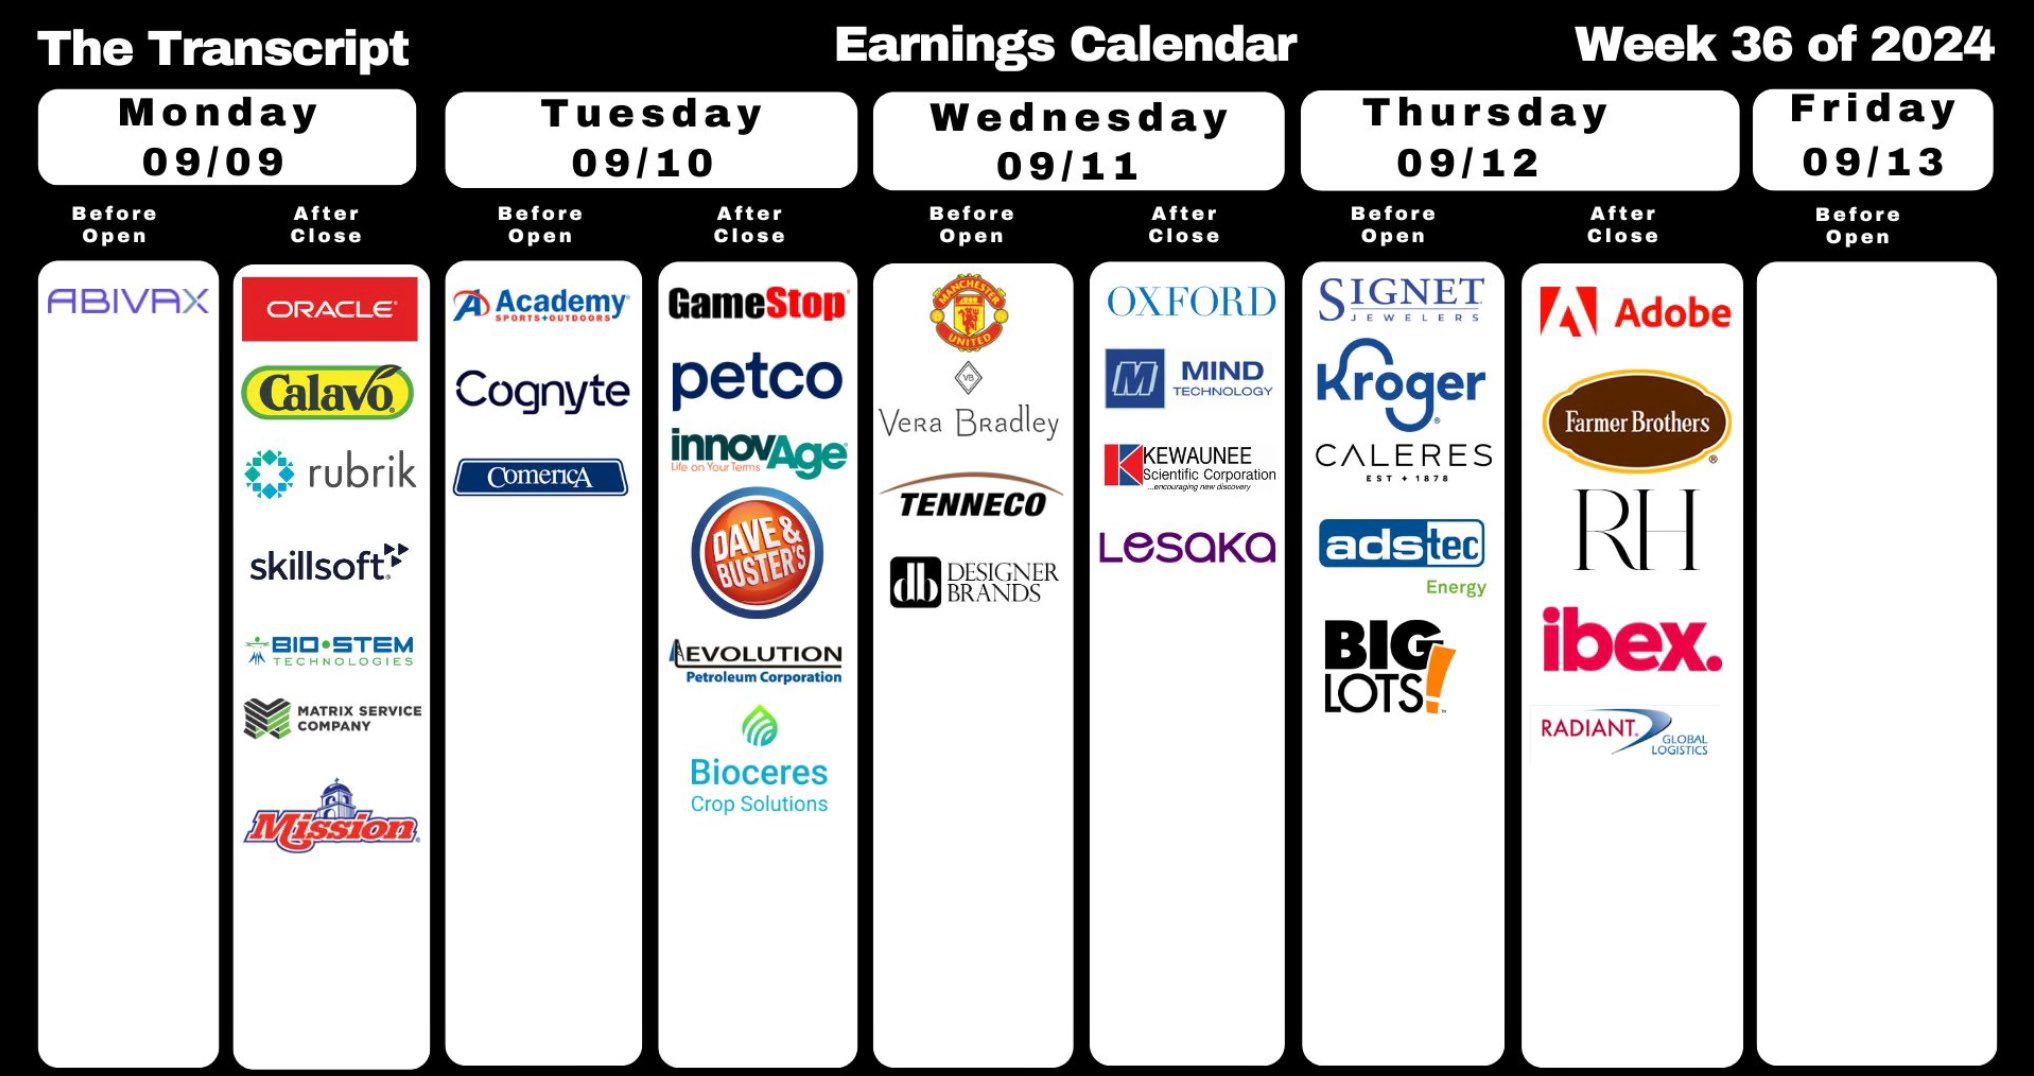
As noted last week, earnings will will continue to come in at a modest pace until we get to the unofficial kickoff to 3Q season Oct 7th w/the big bank earnings. Again this week we’ve got just 3 SPX co’s reporting w/two>$100bn market cap (Oracle & Adobe). The other SPX company is Kroger.
And, of course, we’ll have the Presidential debate Tuesday night, which as we’ve seen just this year can have a material impact on the Presidential race (which of course feeds through to markets). One thing's almost a certainty: The second presidential debate will be livelier than the first, muted mics or not.

From Seeking Alpha (links are to their website):
Earnings spotlight: Monday, September 9 - Oracle (ORCL) and Rubrik (RBRK).
Earnings spotlight: Tuesday, September 10 - GameStop (GME), Academy Sports and Outdoors (ASO), and Dave & Buster's Entertainment (PLAY).
Earnings spotlight: Wednesday, September 11 - Manchester United (MANU), Oxford Industries (OXM), and Designer Brands (DBI).
Earnings spotlight: Thursday, September 12 - Adobe (ADBE), Kroger (KR), RH (RH), and Signet Jewelers (SIG). See the full earnings calendar.


Ex-US the highlight is the ECB meeting where the broad expectation is for a 2nd cut to the policy rate, meaning the drama will be more on the statement and press conference in terms of telegraphing the pace of further cuts. Expectations are that they will be coy about when the next cut may be coming. Inflation data from China, India, Norway, Sweden, Mexico, Brazil, and Argentina (among others), UK wage numbers and rate decisions from Pakistan to Peru are among other highlights.

China is front and center, beginning with data Monday that’s expected to highlight the ongoing fragility of domestic demand. Consumer inflation is seen picking up just a bit, to what would still be an anemic 0.7% pace, while declines in factory-gate prices are forecast to deepen.
Data at the end of the week may add to the gloom, with growth in industrial output, retail sales and fixed asset investment all likely to have moderated in August, while property investment is seen falling at a double-digit clip for a fourth straight month. Elsewhere, Japan’s economic rebound in the second quarter may be revised a tad higher after solid capital investment data for the period are factored in. India’s August inflation data on Thursday could tip the Reserve Bank of India toward an October rate cut, according to Bloomberg Economics, which expects price growth to slow for a second month. Trade numbers are due during the week from China, India, Taiwan and the Philippines, and Australia gets gauges for consumer and business confidence on Tuesday. On the monetary front, Pakistan’s central bank is expected to cut its benchmark rate on Thursday for a third straight meeting. Its counterpart in Uzbekistan also decides policy that day.
UK data may draw the attention of investors. Wage numbers on Tuesday are likely to show weaker pay pressures, though the annual pace of increase still remains more than double the Bank of England’s 2% inflation target. Monthly gross domestic product on Wednesday is expected by economists to show a modest increase in July, pointing to a lukewarm start to the third quarter. And the BOE will release its latest inflation expectations survey on Friday. Turning to the euro zone, industrial production numbers in Italy, Spain and the region as a whole will also point to the condition of the economy there as it began the second half of the year. Based on the performance of Germany and France, in data released on Friday, it’s likely the wider economy was on a weaker footing. In Germany itself, Finance Minister Christian Lindner will present the country’s 2025 budget to parliament on Tuesday, followed by remarks the next day by Chancellor Olaf Scholz and other government ministers. Elsewhere on the continent, inflation numbers in Norway and the Czech Republic on Tuesday, and in Sweden on Thursday, will be watched closely as central bank policymakers assess the lingering strength of price pressures. Aside from the ECB, a couple of other rate decisions are scheduled:
On Thursday, the National Bank of Serbia may leave its rate at 6% after inflation rose in July for the first time in more than a year.
The following day, attention will focus on whether the Bank of Russia continues tightening after hiking borrowing costs by 200 basis points in July. Data on Wednesday may show inflation there has passed an annual peak.
Finally, the International Monetary Fund is due to complete a review of Ukraine’s economy and finances in the coming week, and will announce whether the lender’s board should approve the next slice of a $15.6 billion loan for the war-torn country.
Latin America’s three largest economies will report August consumer price data as the region’s central bankers recalibrate their monetary policy. On Monday, Mexico’s national statistics institute will likely report that inflation eased to 5.05% from 5.57% the month prior. The nation’s cost of living has been propelled by soaring prices of services, fruits and vegetables in recent months. Still, the expected slowdown now will give the central bank more room to consider another rate cut later this month to bolster a weak economy. The next day, Brazil is expected to report that inflation fell back from the 4.5% ceiling of the central bank’s tolerance range. Any decline stands to provide limited relief; policymakers face pressure to lift borrowing costs in September due to price risks including increased public spending, robust economic growth, and a depreciated currency. Finally, Argentina will release its data on Wednesday as President Javier Milei’s administration touts progress in efforts to tame the cost of living. Monthly price increases have indeed waned from 25.5% in December — when Milei’s government took office — to 4% in July. Annual inflation is still well above 200%.
And here’s BoA’s cheat sheets for the upcoming week.


And here’s a calendar of 2024 major central bank meetings.

Market Drivers
So let’s go through the list of items that I think are most important to the direction of equity markets:
Fed/Bonds
As noted previously this was one of the sections that had grown unwieldy, so I’ve really pared it down. Given I provide daily updates on Fed expectations, Fedspeak, and analyst thoughts on the Fed, it’s duplicative (and time consuming) to gather it all again so, again, I encourage you to look at those (the daily posts) for updates. I will just give more of a quick summary.
I noted two weeks ago,
while Powell didn’t exactly provide a roadmap he went beyond “setting the stage,” and in no uncertain terms announced the Fed had pivoted to a rate cutting cycle with the focus now squarely on employment and less so on inflation absent a dramatic reacceleration in the latter as Powell said in no uncertain terms that he would “not seek or welcome further cooling in labor market conditions.” This puts the onus squarely on the payrolls reports to set the stage for the path of rate cuts (again, absent an unexpected resurgence in inflation).
As of now a 25bps cut seems locked in absent a very bad August employment report (which might see a 50bps cut) or an extremely bad August CPI report (which might see them wait until November). I continue though to think the markets are a bit ahead of themselves with 100bps of cuts through YE and 210bps of cuts through Sep ‘25. It could happen if we do see a material weakening in the labor market, but aside from that I would fade that many cuts. I think we see 50-75 this year (November is a toss up at this point) and more like 125-175 through Sep ‘25. But that’s a long ways away, and there’s a lot of data between no and then.
And as noted in the Friday update, we got neither a strong nor weak employment report (I described it as a Rorscach test where you saw what you wanted to see) which left the chance of a 50bps Sept cut at the same 30% but also saw more cuts overall priced in (meaning a higher chance of a 50bps in Nov or Dec). I think that remains about right. I do think there’s some scope still for a 50bps if Powell has it in his mind he wants to get moving given the restrictiveness of rates he’s always talking about, but if that was going to be the case I think there would have been a better signal this week as right now the markets would be surprised by 50bps. That’s not how Powell operates. I think if/when a 50bps cut is coming it will be telegraphed. It’s way too early to make any comments about Nov or Dec, so we’ll see how things unfold as we get to that point.
I should also note though that there are also now 224bps of cuts priced through the Sep ‘25 meeting, which I think is very aggressive even if we see further weakening in labor markets. That type of cutting would require definitive recession indicators which we simply do not have currently. So, again, I think we’re basically set for a 25bps cut a week from Wednesday unless we were to see a very cool CPI report (and even then I don’t know we’d get 50).
As a reminder, my thinking at the beginning of the year was that this a Fed that wanted to cut they just needed the data to cooperate, which it has for the most part since the start of 2Q. As I said three months ago “at this point a hike has basically become a zero probability proposition, it’s just a matter of when the Fed decides it’s time for the first cut (which now seems to be September) and really the bigger question is what the pace of cuts is thereafter”:
What also seems fairly clear, consistent with what I’ve been saying all year, is that this is a Fed that overall wants to cut and achieve the rare “soft landing”, doesn’t want to hike (for that reason), but also doesn’t want to make a mistake. In that scenario, the “right” course of action is to just do nothing until 1) the data gives the all clear to cut (which as Powell made clear can either be cooler inflation prints or a marked softening in the labor market) or 2) the data absolutely forces a hike. So things remain very much one-sided in terms of the hike/cut balance. A cut is far more likely, it’s just a question of when. As such, all that hot inflation prints do (as long as they’re not too hot) is push rate cuts further into the future.
Turning back to where we are now, with yields falling more on the short end this week, the 2/10 curve is now the steepest since June ‘22 +6bps w/w according to the St. Louis Fed.
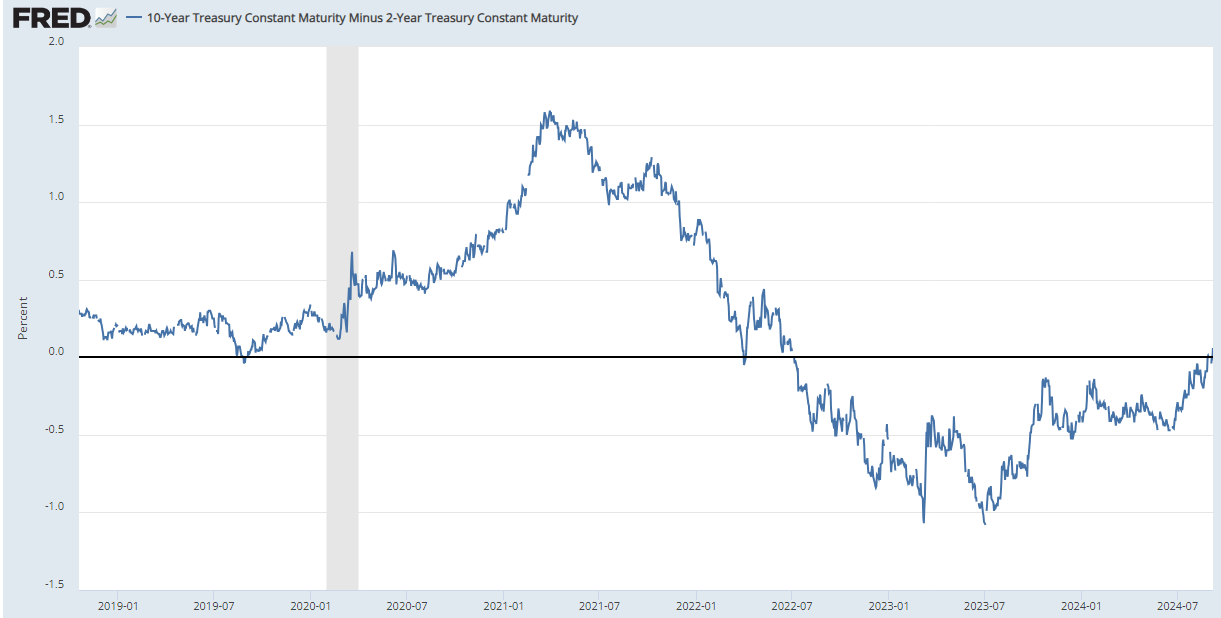
As a reminder, historically when the 2/10 curve uninverts following a long period of inversion the economy is either in a recession or within a few months of one. This I think is one of the things that dialed up recession concerns this week.


The 3mos/10yr yield curve (considered a better recession signal than 2/10’s) remains a lot farther from uninverting at -1.41%, actually moving further inverted -11bps w/w with rate cuts on the horizon pulling down the 3mth yield.

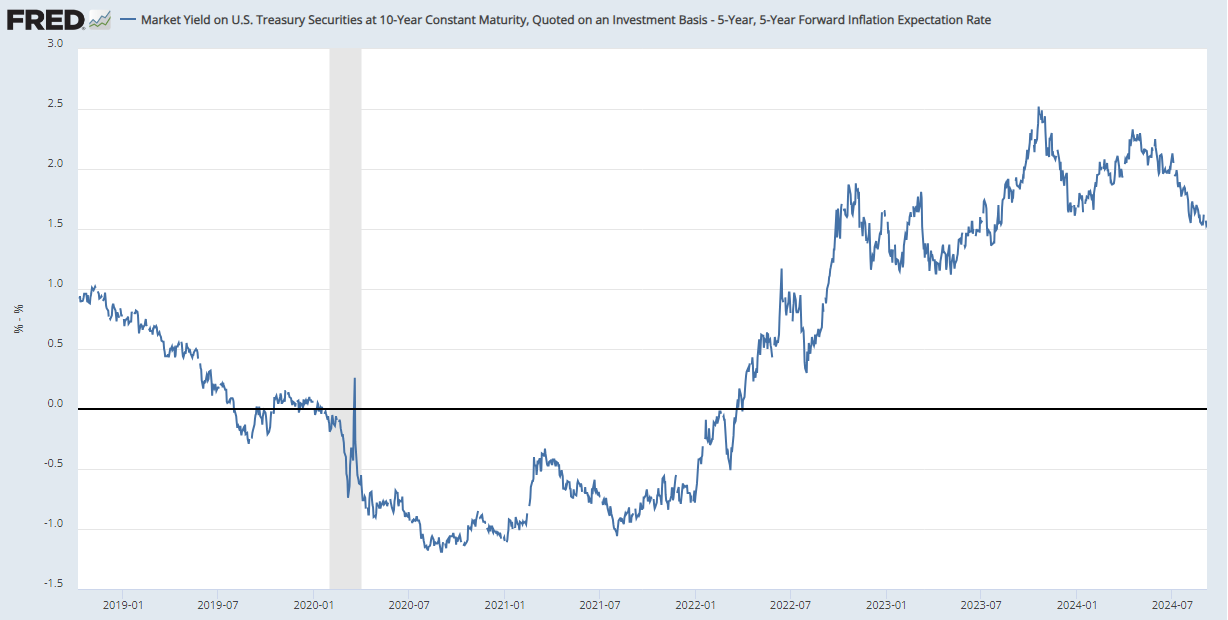
While longer term inflation expectations, as judged by the 5-yr, 5-yr forward rate (exp'd inflation starting in 5 yrs over the following 5 yrs) fell -10bps w/w to 2.19% down to the joint least this yr (and just 2bps from the least since Apr ‘23).

With inflation expectations falling, they offset the fall in nominal yields leaving 10yr real rates (based on 10yr inflation-indexed bonds) -1bps w/w to +1.70% just above the least since Feb.

A little different story if you calculate 10yr real rates using 5-yr, 5-yr inflation expectations (subtracted from the 10yr nominal yield) which at 1.54% remained the least in a year (but still above the 2010-2020 peak of 1%).

Shorter-term real yields though (Fed Funds - core PCE from GDP (3mth annualized as of Q2)) remain over 2% at 2.53% (up a tenth with the revision to core PCE) up from 1.63% in Q1, but down from 3.3% in Q4 which had been the highest since 2007).
And using CPI it’s now the highest since Oct ‘07 at 2.44%.
And the 10yr term edged higher but remained near the lows of the year at +0.14%. This is something markets were laser focused on when it hit +0.62% last October, but then lost interest in. I continue to think as you get into 2H of this yr, with a lot of talk about deficits and interest costs (i.e., more supply needed), etc., this may resurface as an issue that will push yields higher and cause some equity indigestion as it did then.

The extended discussion on term premium (what it is, why it’s important, etc.), can be found in this section in the Feb 4th Week Ahead.
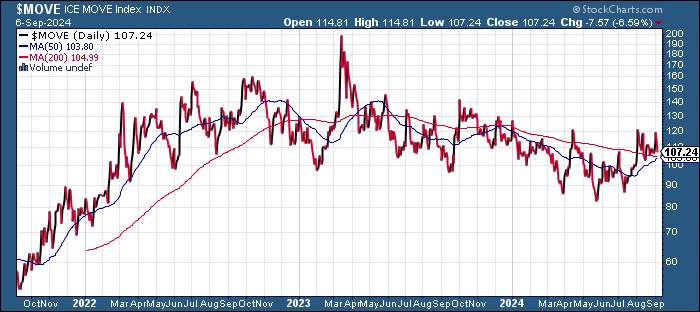
As the MOVE index of bond volatility edged lower but remains in its range since the start of Aug above the lows of the yr and even further above pre-2022 levels.
Which kept mortgage spreads relatively elevated at 2.53% +1bps w/w and overall little changed since early May, also remaining well above prepandemic levels but also well below the highs from last year.

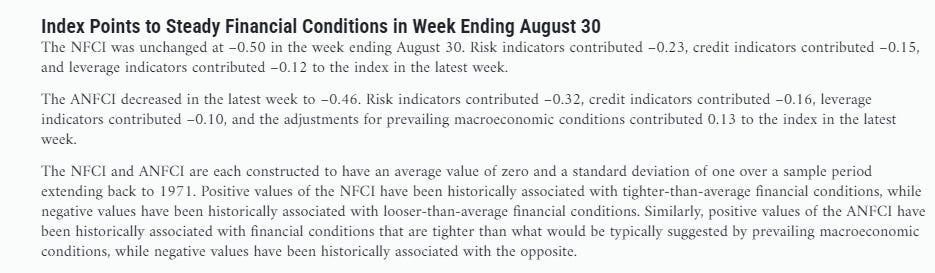
And the Chicago Fed National Financial Conditions Index and its adjusted counterpart (which are very comprehensive each w/105 indicators) in week through Aug 30th after upward revisions to the prior week saw the former remain at just above the loosest since Nov ‘21 while the latter edged lower for a 3rd week to the lowest since June.

Turning to the discussion of the Fed’s balance sheet/QT and its impact on RRP, we continue to get steady, sizeable auctions of T-bills (<1 yr) of around $800bn/month as well as the $60bn in balance sheet runoff which combined drained ~$1.75 trillion from RRP in the year through March 1st, but as noted in previous weeks, RRP levels had remained stable in the $375-$500bn range until 5 weeks ago when they dropped to what seemed to be a new range of $285-$350bn. Last week they pushed above that range as is typical at month end, but they did return to that range this week falling to $299bn, -$134bn w/w.
As a reminder BoA estimates that RRP will be mostly gone by October, but Citi thinks it will remain around the $300bn level until RRP rates fall. If RRP levels do fall much below this new range it will be time for the FOMC to start to look to further slow QT (we may hear a question on QT at the FOMC press conference).


For more on BoA’s forecasts for RRP to drop to near zero ($60bn) by Oct you can follow the link and look in this section (but it’s mostly due to RRP yields falling below those of money markets and will be soaked up by bonds (from Fed QT), the Treasury (with a higher TGA), and currency growth (in dollars). If bank reserves increase that would also pull from RRP. They see it building again into early 2025 before declining again towards zero.
For more on Citi’s thinking that $300bn is a “constraint level” you can follow the link and look in this section but it’s mostly due to the increased Treasury supply which had absorbed RRP up until March as noted being absorbed by dealers due to just constraints in their ability to intermediate Treasury purchases as well as increased holdings due to “sponsored repo activity”. Still they see it eventually falling lower if/when RRP rates fall.
Bank reserves in contrast to RRP edged higher +$20bn w/w through Thurs to $3.26tn, from the 2nd lowest since Oct ‘23 (putting a little more breathing room above the "scarcity" level which appears to be at $3tn).
They are down -$78bn since June 1, 2022 when the Fed started QT, a much better result than even the most optimistic estimates at the time. BoA as a reminder expects reserves to remain around $3.3tn indefinitely, a prediction that has so far proven correct.

For background on various estimates of when reserves will be “too low” see the Feb 4th Week Ahead.
Getting back to rates, I said 18 weeks ago 2-year Treasuries were a good buy at 5%, and I had thought we wouldn’t have a chance to get back there again until the next round of inflation reports in June (if they came in hot). As I noted five weeks ago,
Well, they certainly didn’t come in hot, making 5% a long shot now and likely setting up 4.75% as a new ceiling (but many think we’ll revisit those levels in coming years and perhaps exceed them). I have also said 4.7% is a good place to ease into 10yr’s and that also seems unlikely anytime in the near future (and those who were waiting for 5% are likely to see a 3-handle first). At this point, the momentum is to the downside, and while I think we may find ourselves back at higher levels at some point, for now I’d be looking lower on yields not higher.
And now we’ve seen that 3-handle I mentioned, as yields pushed to the lowest close in a year this week as noted in Friday’s report. I think there’s some scope for rates to continue to move lower but we’re now starting to move below what I consider fair value absent a recession (around 4%). But as I noted two weeks ago
While 10 yrs are a little rich we could see 3.5% before we see 4.25% absent a very hot Aug CPI print. I am inclined though to fade a 2yr under 4% unless we see the labor market crack (but I won’t be shorting due to the carry, just not buying).
For all the old “final hike” and “first cut” materials, you can reference the Feb 4th blog post.
Note BoA still hasn’t updated their “Dove-Hawk chart” so Mester is still listed (twice) but that should be her replacement Beth Hammock who hasn’t spoken yet, so we can only guess what her views are (while Musalem has an asterisk even though we’ve heard from him several times (I’ve messaged them to update this)). I also don’t know that he’s a “Hawk” given he’s open to rate cuts, and Daly is definitely I think at least “Dovish”.

Earnings
As a reminder, I have removed most of the background material, which you can get in the Feb 4th blog post. As you know I’ve moved on to 2Q and beyond. You can reference this post from 5/12/24 for stats on 1Q.
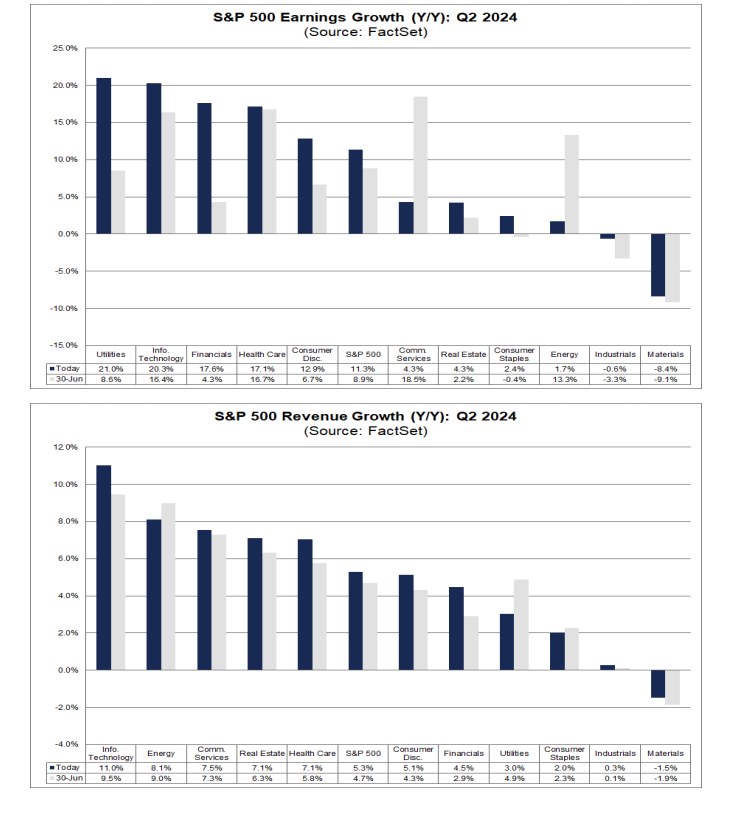
Wrapping up Q2 earnings we saw 79% beat (above the 5yr avg of 77% and 10yr avg of 74%), but despite the high beat rates, earnings came in just +3.6% above exp’s on avg, well below the 5yr avg of 8.6% and 10yr avg of 6.8%. Q2 will come in at +11.3% y/y growth which is up a little over the past few weeks, and above the +8.8% at the start of earnings season. But this is less than the the avg improvement from the start of earnings season the last 10yrs of +6.8%. Still, it was the best growth since Q4 ‘21.
Revenues were worse, beating at just a 60% clip below the 5 & 10 yr avgs (69 & 64%), and coming in just +0.7% above expectations, the worst performance since Q4 ‘19 and below the 5yr avg (2%) and 10yr avg (1.4%). But at +5.3% growth (vs +4.7% exp’d) it’s the best since Q4 ‘22 & the 15th consec quarter of revenue growth.
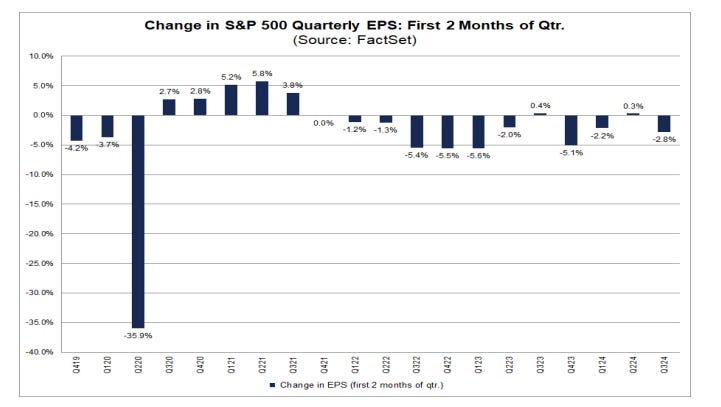
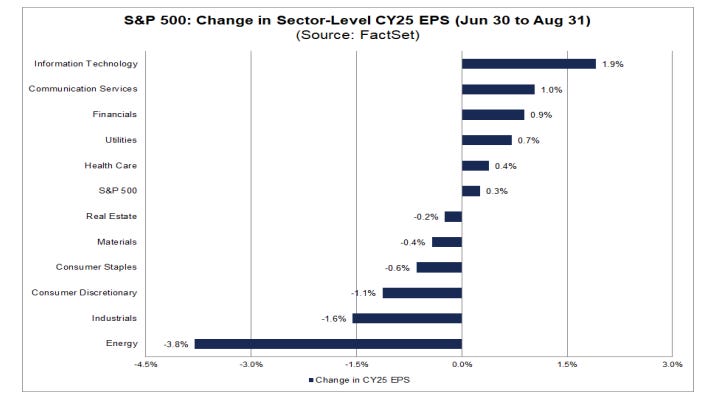
As we move closer to Q3 earnings, those continue to fall in line with historical avgs (down -2.8% since the start of the quarter (5yr avg is -2.7% & 10yr avg -2.6%, 20yr -3.0%) to +4.9% y/y growth. Every sector but one was marked down (Q4 is down to +15.4% (which has a lot of room to move lower), Q1 2025 though is up to +15.0% (+0.6% the last 3wks) while Q2 ‘25 is at +14.1%.


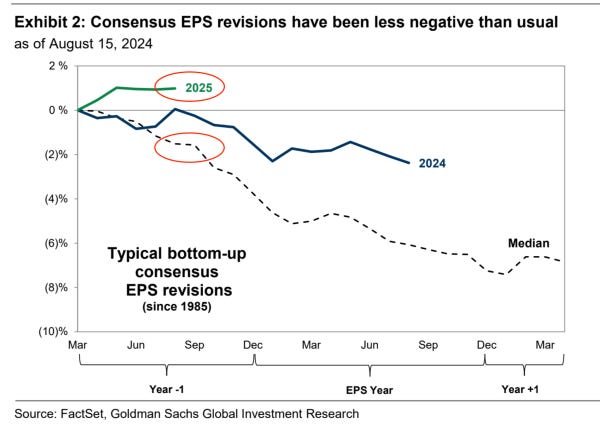
Putting it together FY ‘24 earnings expectations are now at $242.70 (from $242.50 three weeks ago but $245 on June 26th) as improvement to Q2 offset falling expectations for Q’s 3 & 4. They continue to see much less than the typical -6% or so drop we historically see from July of the prior year (July '23).
2025 earnings expectations have edged higher the past few weeks to $279.50 from $278.69 four weeks ago, up around $5 from the start of the year, also not seeing the typical drop (in fact they're up from July '24 levels).

In terms of how the market digested results, beats gained “slightly less than average” while misses were punished (looking at 2 days before to 2 days after reporting) vs history:
Companies that have reported positive earnings surprises for Q2 2024 have seen an average price increase of +0.9%…just below the 5-year average price increase of +1.0%.
Companies that have reported negative earnings surprises for Q2 2024 have seen an average price decrease of -4.4%…This percentage decrease is larger than the 5- year average price decrease of -2.3%.

Factset’s analysis of analyst bottom-up SPX price targets for next 12 months as of Thursday continue to move higher, now at 6276, up ~1,238 points over the past 27 weeks. Information Technology (+22.5%) and Energy (+21.3%) are expected to see the largest price increases, Consumer Staples (+2.3%) the smallest.
As a reminder the last 10 yrs they have been on avg +2.9% too high (+3.4% last 5 yrs). Of course, that avg range masks a wide discrepancy between big up and down years.


In terms of analyst ratings, no change this week w/buy and hold ratings continuing to dominate at 55 & 40% respectively (as has been the case all year). Communication Services (64%), Energy (63%), and Information Technology (61%) sectors have the highest percentages of Buy ratings, while the Consumer Staples (44%), Utilities (47%), and Materials (49%) sectors have the lowest percentages of Buy ratings.

And some other earnings stuff:


Economy
As I’ve written over the past 18 months, part of my earnings optimism has been due to the economy holding up better than expected. While earnings only track the economy loosely (and markets look forward 6-12 months), there is a clear correlation between recessions, lower earnings, and lower stock prices (although stock prices (being as noted forward looking) generally fall in advance of the recession and bottom 6-9 months before the end of the recession). So if you can see a recession coming it is helpful, although very difficult (especially ahead of the market). You can reference this Week Ahead (see the Economy section) for a lot of material on how every recession is preceded by talk of a “soft landing” as close as a month before the start (Note: As I noted a few weeks ago this has become more relevant as we see further signs of slowing). On the IRA infrastructure act, the November 26 report has good info on how that should be supportive at least through the end of this year. That report also has the notes about how small caps have shorter debt maturity profiles and more of it.
As I’ve been stating since I switched to the Week Ahead posts in mid-2022, the indicators to me are consistent with solid (which at times has been robust) economic growth, and I have been a broken record that I “certainly [did] not think we’re on the verge of a recession (although as noted above every recession starts out looking like just some economic softening).” But a few months ago I added: “That said, I’ve also noted over the past __ weeks or so [now 19], we have clearly started to see some moderation in key areas like consumption, manufacturing, construction, exports and housing.” This week was more of the same with continued weakness in manufacturing sentiment (PMI’s) and capital goods orders (business capex), a continued overall deceleration in employment, and decelerating construction spending, but strong income and services sector growth, good productivity, low unemployment claims, and increasing imports and exports. Overall I continue to feel that the softening does not appear to be morphing into a recession although some key areas like housing are clearly at recession levels (outside of new home sales and home prices).
Overall, as I said five weeks ago:
without question, the evidence is building that the days of >3% real GDP growth are behind us, and we should be happy to settle into something more around trend (1-3% real (infl adjusted) growth). That though is far from a disaster. The important thing will be to see the softening level out (L-shape) rather than continue to fall turning the “soft landing” into a recession.
As far as the Citi Economic Surprise Index is concerned it was weaker than expected falling to -30.1 from -24.2. While well off the 2yr low of -47.5 eight weeks ago, still solidly in negative territory.

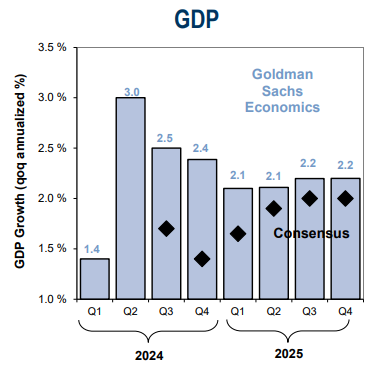
And GDP estimates are for now consistent with a no recession call (again though remembering GDP going into recessions generally doesn’t look like one is coming (it was up around 2% in Q2 & Q3 2008 well after the recession had started)). They unsurprisingly remained mostly around the 2-2.5% level.
Goldman (who was at 2.3% for 2Q vs 2.8% actual) cut their estimate by two tenths to +2.5%, still modestly above most other estimates (not sure where they get "consensus" from, but I haven't seen many sub-2%).
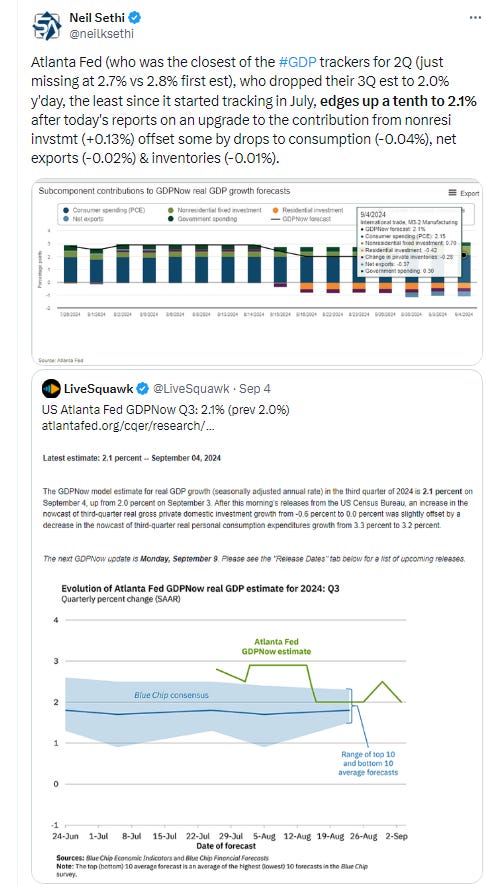
Atlanta Fed fell to 2.1% from 2.5% the previous week.
While BoA as of Thursday night was at 2.3% for their 3Q GDP est (they had 2.4% ahead of 2Q not far off the 2.8% actual 1st est).

While the NY Fed’s 3Q GDP Nowcast (as a reminder, they had 2.01% for 2Q vs 2.8% 1st est) remains one of the higher at 2.61%, up from 2.49% the prior week, driven by trade data (+0.15%) and the NFP report (+0.04%).
They also edged higher their 4Q est to 2.21% from 2.12%.


And the St. Louis Fed GDP tracker, which outside of Q1 (where it was the closest) has significantly undershot actual real GDP since Q3 ‘22, sees its Q3 ‘24 est move up a tenth to 2.06%.

And the Weekly Econ Index from the DallasFed (scaled as y/y rise for GDP), which runs a week behind other GDP trackers, moved to the highest this year in the wk through Aug 31st to 2.41% from 1.80% the prior wk (rev’d down from 2.27% (this series is consistently revised lower in the following week although that’s a larger than normal revision)). The 13-wk avg though stayed at +1.97%, evidencing that overall economic momentum is stable.

Here’s the components.

Other economy stuff:


Multiple
Like the other sections, I’ll just post current week items regarding the multiple. For the historical stuff, see the Feb 4th blog post.
With the equity selloff, forward P/E’s eased back. The SPX fell back to 20.2 from 21.1 the prev wk (& the 21.4 it hit 8wks ago (which was the highest since Jan '22)). The “Megacap-8” P/E fell back to 28.6 from 29.3, down from 31.5 from 8wks ago (which was also the highest since Jan ‘22). Mid-caps fell to 15.0 from 15.8, while small caps fell to 14.5 from 15.4.

As BoA reminds us according to their work, valuation matters little in the near term, but is almost all that matters in the long-term.

And some analyst thoughts on valuations.
Breadth
Breadth after seeing 4wks of improvement for the NYSE (Nasdaq sort of stalled out the week before last) turned sharply lower last week across the board. The one positive is it has allowed the “other 493” to outperform with the equal weighted SPX to the highest since May vs the cap-weighted version.
% of stocks over 200-DMAs after spending the prior 3wks recovering from the lows (NYSE) or near the lows (Nasdaq) of the year, turned back down last week though still above those levels for now (higher low) although so are prices.


While % of stocks above 50-DMAs a similar story.


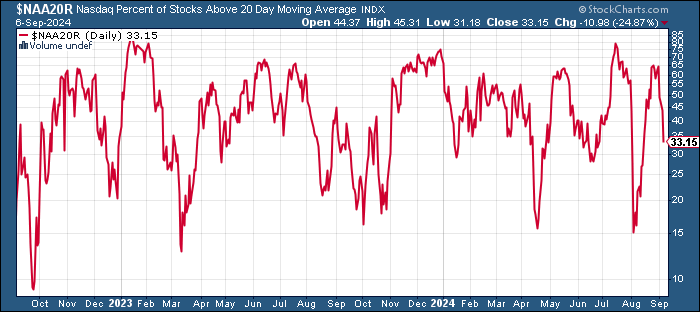
Same for % of stocks above 20-DMAs.

The equal-weighted SPX vs cap weighted ratio continued its bounce from a 4wk low 2wks ago now to the highest since May. It continues to me to resemble the 2009 pattern where we saw a big retracement from an initial bounce from the lows before it embarked on a swift multi-year recovery.


IWM:SPY (small caps to large caps) though has seen that ratio stall out after hitting around the highest of the year in late July remaining overall not far from the least since 2000.


Equity sector breadth based on CME futures deteriorated as you would expect last week with just staples and RE managing gains, neither up more than +0.6%. Eight sectors were down that much though, in fact they were down at least -2% & five were down at least -4% with tech leading -7%.

Last week's SPX stock-by-stock chart map from Finviz showed despite the index finishing little changed, the clear majority of stocks were up on the week. Nvidia was a big drag offsetting that.

Other breadth stuff:
Flows/Positioning
BofA using EPFR data in the week through Sep 4th saw global equity flows remain positive for a 19th week, but just +$3.0bn, still the 38th inflow in the last 45 weeks, +$389bn YTD.
US saw 1st outflow in 10 wks (since Jun ‘24) & just 2nd in 10wks, “albeit teeny” at -$0.02bn, still ~+$173bn last 20wks & +$234bn YTD.
EM 14th wk of inflows, longest stretch since at least Nov ‘21, +$2.3bn, now +$106.5bn YTD, as China saw 15th week of inflows (+$3.1bn, +$52.3bn last 13wks (& $14.1bn in just the last 3)), now +$90.4bn YTD, while India +$0.1bn, now +$20.0bn YTD and easily on pace for record yr. EM took in +$91bn in all of 2023.
Europe continues w/outflows after 2 wks of inflows which were the 1st in 13wks. Overall it’s the 73rd outflow in 78wks, -$0.6bn, now -$33.0bn YTD after -$66.9bn in 2023.
Japan returned to inflows, just 1st in 3wks +$0.3bn, (still -$1.4bn last 3 wks, but +$15.5bn YTD after +$7.3bn in all of 2023).
US large caps 39th inflow in 47 wks (and 5th straight) +$0.7bn, now ~+$276bn last 42 wks after +$125bn in all of 2023.
Small caps though return to outflows after 2wks of inflows -$0.1bn, still +$11.9bn last 8 weeks and +$8.6bn YTD.
US value got an inflow, +$+0.03bn (still ~-$35.4bn in 2024 after a record -$73bn in 2023).
US growth though 9th outflow in 10wks -$2.4bn, now -$26.6bn last 10 wks but still ~+$128bn YTD.

Sector specific equity flows were overall negative in EPFR data in the week through Sep 4th:
Inflows:
Utilities led inflows after 2 wks of outflows +$0.5bn (+$2.3bn last 8wks).
Healthcare 3rd inflow in 4wks +$0.05bn (still -$17.3bn last 48 weeks).
Financials the 11th inflow in 15wks (and 2nd straight) +$0.2bn, +$4.3bn last 13wks.
Outflows:
Materials 6th wk of outflows -$0.9bn (still +$1.4bn last 15wks).
Energy 4th wk of outflows -$1.0bn (-$3.9bn last 5wks most since Jun ‘23).
Consumer another outflow -$0.08bn (-$26.4bn last 46 weeks).
Commercial services returned to outflows after 2wks of rare inflows -$0.1bn.
Real estate an outflow after 6wks of inflows, longest streak since Mar ‘22, -$0.3bn, still +$0.8bn last 7wks, but -$3.1bn last 21 weeks).
Tech saw a rare outflow after being in top 3 sectors for inflows for 8wks -$0.1bn, still +$11.0bn last 6wks & +$46.0bn last 35 weeks.


Looking at EPFR data in the week through Sep 4th for fixed income saw a 74th inflow in 75 weeks (and 6th straight) +$9.5bn, now ~+$434bn YTD (annualizing to $631bn):
IG/HG a 45th consec inflow (& 71st in 73 wks) +$9.7bn, now ~+$281bn YTD, on track for a record $406bn in 2024 after +$162bn in 2023.
Munis the 30th inflow in 34 wks (and 10th straight) +$0.4bn.
HY 4th consec inflow, 10th in 11 wks (and 35th in 44) +$0.9bn, now +$44.6bn last 44 wks.
Bank loans return to inflows after 6wks of outflows, longest streak since May ‘23, +$0.2bn still -$3.6bn last 6 wks). I two weeks ago “Seems perhaps floating rate debt getting less popular with #FOMC rate cuts on the horizon?”
Treasuries see 1st outflow in 19 wks (and 3rd in 32 wks) -$1.9bn, largest since Jan ‘24 after largest inflow since Oct ‘23 last wk.
TIPS another outflow, 8th in 9 wks (& 4th straight, 42nd in 52), -$0.2bn. TIPS also saw record outflows of -$33bn in 2023.
EM debt 6th wk of outflows the 42nd in 55 wks, -$0.3bn. EM debt also saw -$37.0bn in outflows in 2023.

In week through Sept 4th, EPFR saw cash funds w/a 5th wk of healthy inflows +$60.8bn, making largest 5 wks of inflows ($231bn) since Dec), now +$570bn YTD (annualizing to more modest but still very healthy +$823bn after a record $1.3T in 2023 and $3.3T 2019-2023).
Gold/Silver see 3rd consec inflow, the 9th in 11 wks +$0.6bn, now +$8.5bn last 14 wks.
Crypto funds (#Bitcoin) see 1st outflow in 4 wks (and just 3rd in 10 wks but 2nd largest since ETF approvals) -$0.6bn, still +$6.9bn last 18 wks.

ICI data on money market flows saw a smaller increase than EPFR’s +$60.8bn at $37.3bn in the week through Sep 4th, still pushing the YTD total in money market funds to ~+$405bn and the total MMF assets to a record high of $6.30tn.

Looking at CTA (trend follower) flows, BoA notes that “as global equities declined this week with each index that we track in this report falling by over 3%, the divergence between short-term trend signals [which has been the bulk of selling pressure so far] and long-term [which has seen less selling pressure] likely increased. Our model equally weights short term (less than 3 months) and long term (more than 6 months) signals, but we acknowledge that actual trend followers may overweight one over the other. We believe that followers of longer-term trends will have less to buy in an up market but also have more to sell on declines than followers of shorter-term trends that would likely to do the opposite. With CTAs likely chasing trends based on different signals, the risk that the community has an outsized impact on equity markets next week is reduced.”
Overall though their model sees the potential for $SPX CTA’s to exit the longs they’re built up the past couple of weeks in a “bear case”. They see more muted changes in either direction for $NDX or $RUT.

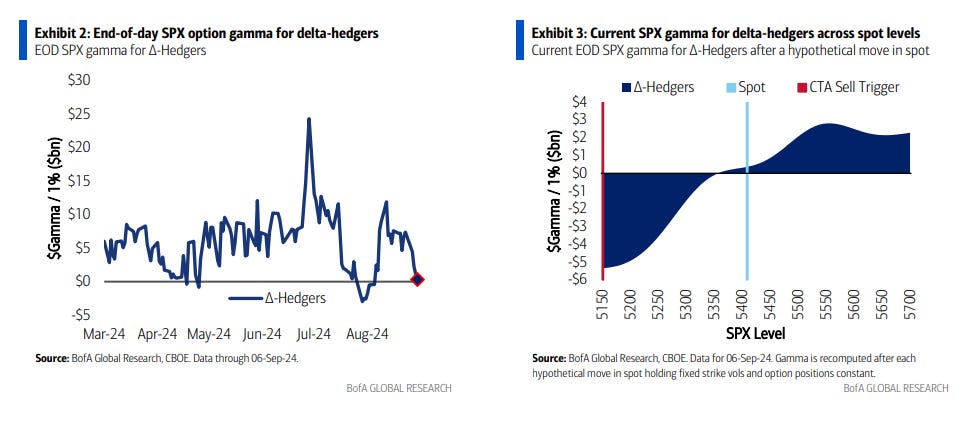
In terms of gamma positioning, BoA notes that after hitting the least this year 4 wks ago, but rebuilding somewhat the following weeks, after last week’s selloff based on their est’s “as of Friday’s close $SPX gamma was...modestly positive (+$300mn, 6th %ile year-to-date). For context, this is a marked decline from the roughly +$5-7bn seen the week prior. Going forward, should the equity weakness realized this week translate to further S&P downside next week, SPX gamma is likely to initially be of minimal importance due to its currently small size. However, the gamma profile indicates that the further equities decline, SPX gamma may grow increasingly short and at that point become a modest accelerant to further downside.”
The takeaway is that with gamma near zero we’ve lost an important source of market stabilization which dampened volatility for much of the year coming into August. As a result, the markets will be “freer” to move and stay more volatile for the time being (at least compared with the year coming into Aug). In the event of more big downside moves though (we had two -2% days last week) gamma could flip negative in which case dealers would become volatility accelerants selling into downside action and buying upside.
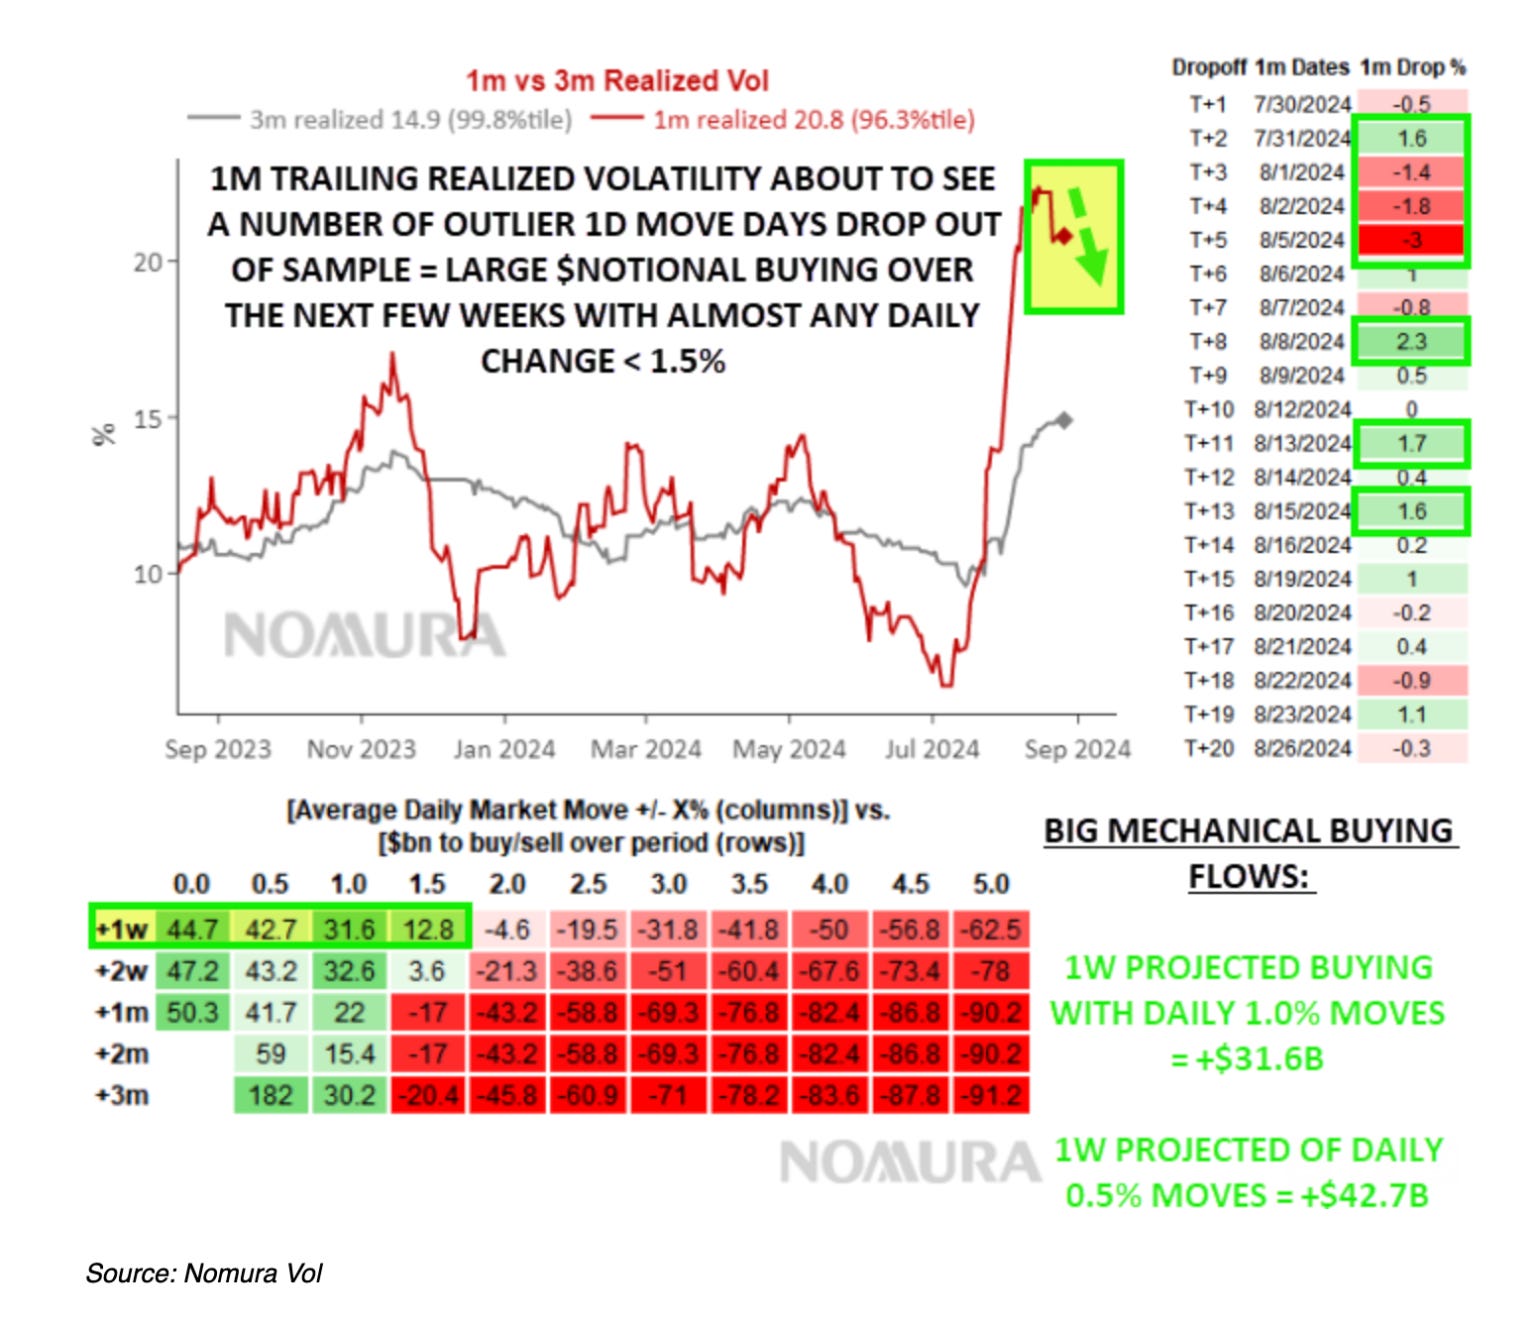
Unlike CTA’s, volatility targeters (vol control/risk parity), who started rebuilding positions the last 2 wks, turned back to sellers with the large daily moves last week, moving back towards 18mth lows. If we can get volatility to calm down these will reengage (i.e., daily market moves <1%), but if not, well, they won’t (and could continue to be sellers).

And as a reminder, Charlie McElligott posted the below when it appeared that volatility was going to drop. But as we know it didn’t, and if we see continued high volatility these traders will be sellers not just not buyers.
And while buybacks were supposed to be a big tailwind, BoA finds them to have been disappointing recently which may also be leading to some of the market weakness.

Sentiment
Sentiment (which I treat separately from positioning) is one of those things that really only matters at the extremes (and even then, like positioning, it really is typically helpful more at extreme lows vs extreme highs (“it takes bulls to have a bull market”, etc.)). After falling from elevated levels when equities peaked in late July, the indicators softened but as I four weeks ago “every indicator I track had softened … many considerably, but most remained well off contrarian low levels, more consistent with people looking to ‘buy the dip’ rather than flee the market altogether.” And as I noted since then “buy the dip” is what they had seemed to do, particularly as to the “unloved” areas of the market up until last week. As might be expected the action this week saw sentiment pull back (in some cases quite sharply). It’s not yet near what I would consider “extreme” though so not much message I would take from it this week.
But back to sentiment. The Investors Intelligence bulls didn’t change much this week. The American Association of Individual Investors (AAII) saw a small shift from bullishness as the bulls are no longer over 50% (they are now at 45%) but the bears did not rise, they fell two points (to 25%).
Everyone seems to have jumped into the neutral camp. Long-time readers will know that this is typical as folks rarely jump the fence from bull to bear but rather make a stop on the fence. Either way, there is nothing extreme there.
The National Association of Active Investment Managers (NAAIM) pulled back their exposure this week from the mid-80s to 71. That’s a start, but 71 is the middle of nowhere. Based on the chatter I would have expected that to be 55-60 already.


The 10-DMA of the equity put/call ratio (black/red line) continues to rise quickly evidencing increased cautiousness. It’s not yet at the August highs but is moving in that direction.

CNN Fear & Greed Index dropped sharply after hitting the highest since April the previous week down to -24pts to 39 from 63 (still though well above the 17 reading on Aug 5th which had been the least since Oct ‘22) now though back into Fear territory after pushing towards Extreme Greed a week prior.


BofA Bull & Bear Indicator falls back to 5.9 from 6.2, the 5th decrease in 6wks after hitting the highest since May ‘21. The decrease was “as weaker equity breadth + higher SPX & US$ hedging activity offsets stronger inflows to equities & bonds.”

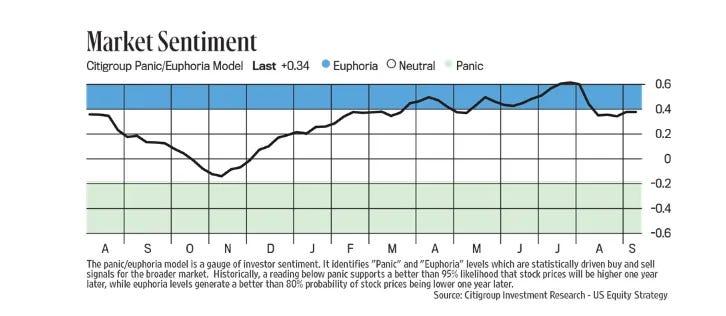
And the Citi Panic/Euphoria index remains just under Euphoria levels.
While Helene's followers turn bearish for the 1st week in 8 (and 2nd in 11). The last two times we got a bearish read after a long string of bullish reads it was a dip in the markets that quickly resumed its upward trajectory. Will this time be different?

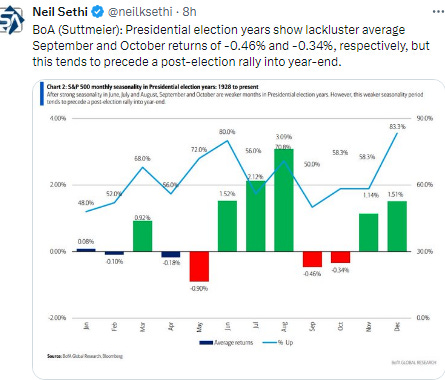
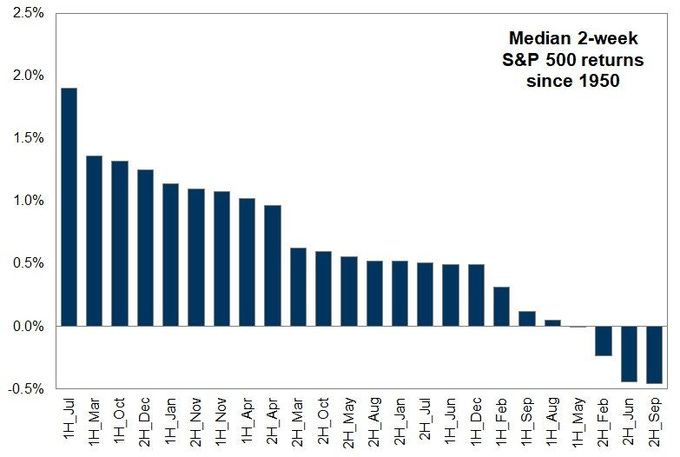
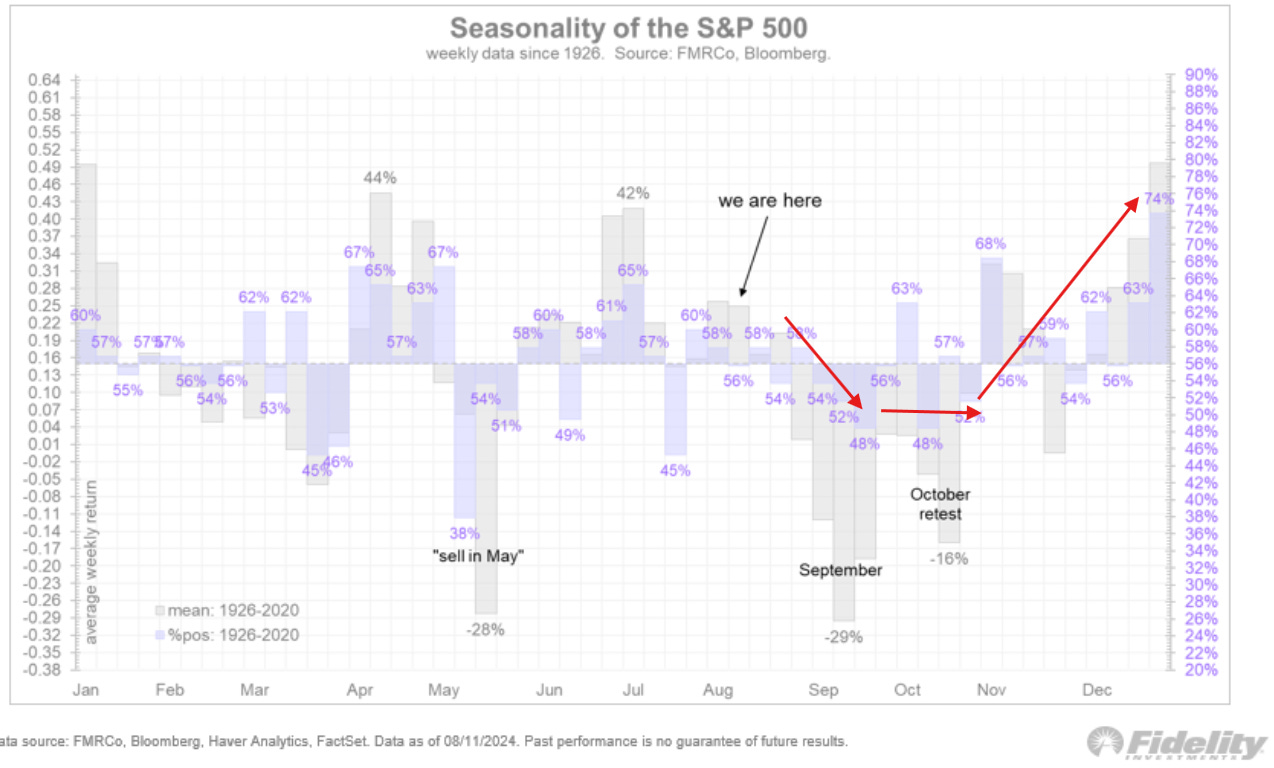
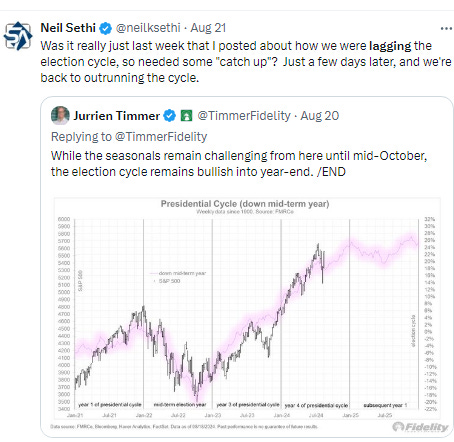
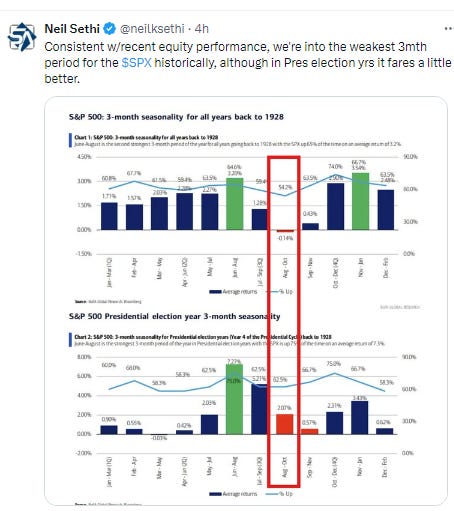
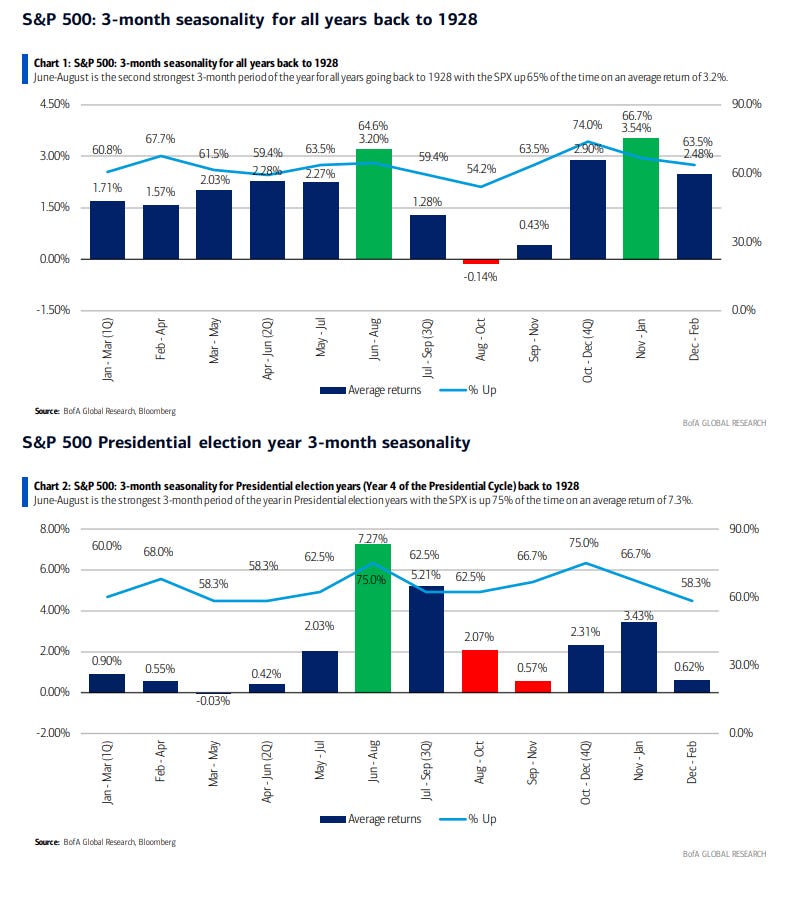
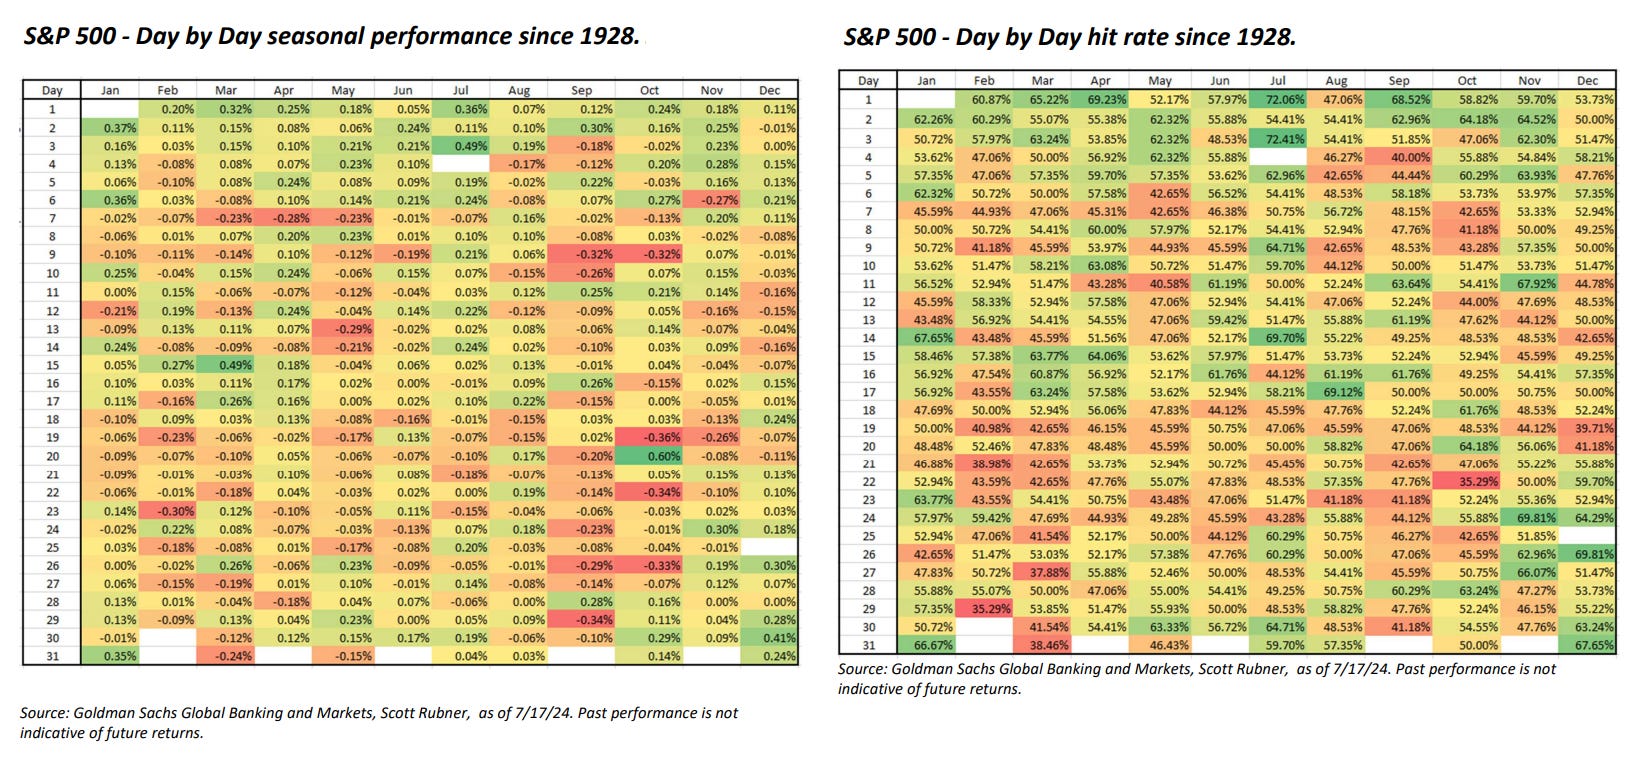
Seasonality
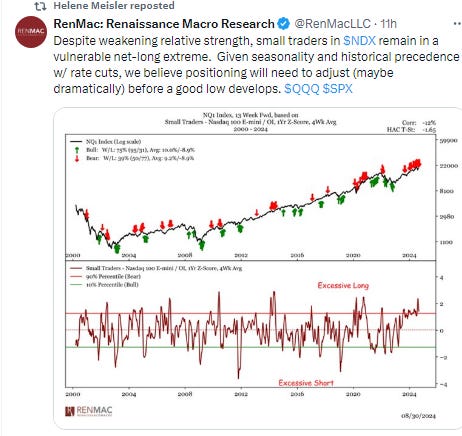
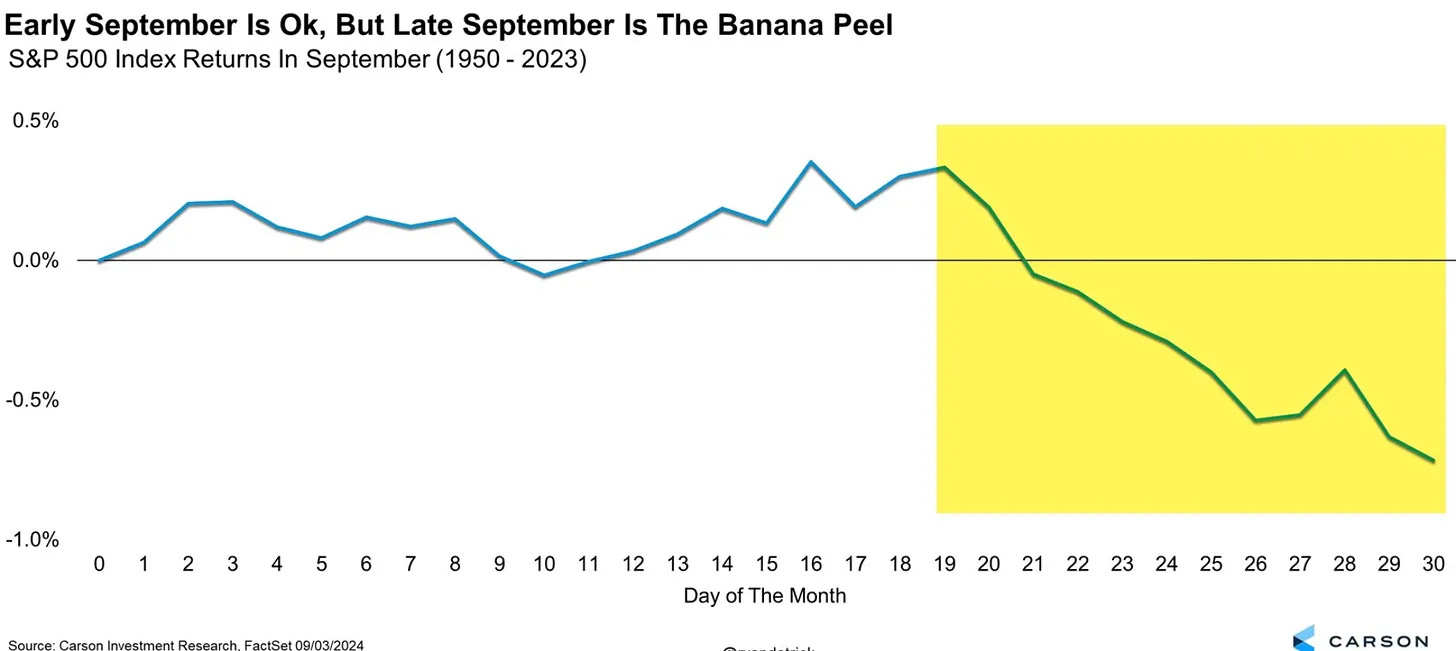
As noted in previous weeks while the May-Nov period is commonly thought of as seasonally weak ("Sell in May” and all that), in reality on average it sees positive returns and also is normally stronger in an election year. However it does have its stronger and weaker periods, and while we remain for now in a stronger period until around Sept 15th when we’ll enter the weakest 2 weeks seasonally of the year, Goldman’s Scott Rubner thinks part of the market weakness has been “front running” of the very weak second half of September. Does that mean things will continue to be weak and then better than normal then? Your guess is as good as mine, just a possibility. Typically after this week things don’t materially improve on the seasonality front until closer to the election when we get a very strong tailwind.


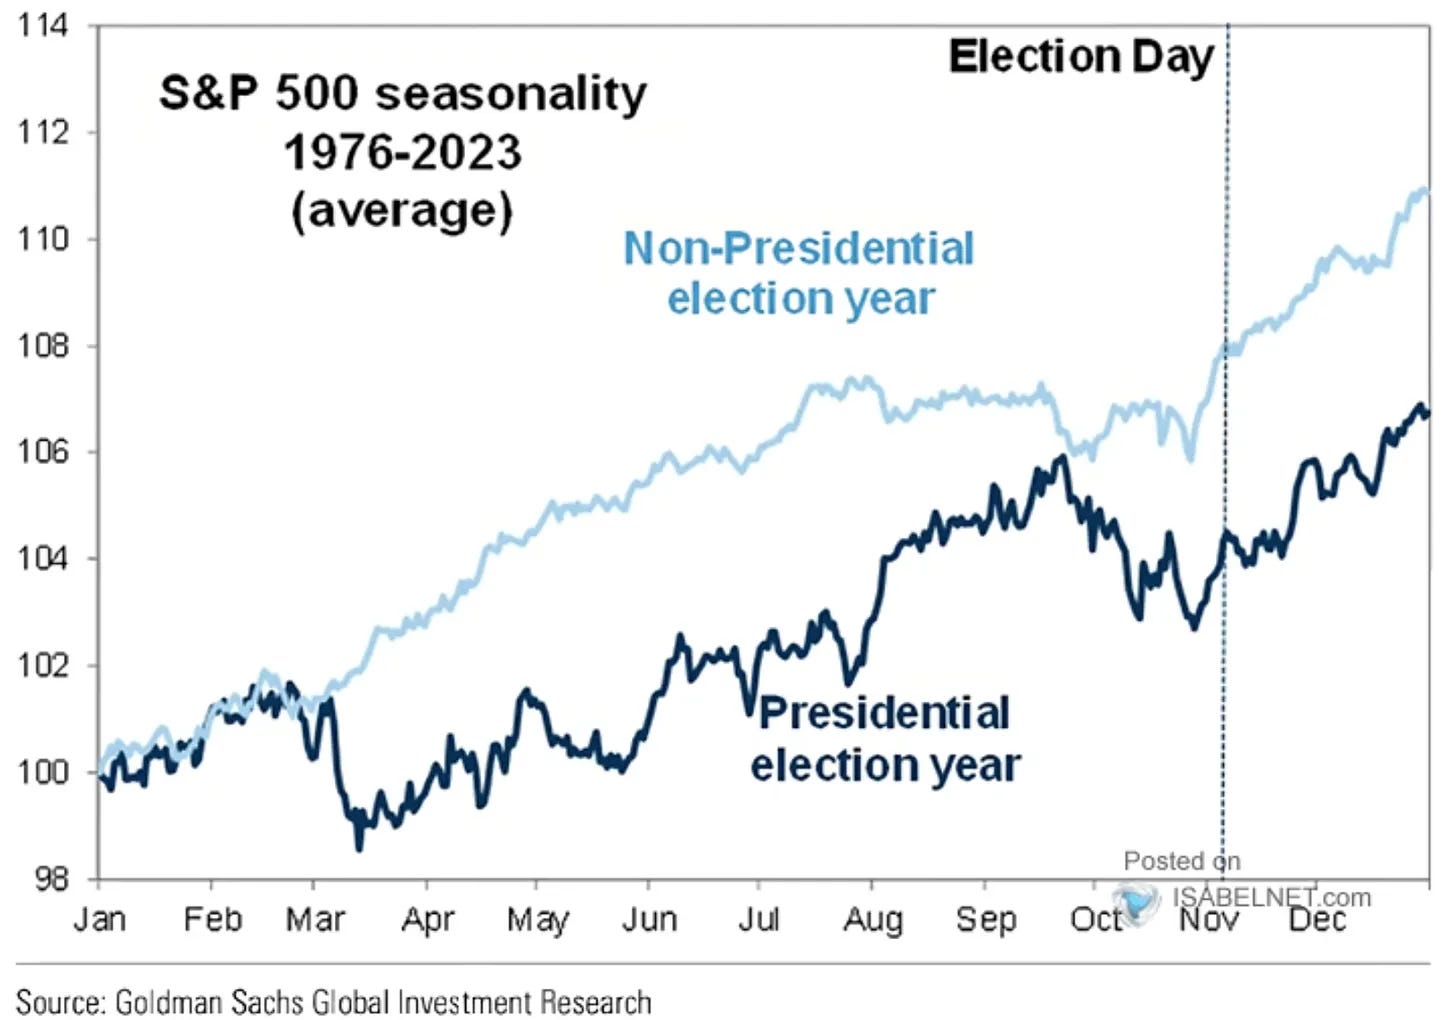


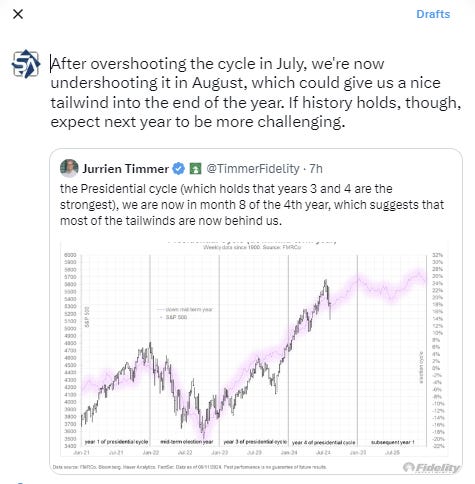

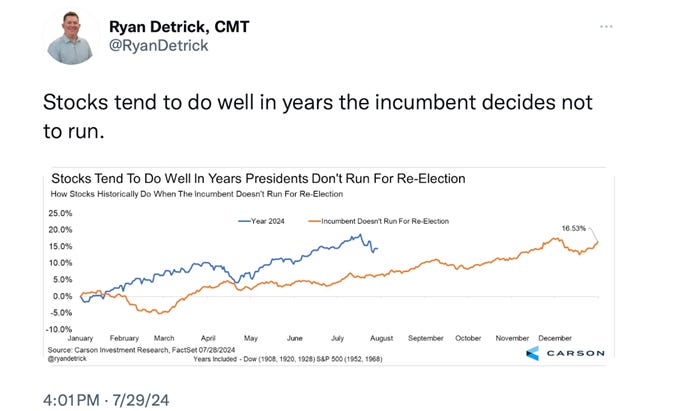
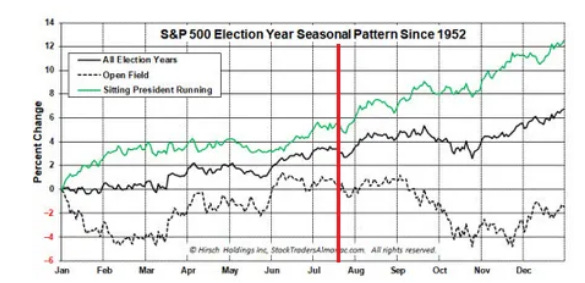
And now we have a new seasonality pattern to consider, an “open field” presidential contest, it's probably no surprise that returns are not nearly as healthy as when a sitting president running (as the incumbent doesn’t have as much interest in a buoyant stock market), but in this case given the very compressed timeframe and the incumbent “choosing” his successor, I think it would be a mistake to follow the open field historical pattern.

And as we consider seasonality, a really nice post from Callie Cox about how you need to take historical analogies w/a grain of salt (unless you've dug into the history). Her chart on Presidential election yr performance w/ & w/o 2008 (when the SPX was -17% in Oct) is a wonderful example.
https://www.optimisticallie.com/p/a-history-lesson


For references to all of the “up YTD through Feb” see the March 3rd post. For all the very positive stats through March (strong 1Q, strong two consec quarters, etc.) see the April 14h post.
For the “as January goes so goes the year”, see the February 4th Week Ahead.
Final Thoughts
Sooo, I said in this space two weeks ago
far from “stepping on the rally”, Powell gave it some juice, carving in stone (metaphorically) the assumed Fed pivot to rate cuts. As noted earlier, we’ve officially entered a new stage where the monthly jobs report takes precedence over the CPI report…. A brave new world. This of course is nothing if not bullish for risk assets (assuming a no recession scenario which for now seems to be the case). And with systematic positioning “cleaned out” and starting to reengage, sentiment mostly off frothy levels, the technical position very strong, breadth expanding, seasonality favorable (at least the next few weeks), buybacks going full steam, etc., with the Fed now a clear tailwind, there’s a lot going right for equity bulls in the upcoming weeks. NVDA is a clear tail risk that looms, but assuming that is not a disaster, I think it’s hard to build a bearish case at least through the upcoming couple of weeks (which it should be noted will have lighter volumes (particularly this week) so systematic and corporate buying will have even more influence). Of course something can always come out of nowhere and knock things off kilter, but for now I think the bulls have the wind at their back.
And then last week,
And while Nvidia earnings didn’t meet the impossibly high hopes of investors, they were far from a “disaster,” and regardless as noted in the breadth section and in the nightly updates, if you’ve been in “Other 493” you probably did pretty well last week. All of the above tailwinds remain intact for now, and as the Flows section detailed, expectations are for the systematic buying to ratchet up this week. Add that to corporate buybacks with the blackout window almost fully open and with a couple of weeks before we get poor seasonality (and corporate tax day which always seems to such money from the stock market), you really have to stretch to build a convincingly bearish case at least ahead of Friday’s critical payrolls report.
As noted in the Tuesday summary, that last sentence came back to bite me in a big way, as “stretching” or not, the bears rejoiced as we dropped out of the gate and saw not one, but two -2% down days last week. In my defense, I was far from alone in not foreseeing last week, and nobody has had a really good explanation for what happened. My thinking now is that it was less a lot of selling and more mild selling into an absence of buyers. I take that from the fact that we didn’t see downside volume reach the 80% area let alone 90% like we saw Aug 5th. What we did see though is investor and systematic flows both with mild selling (the former as Scott Rubner noted ahead of what is typically the worst stretch of the year upcoming after next week), light corporate buybacks (at least according to BoA’s clients), and another move higher in the yen, which has seemed to come to some degree at the expense of tech stocks which were part of the “carry trade” (sell yen and buy other stuff).

But regardless of the reason, something came in and tripped up what should have been a positive week, so until we get further clarity on what that is, we’ll have to just hope that it has (or will soon) run its course. We ended poorly on Friday which is generally not a great setup for Monday, and now as noted a number of those previous tailwinds (systematic traders, technicals, breadth, seasonality, earnings lull, carry trade, etc.) have become headwinds (not to mention corporate tax day upcoming which often sees selling as we approach), so I have a hard time expecting great things for the upcoming week, but here’s hoping I’m wrong again.
But as I’ve said all year:
Overall this feels like a bull market (the economy is growing, earnings are growing, the Fed is much more likely to be cutting than hiking as its next move, the technical picture and seasonality are strong overall for this year, balance sheets are solid, there’s lots of liquidity, and there’s lots of stocks other than the biggest ones that are performing well (the equal weight SPX hit a new ATH in March, etc.) [this last part has taken a step back with the heightened recession fears - to the extent those soften these will start to perform well]. So if/when we do get that sharp pullback I would think it will likely be an opportunity to buy (like most sharp pullbacks are), not a reason to run for the hills.
And as always just remember pullbacks/corrections are just part of the plan.


Portfolio Notes
Exited REG, trimmed BCE, VZ, On the break of support in those stocks I took off some GOOGL, SHEL, CTRA, CVX, APA, ZBH, SLB with plans to buy it back (something new I’m playing with - I’ve also put on shorts on various things the past few weeks to hedge my longs (most notable USO & XLE but also some other stuff) but I want to see how it works before I start adding that in to the updates).
Cash = 8% (held mostly in SGOV, MINT & BOXX (BOXX mimics SGOV but no dividend, all capital appreciation so get long term capital gains if you hold for a year) but also some non-TBill (>1yr duration) Treasury ETF’s (if you exclude those, cash is around 6%)).
Positions (after around the top 20 I don’t keep track of their order on a frequent basis as they’re all less than 0.5% of my portfolio).
Core positions (each 5% or more of portfolio total around 20%) Note the core of my portfolio is energy infrastructure, specifically petroleum focused pipelines (weighted towards MLP’s due to the tax advantages). If you want to know more about reasons to own pipeline companies here are a couple of starter articles, but I’m happy to answer questions or steer you in the right direction. https://finance.yahoo.com/news/pipeline-stocks-101-investor-guide-000940473.html; https://www.globalxetfs.com/energy-mlp-insights-u-s-midstream-pipelines-are-still-attractive-and-can-benefit-from-global-catalysts/)
EPD, ET, PAA
Secondary core positions (each at least 1% of portfolio)
ENB, XOM
For the rest I’ll split based on how I think about them (these are all less than 1% of the portfolio each)
High quality, high conviction (long term), roughly in order of sizing
DIS, SHEL, CVS, CTRA, KHC, GOOGL, ADNT, T, PFE, TRP, BWA, SCHW, APA, ADNT, O, GSK, EQNR, BMY, CMCSA, GILD, TLH, TPR, MTB, DVN, OXY, RHHBY, STLA, NEM, NTR, E, ING, VZ, DAL, KMI, CI, AM, JWN, VSS, ARCC, CVX, AES, SQM, BAC, VNOM, PFF, TFC, MPLX, VOD, FSK, DAL, BAYRY, ING, HBAN, CCJ, BTI, FSK, RRC, FRT, VICI, DGS, WES, INDA, CURLF, MPLX, VWAPY, BMWYY, DDAIF, BUD, KEY, CVE, URNM, URA, SWN, SOFI, BEP, BIIB, SAN, OWL, TEF, SPG, KVUE, KT, ALB, F, VNM, WCC, MT, MFC, GPN, TD, LVMUY, SEE, LYG, NKE, AAPL, ADBE, ORCC, EMN, ZS, ON, NVDA, BCE, MDT, BAX, SNOW, SLB, RTX, LAZ, HAS, DELL, NOC, CHDRY, WEC, OCSL, SIG, MSM, PHM, TAP, EL, ABNB
High quality, less conviction due to valuation
Higher risk due to business or sector issues; own due to depressed valuation or long term growth potential (secular tailwinds), but at this point I am looking to scale out of these names on strength. These are generally much smaller positions outside of the top few.
ILMN, AGNC, PARA, PYPL, URNM, URA, YUMC, STWD, CFG, FXI, ORAN, KSS, CHWY, TIGO, WBA, ACCO, KVUE, KLG RMD, CLB, HBI, IBIT, UNG, TCNNF, TCEHY, EEMV, PK, VNM, SABR, NSANY, VNQI, VALE, SBH, ST, WBD, LADR, BNS, EWS, , IJS, NOK, SIL, WVFC, VTRS, NYCB, ABEV, TPIC, PEAK, SEE, LBTYK, RBGLY, LAC, CMP, CZR, BBWI, LAC, CAL, EWZ, CPER, MBUU, TLRY, HRTX, MSOS, SIRI, SOYB, DG, CORN
Note: CQP, EPD, ET, MMP, MPLX, PAA, WES all issue K-1s (PAGP is the same as PAA but with a 1099).
Reminder: I am generally a long term investor (12+ month horizon) but about 20% of my portfolio is more short term oriented (just looking for a retracement of a big move for example). This is probably a little more given the current environment. I do like to get paid while I wait though so I am a sucker for a good well supported dividend. I also supplement that with selling calls and puts. When I sell a stock, I almost always use a 1-2% trailstop. If you don’t know what that is, you can look it up on investopedia. But that allows me to continue to participate in a move if it just keeps going. Sometimes those don’t sell for days. When I sell calls or puts I go out 30-60 days and look to buy back at half price. Rather than monitor them I just put in a GTC order at the half price mark.
To subscribe to these summaries, click below (it’s free).
To invite others to check it out,