
The Week Ahead - 1/11/25
A comprehensive look at the upcoming week for US economics, equities and fixed income

If you're a new reader or maybe one who doesn’t make it to the end feel free to take a second to subscribe now. It’s free!
Or please take a moment to invite others who might be interested to check it out.
Please note that I do often add to or tweak items after first publishing, so it’s always safest to read it from the website where it will have any updates.
As a reminder, some things I leave in from prior weeks for reference purposes, because it’s in-between updates, it provides background information, etc.. Anything not updated this week is in italics. As always apologize for typos, errors, etc., as there’s a lot here, and I don’t really have time to do a thorough double-check.
For new subscribers, this is a relatively long post. The intent is to cover the same areas each week. Sometimes the various areas are more interesting, sometimes less, but it’s easier just to go through them all, so you can expect this format (with things in the same places) each week.
The main sections are intended to cover 1) what’s upcoming next week, 2) what the Fed and rates markets are up to, 3) what’s going on with earnings (which along with valuations and positioning are the determinants to stock prices over the long term), 4) what’s going on with the economy (both because of its impact on our daily lives (I am a business investor in my “real” job) but also because it impacts earnings), 5) valuations, 6) breadth (which gets into sector/style performance), 7) positioning/flows (this is the most important determinant to asset price changes in the short term), 8) sentiment (really only matters at extremes but interesting to track), 9) seasonality (gives you an idea of what normally happens), 10) “Final Thoughts” (remember you get what you pay for there, and it’s the last thing I do, so it often is a bit rushed), and 11) my portfolio (to be transparent about where my money is in the market (but note first it is most definitely not intended as financial advice, and second as I mentioned earlier my main job (and investing assets) are in private industries (RE & venture capital)) so my portfolio is built with that in mind (i.e., it’s not how I pay the day-to-day bills) plus see note about MLP’s in that section).

Note: I separated my shoulder pretty good training today and lost a lot of the day dealing with that. I got through most everything, but there are probably a larger than normal amount of grammatical, formatting, etc., errors, so apologize for that.
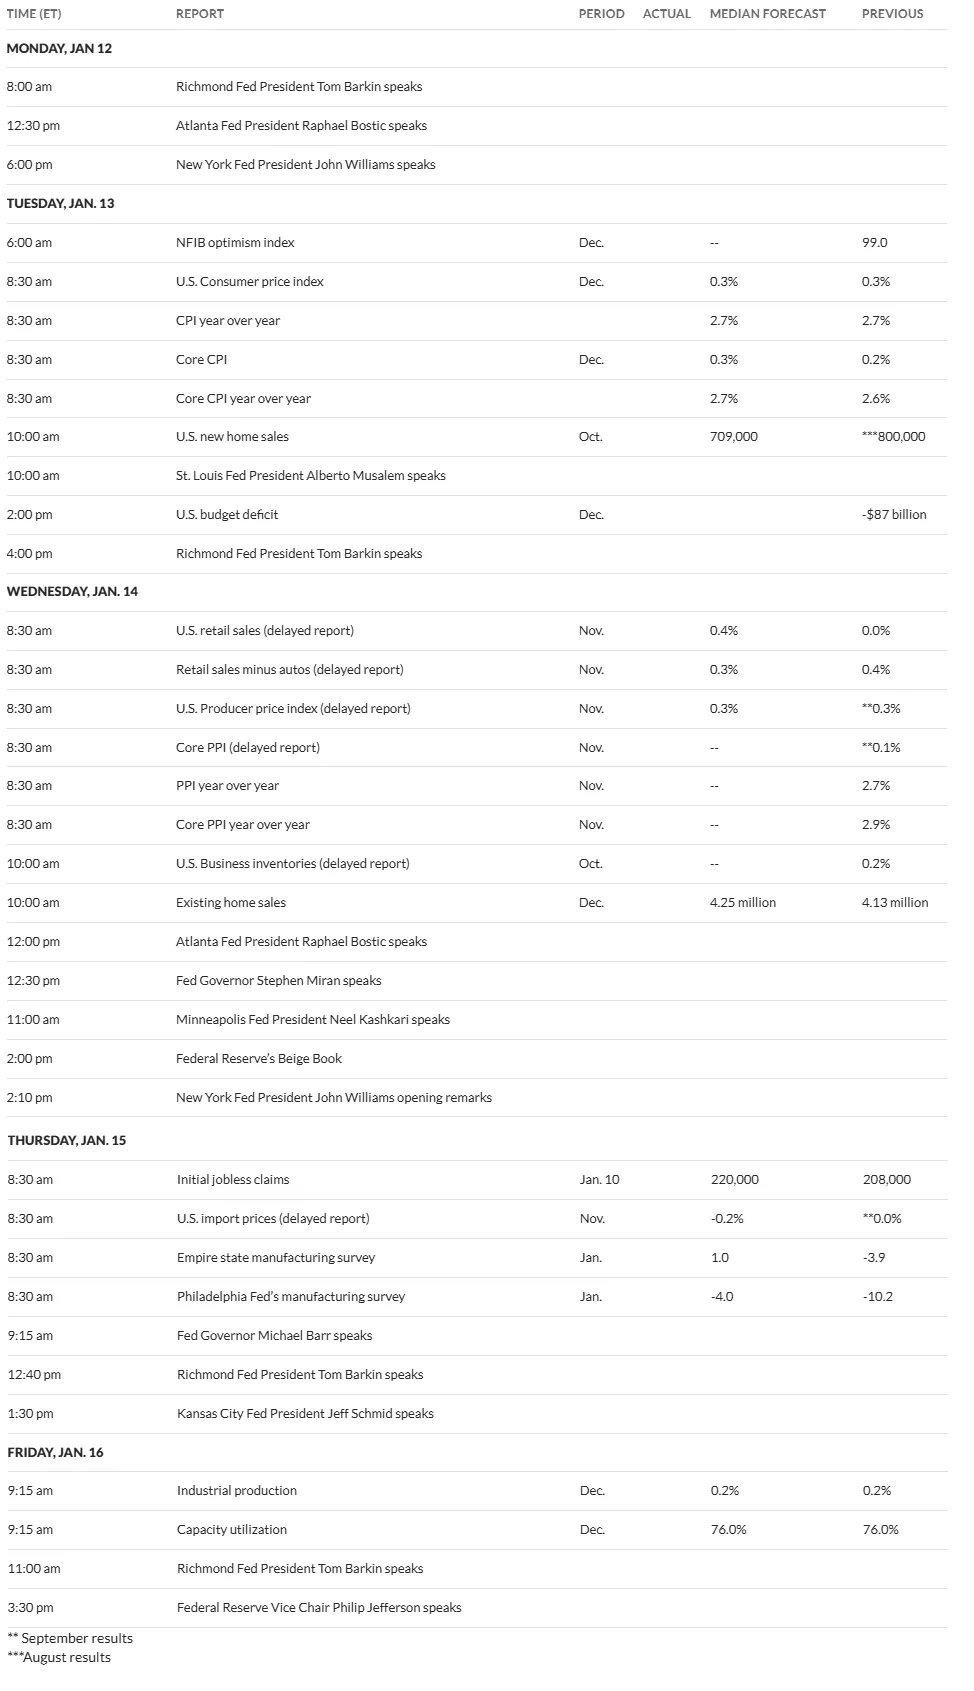
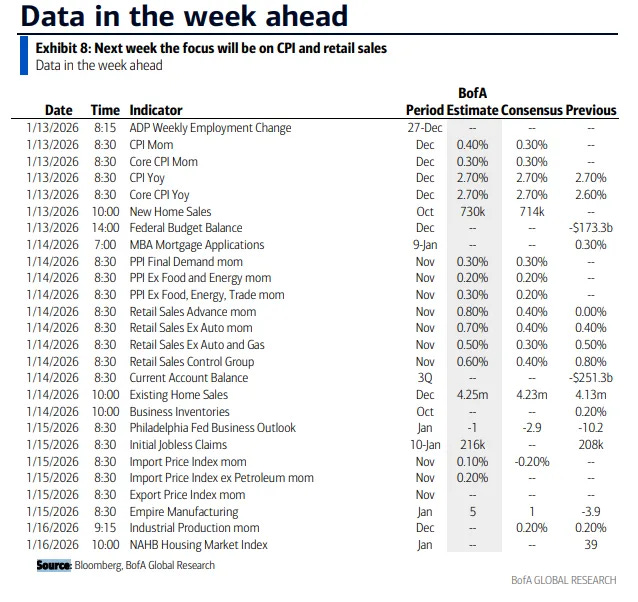
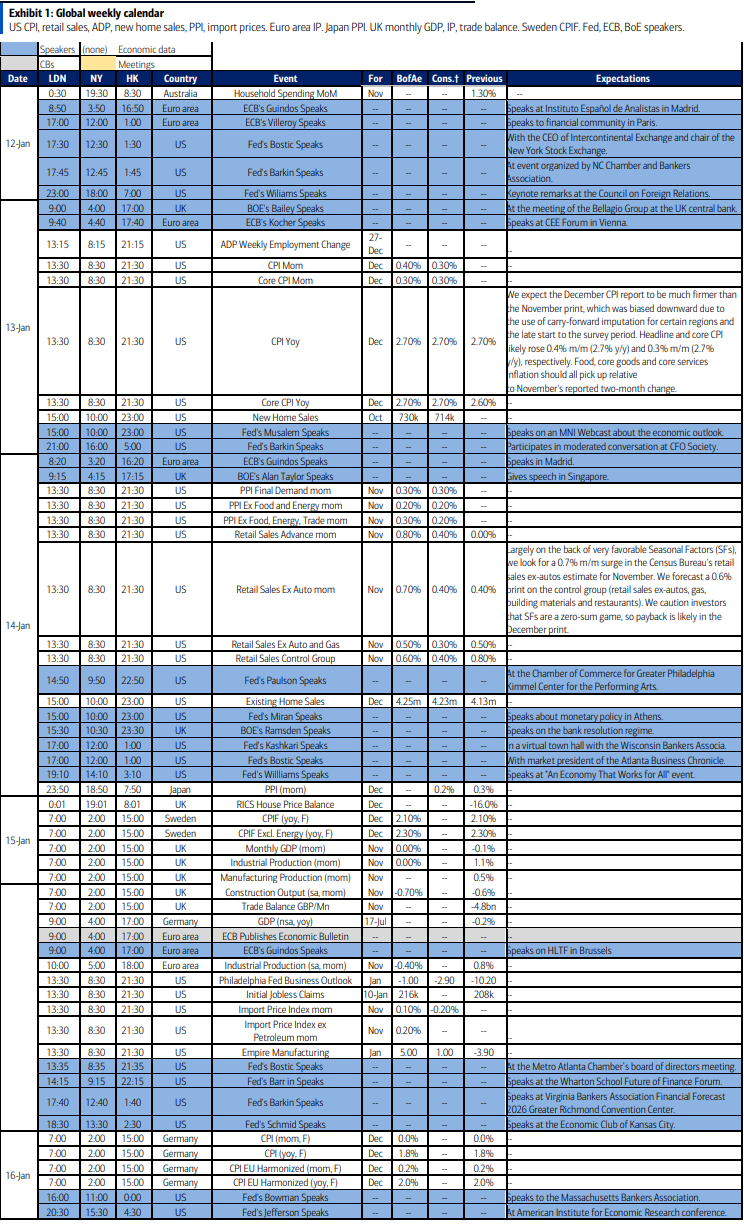
The Week Ahead
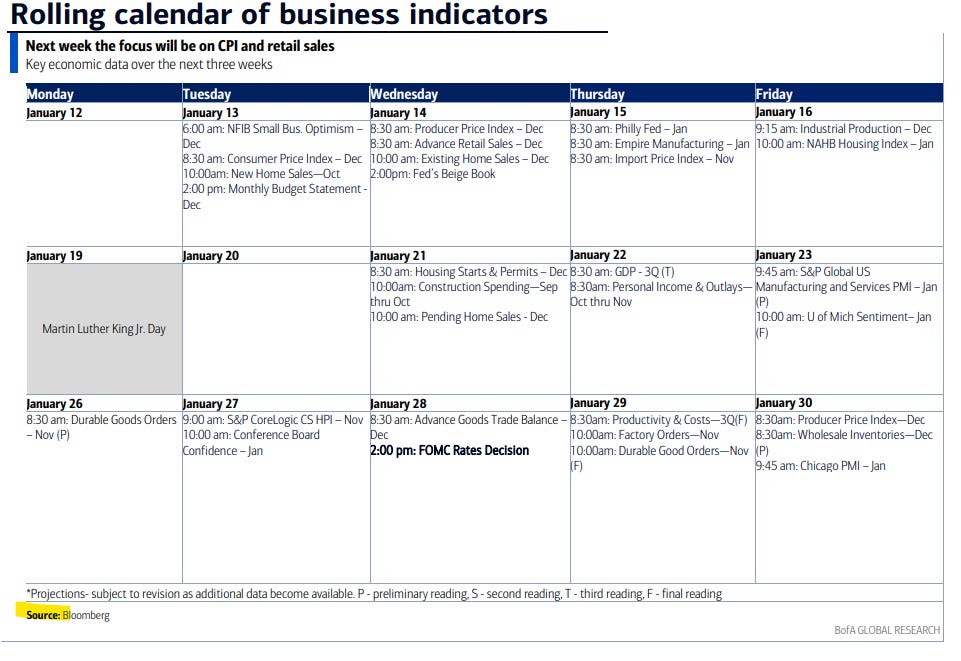
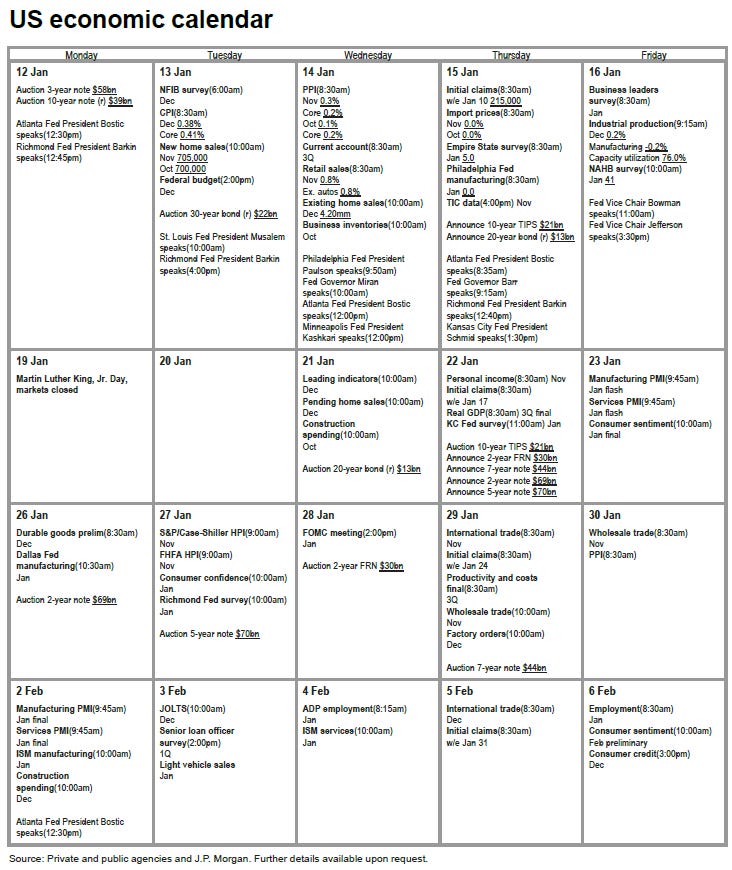
US economic data remains heavy next week with a shift, as is normal for the week including the 10th, to inflation with a (finally) on schedule Dec CPI, but delayed (Nov) PPI and import prices.
We’ll also get delayed (Nov) retail sales, new home sales and (Oct) biz inventories reports, and on-time (Dec) industrial production, existing home sales, NFIB small biz sentiment, and (Jan) NAHB home builder sentiment reports along with the normal weekly reports (ADP employment update, jobless claims, mortgage applications, and EIA petroleum inventories). There are also a couple of regional Fed PMIs.
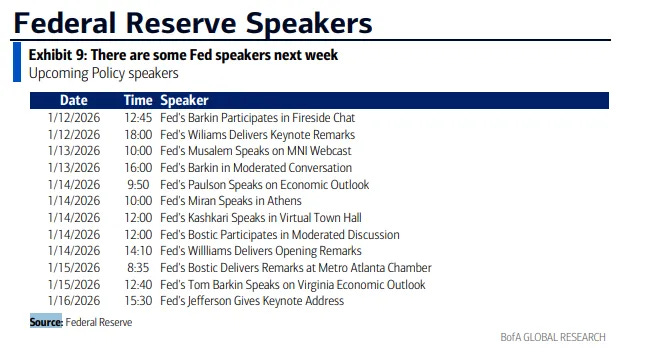
Plenty of Fed speakers on the calendar, with highlights NY Fed Pres Williams (who as a reminder tipped the markets ahead of the FOMC cut), Fed Vice-Chair Jefferson (who along with Powell and Williams form the “core” of the committee), Gov Barr (who had been aligned with the core but has split off in a more hawkish direction of late) and Gov Bowman (not on the lists below but speaks Friday; I was interested in hearing her last week to see if she has reigned in her dovishness after being removed from consideration as Fed Chair, but she didn’t touch on monetary policy, maybe this week). We’ll also hear from Gov Miran (who speaks quite frequently) along with regional bank presidents Barkin (several times after 2x this week), Bostic (retiring in Feb), Musalem, Paulson, Kashkari, and Schmid, but of those just Kashkari and Paulson vote in 2026.
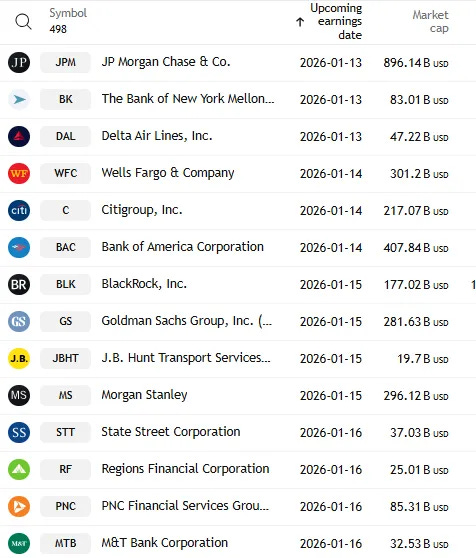
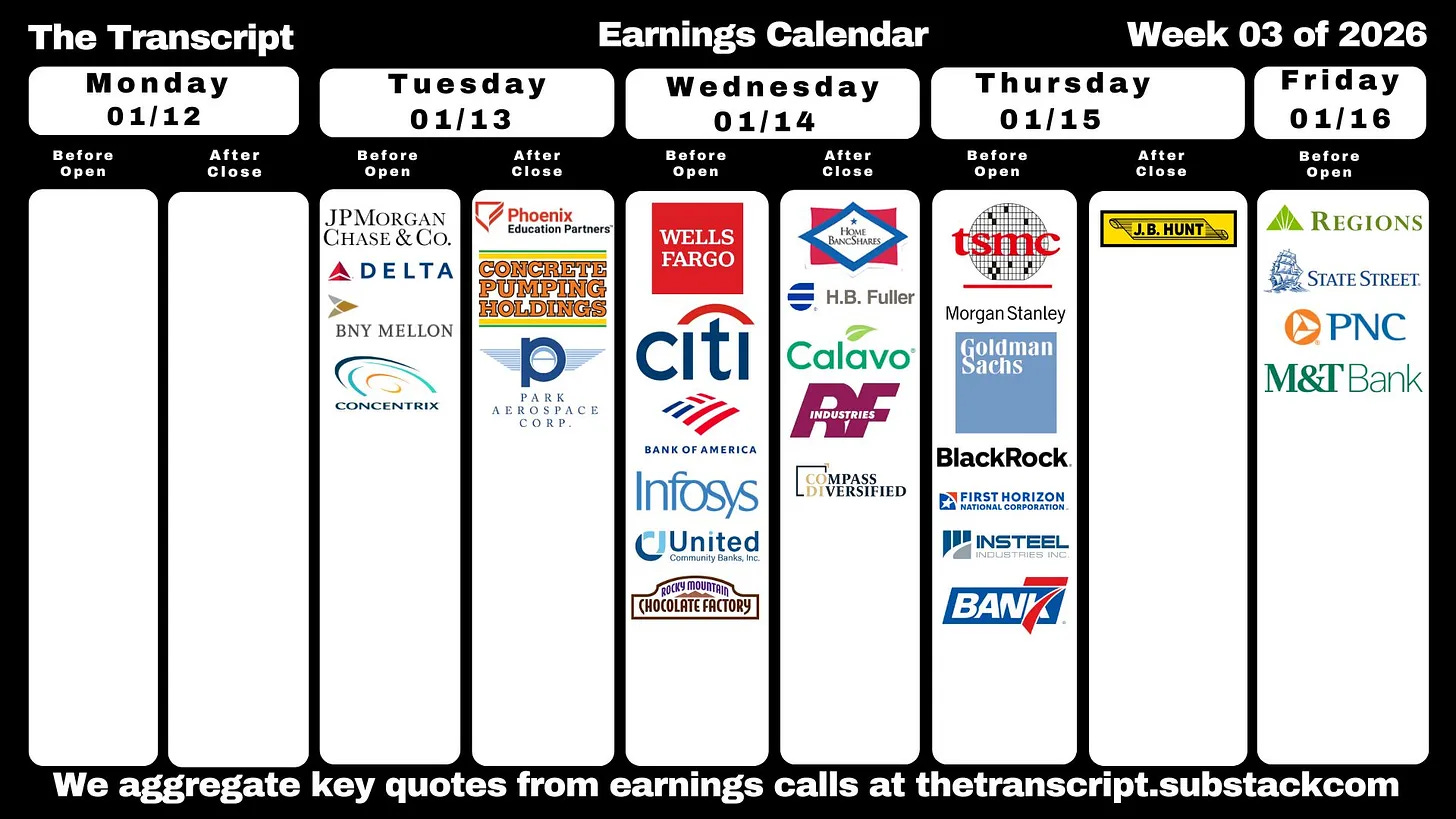
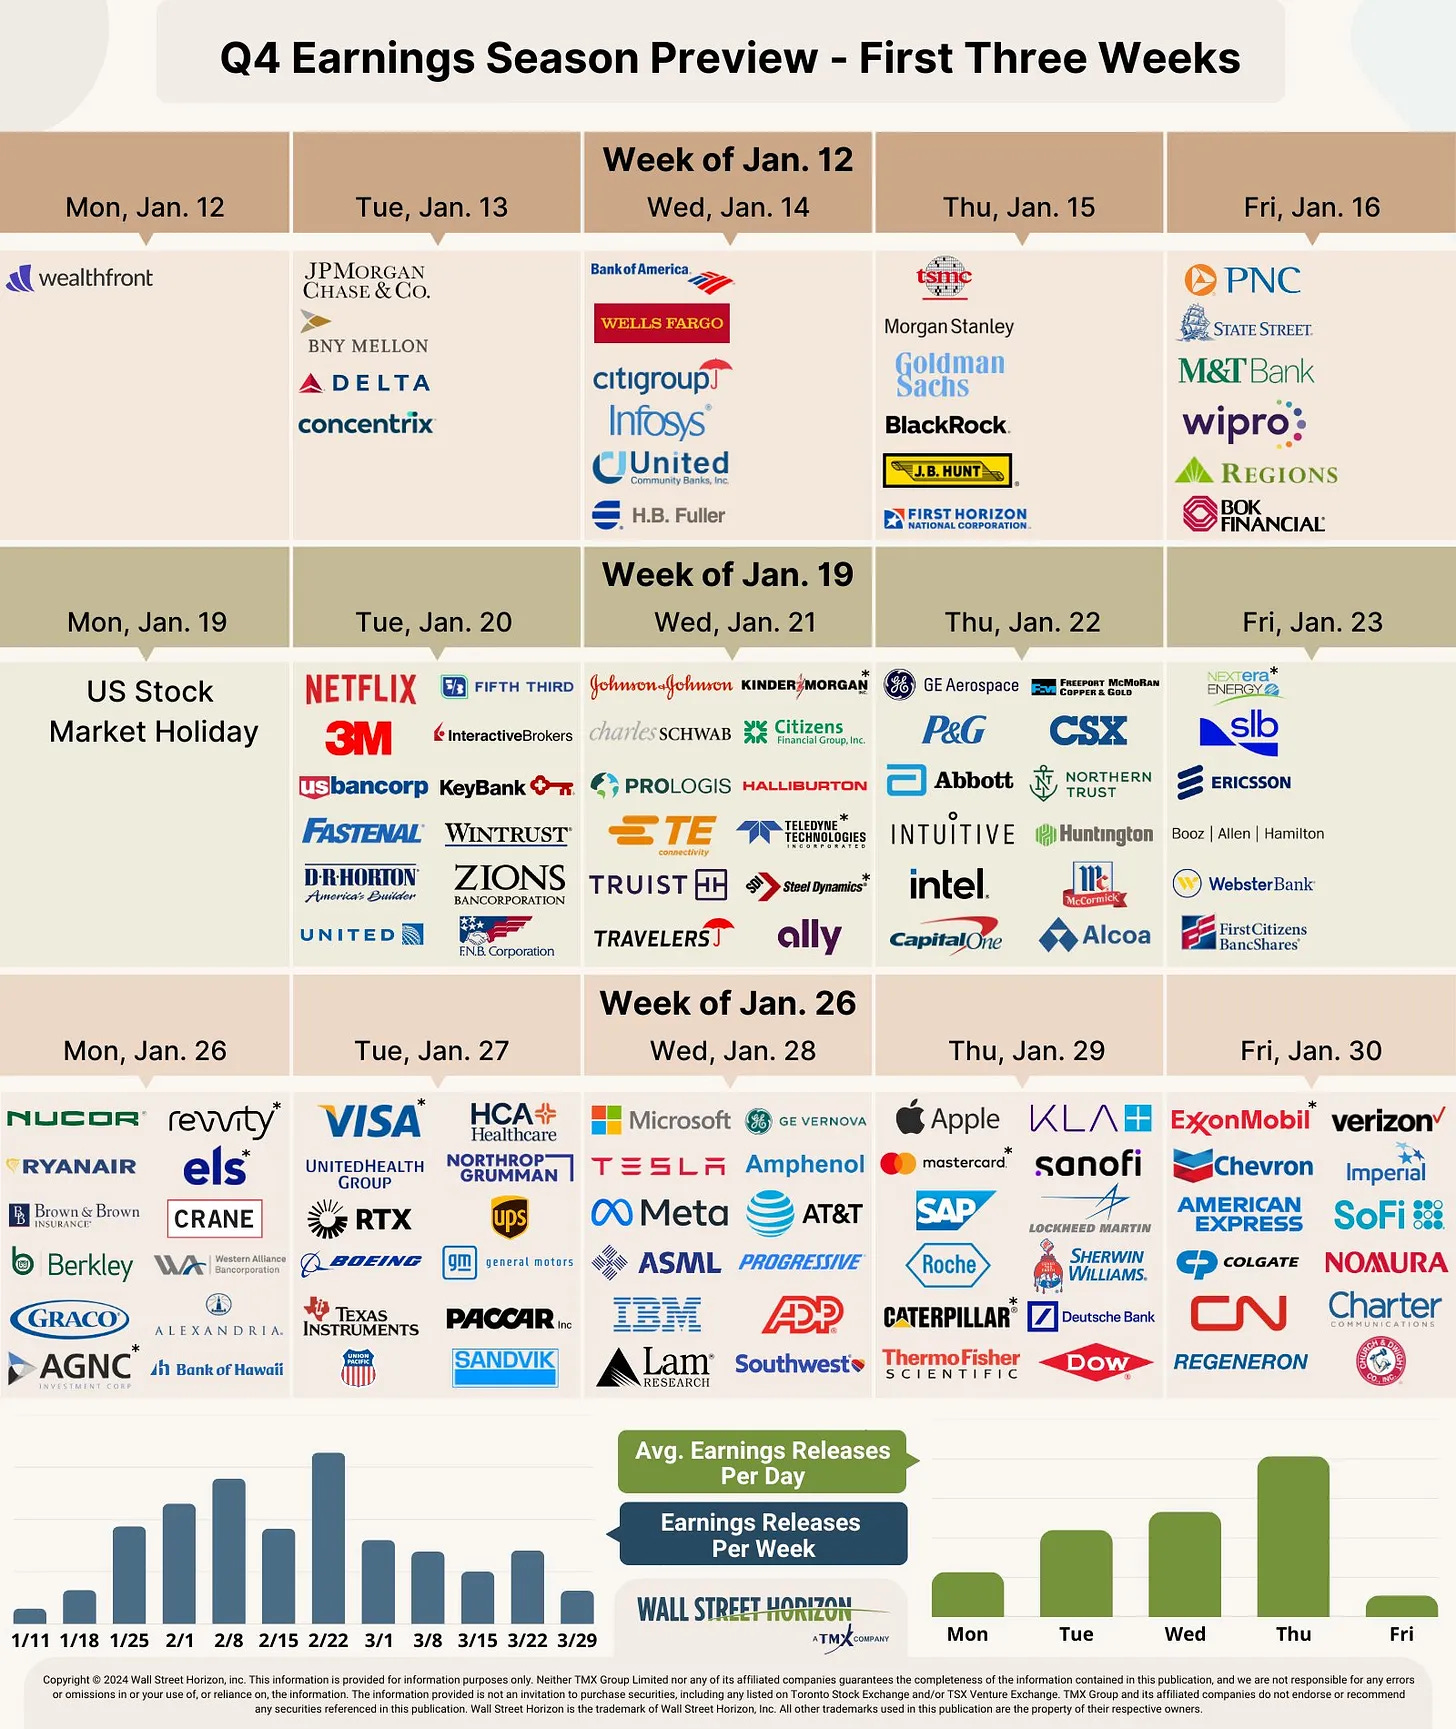
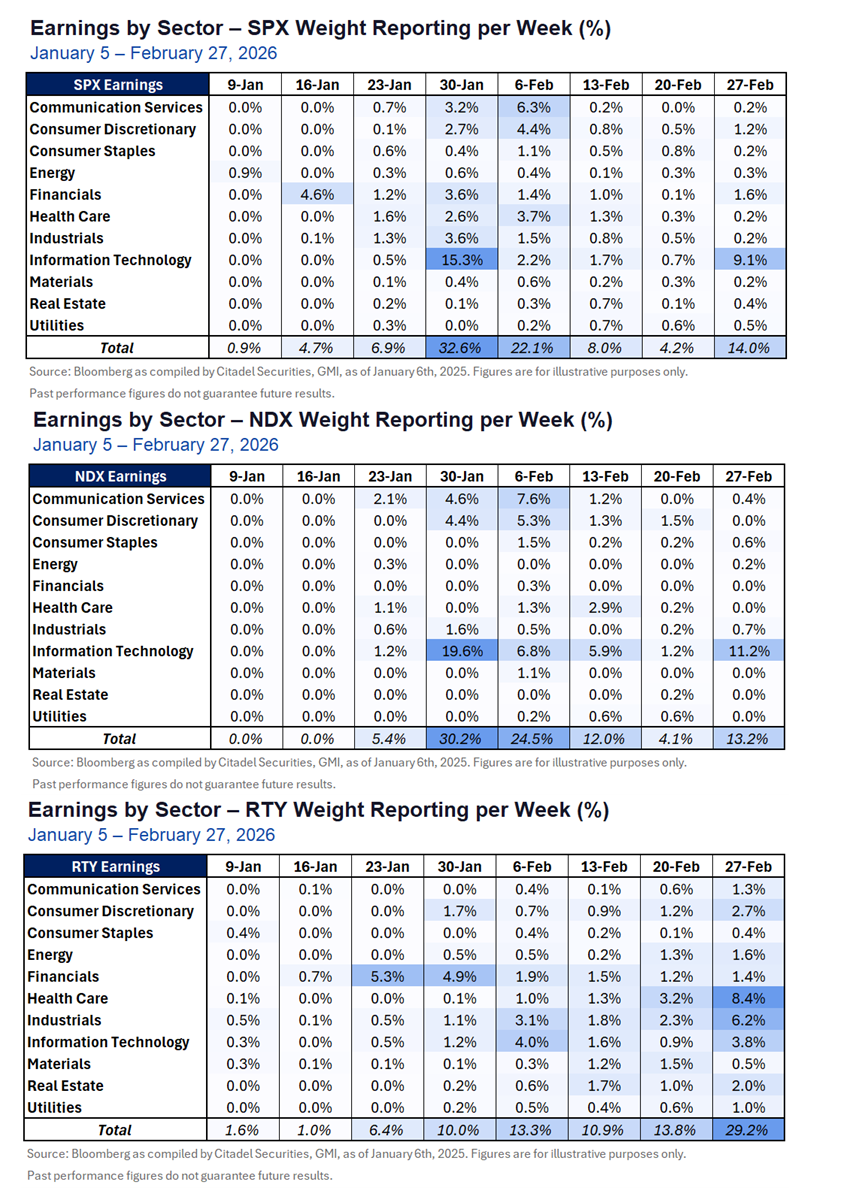
SPX earnings also take center stage in the upcoming week as we unofficially kick off Q4 earnings season on Tuesday with JPM. They are one of 14 SPX reporters, half of which are >$100bn in market cap in JPM, WFC, C, BAC, BLK, GS, MS (in order of reporting date).
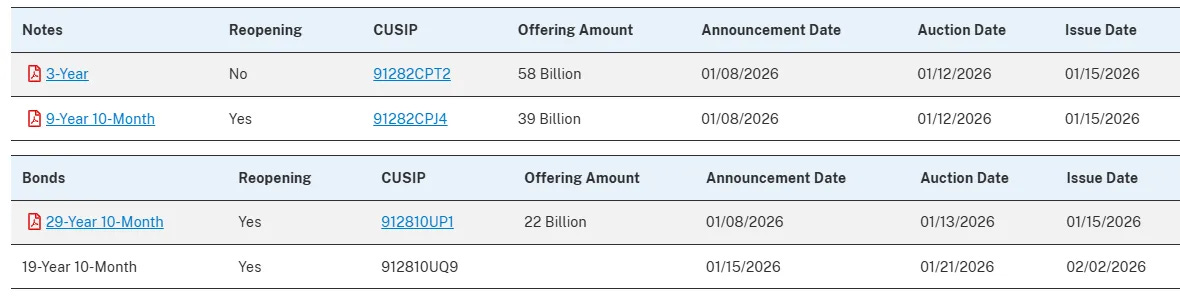
And Treasury auctions also pick back up with 3, 10, and 30yr auctions (the latter two reopenings) but for some reason they’re on a compressed schedule with the former two on Monday and the latter on Tuesday (no idea why as there’s no holiday, month-end, Fed meeting, etc., so feel free to let me know if you know).
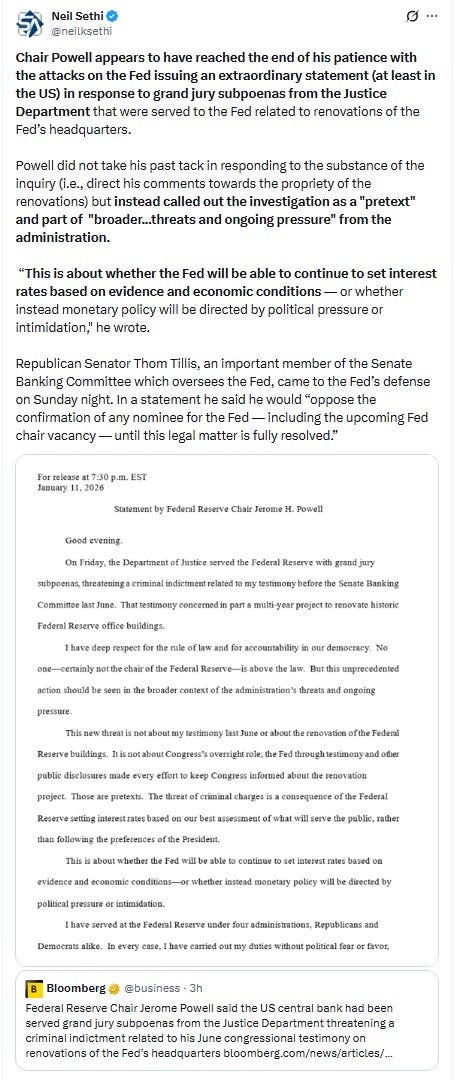
We’ll also get another “opinion day” from the Supreme Court Wednesday. As with Friday, there’s no indication on what will be released, but expect another big leadup to that release. And it appears that the Fed has been served grand jury subpoenas. Hopefully it blows over as other challenges to the Fed independence have so far, but with Powell finally standing up to Trump, it may be something that leads to some market turbulence.
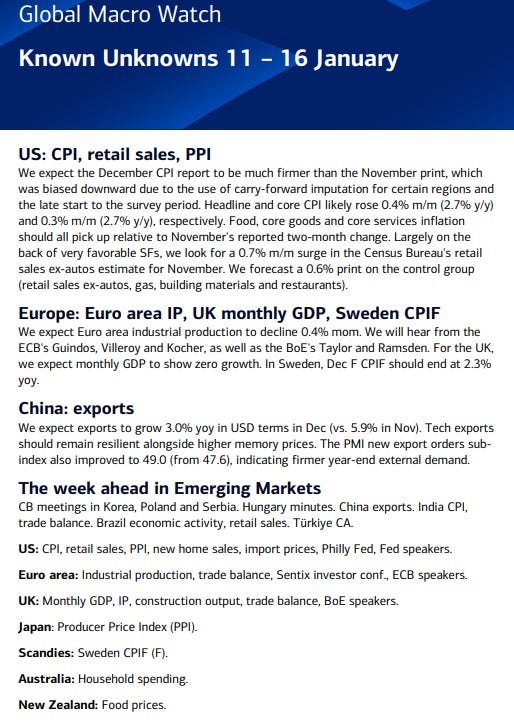
Ex-US it’s a lighter week with highlights UK and Germany GDP, China and Japan trade figures (and China new loans), and a number of other regional reports. The highest profile central bank with a decision is S Korea. Also, Group of Seven finance ministers are meeting in Washington at the start of the week. In addition to the G-7 representatives, officials from Australia, South Korea, India and Mexico will be in attendance.
Canada
Statistics Canada will release data on securities transactions after a surge in foreign investment in Canadian equities and bonds. It will also publish manufacturing and wholesale sales figures. Travel data are expected to show a continued drop in Canadian trips to the US, while sub‑provincial population estimates will point to the impact of tighter immigration policies.
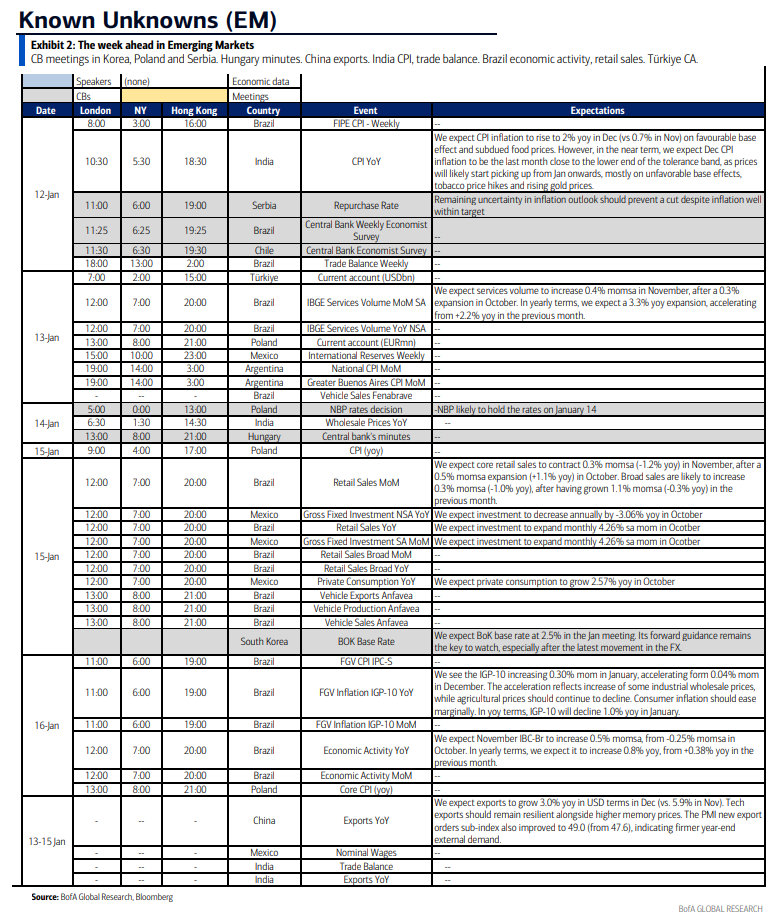
Asia
Asia’s data calendar will give policymakers and investors fresh clues on how growth and inflation dynamics are evolving, with key releases from China, Japan and Australia testing whether recent trends are gaining traction. The week opens with China’s financial data for December, including aggregate financing and new yuan loans. Trade and foreign direct investment figures later in the week will provide further clarity on the health of the Chinese economy.
India takes center stage with December inflation on Monday. The report will influence how investors read the balance of risks for the Reserve Bank of India, which cut its key rate by 25 basis points in December, to 5.25%. On Thursday, India releases unemployment and trade figures. Attention then pivots to Australia, where ANZ job advertisements and household indicators will help shape expectations about the central bank’s next move. Westpac’s consumer confidence survey on Tuesday comes after Reserve Bank officials have signaled an end to the current easing cycling, reiterating a cautious stance as price pressures stay elevated.
Japan’s heavy midweek calendar is a focal point for markets assessing whether the Bank of Japan will remain on its hiking path. Balance of payments and trade figures will offer insight into the impact of the weak yen on exports and income flows. Producer price data is due later in the week. The Bank of Korea is expected to hold its policy settings steady on Thursday, with the focus on whether authorities may signal the easing cycle has run its course.
South Korea also releases labor market and trade price data, while New Zealand’s employment and building permits may cast light on the Reserve Bank of New Zealand’s potential policy stance. Southeast Asia rounds out the week with a gross domestic product update from Malaysia, reserve data from Thailand, and non-oil exports from Singapore.
Europe, Middle East, Africa
Germany will take the spotlight with what’s traditionally the first statistical estimate of full-year growth for any G-7 country. The 2025 data, due on Thursday, will give an indication of its performance in the fourth quarter, when green shoots may have begun to sprout in Europe’s biggest economy. Recent data showing the largest jump in factory orders in a year, as well as an unexpected third month of gains in industrial production, signal that a recovery could be taking hold. Still, Chancellor Friedrich Merz has warned that parts of the economy remain in a “very critical state.”
In the wider euro zone, industrial production numbers for November, also on Thursday, will offer a glimpse of the strength of growth across the region. France, Spain and Italy will all release final inflation numbers toward the end of the week, offering details that will feed into a fuller gauge for the currency area. An initial estimate published on Wednesday showed price growth in the euro region exactly at the European Central Bank’s 2% goal. Vice President Luis de Guindos is among a handful of ECB officials set to make appearances.
In the UK, monthly GDP data may show growth resumed in November after a surprise contraction at the start of the quarter. That report is scheduled for Thursday. Bank of England officials speaking the previous day include Deputy Governor Dave Ramsden and rate-setter Alan Taylor. Russian data on Friday is likely to show slower inflation, though the central bank has expressed concern it may not be sustainable amid elevated expectations, the potential impact from an increase in value-added tax, and higher regulated tariffs. At their last decision, officials warned that “monetary policy will remain tight for a long period.”
A few monetary decisions are on the calendar: In Serbia on Monday, officials will reveal if they’re extending a period of steady rates that’s lasted for more than a year. Two days later, Poland’s central bank will weigh whether to cut borrowing costs for a fifth straight meeting after another downward inflation surprise. Angolan policymakers will likely reduce rates on Wednesday for a third time in a row as price growth continues to slow.
Latin America
A light week kicks off with central bank readouts in Brazil and Chile. Banco Central do Brasil’s most recent Focus survey saw a tick up in its 2026 inflation estimate, while expectations in Chile were modestly lower and showed convergence with the central bank’s target. Both the monthly and annual prints in Argentina’s December consumer prices report, to be posted on Tuesday, may have drifted slightly lower. A pickup in consumer prices in November snapped an 18-month run of lower annual readings, after inflation hit 289.4% in April 2024.
December’s forecast readings strongly suggest that the rapid, headline grabbing success of President Javier Milei’s inflation fight since taking office in late 2023 are history — a far slower pace of disinflation is on the cards for the year ahead. In Peru, the December jobs report for Lima and November GDP-proxy data are both due. The unemployment rate in Peru’s capital has been below 6% since August, while economic activity has been running near long-term trends.
Brazil’s economy has cooled under pressure from the central bank’s take-no-prisoners monetary policy — keeping the key rate near a two-decade high of 15% since mid-2025. The early consensus sees a moderate uptick in growth from October, even as Latin America’s biggest economy lost steam into year-end.
DB one-pager:

BoA’s cheat sheets:
Market Drivers
So let’s go through the list of items that I think are most important to the direction of equity markets:
Fed/Bonds
As noted previously this was one of the sections that had grown unwieldy, so I’ve really pared it down (I know, it’s still really long). Given I provide daily updates on Fed expectations, Fedspeak, and analyst thoughts on the Fed, it’s duplicative (and time consuming) to regather it all, so, again, I encourage you to look at those (the daily posts) for updates. I will just give more of a quick summary.
I’ve taken out the background information from how we got to where we were from the start of the year through the end of March, but if you’re interested you can find that in this section from the March 23rd update. And I had left in the background from March the August as I had said it was “still relevant in terms of ‘how we got here,’ and it reflects the continued slow evolution of the Fed away from worries about tariff impacts on inflation towards the need for rate cuts (remembering that absent those tariff worries the Fed would already be cutting at this point).” But I had “[a]t some point the hawks will become less hawkish and then I’ll reset all of this…. Powell this week could seal the pivot, but remains to be seen.” Well that’s exactly what Powell did, so if you’d like that background, you can find it at the August 17th update. In addition, I have taken out the “next phase” in the Fed’s evolution (from the August meeting leading up to the October meeting). You can find that material at the October 19th update.
As I said last week after the release of the FOMC minutes:
This to me is a very dovish setup. Inflation doesn’t have to come down “in the near term” to allow for further rate cuts, and all the members agree that if there is any further softening in the labor market (and a 4.7% unemployment rate in the upcoming payrolls print could do it) more cuts are also coming. So really only if inflation goes the wrong way and the labor market doesn’t deteriorate will we not see more cuts this year. Note, there is no discussion of weak growth required. As a side note, it seems to me, based on previous speeches and the way productivity operates, the “forward looking” group is assuming that productivity will be helping to keep inflation in check despite what seems to be healthy economic growth. That makes this week’s productivity report (although for 3Q) important.
That remains the case, but with inflation in the NFP last week softening two tenths (including revisions) to 4.4%, and job growth, while missing estimates not that far off and the household survey seeing strong job growth (even as there are a host of weaker metrics such as sector breadth of job gains, involuntary part-time workers, a falling workweek, slowing aggregate income growth, etc.), the chance of a Jan rate cut has effectively fallen to zero.
That means even if we get a cool (even very cool) CPI print, given all of the distortions in that series introduced by the shutdown, it will require an affirmative declaration from a key Fed member (a la Williams speech ahead of the Dec FOMC) to get markets “onsides”. So unless/until you hear that, there will be no cut this month.
And markets think that actually extends all the way into June at this point.
The 2/10 Treasury spread edged back to +0.64% last week from the highest since Jan ‘22.
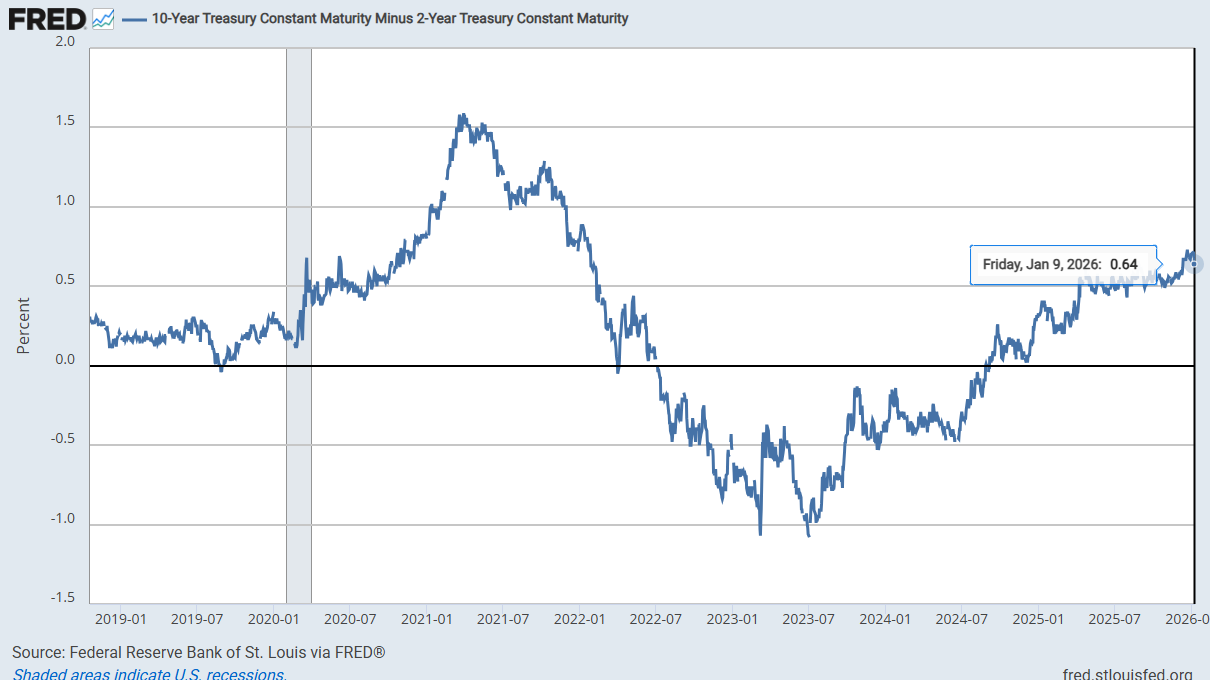
As a reminder, historically when the 2/10 curve uninverts following a long period of inversion the economy is either in a recession or within a few months of one. It uninverted in Sept, so I had said this looks officially like a “this time is different” situation as we’re now over a year. Anything that has a lead time that long is not really useful.
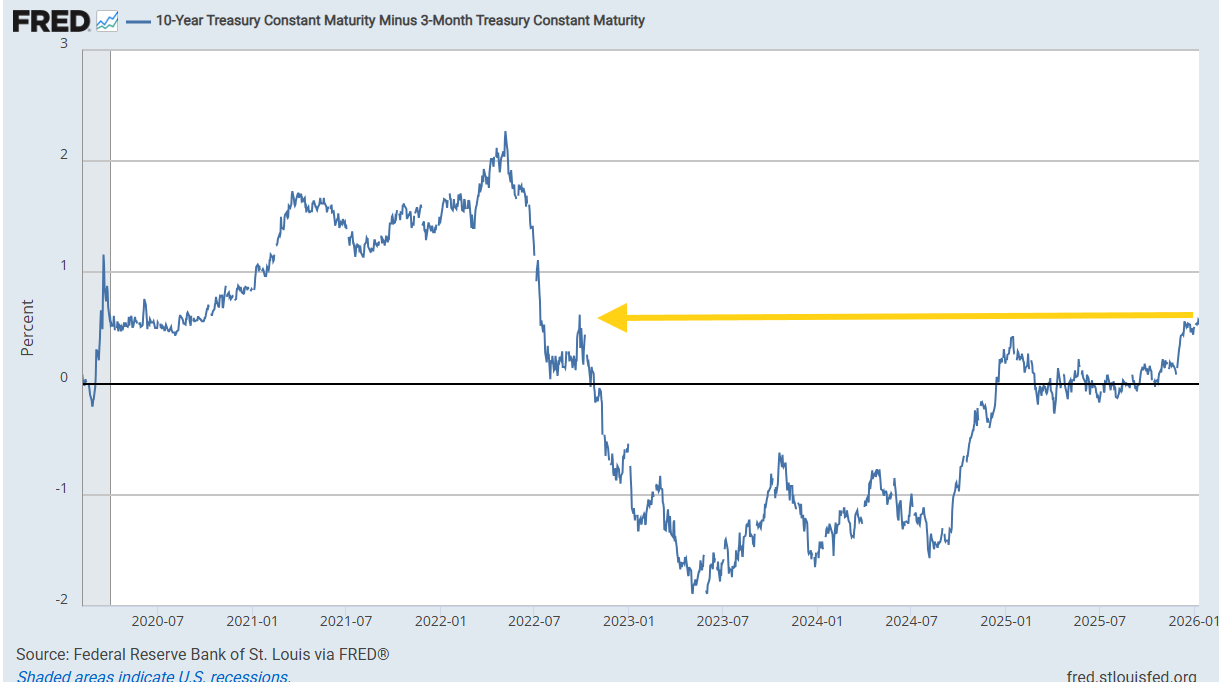
The 3mos/10yr yield curve though edged to the highest since Oct ‘22 at +0.57%, still calling for more rate cuts or a move higher in 10yr yields (this is historically around +1.25%).
Note this curve is considered a better recession signal than 2/10’s w/the last four recessions on average coming a few months after the curve uninverted (prior to that it generally uninverted after a recession had already started)).
It had spent nearly a year within a quarter point of 0%. The only other comparable period (inversion followed by a long stretch around 0%) was 1989 when it spent the year within a slightly larger band (but after a much smaller inversion). When it finally lifted after that instance a recession followed six months later. This is NOT to say I think we’ll see recession in 6 months (quite the opposite).
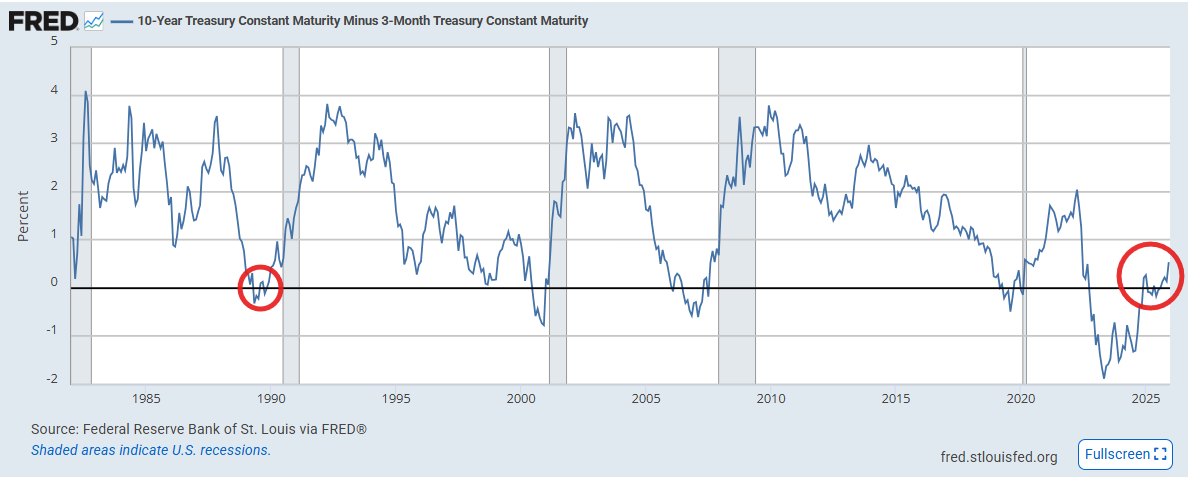
Also, as noted back in February, reinverting is something that it did prior to (or just after) the last two recessions and it also dipped (but didn’t reinvert) in the two recessions prior to that, although this one was much more mild than previous. Regardless, the longest it went in those previous four instances before recession after reinverting is 6 months (2007).
Also note that in 1989 and 2007 we saw similar periods of a recovery from inversion that stalled at the zero line for long periods of time which turned into recessions after they finally started to steepen again (but in 1989 it took six months (we’re beyond that now)), but see the note above about the length it spent around the zero line.

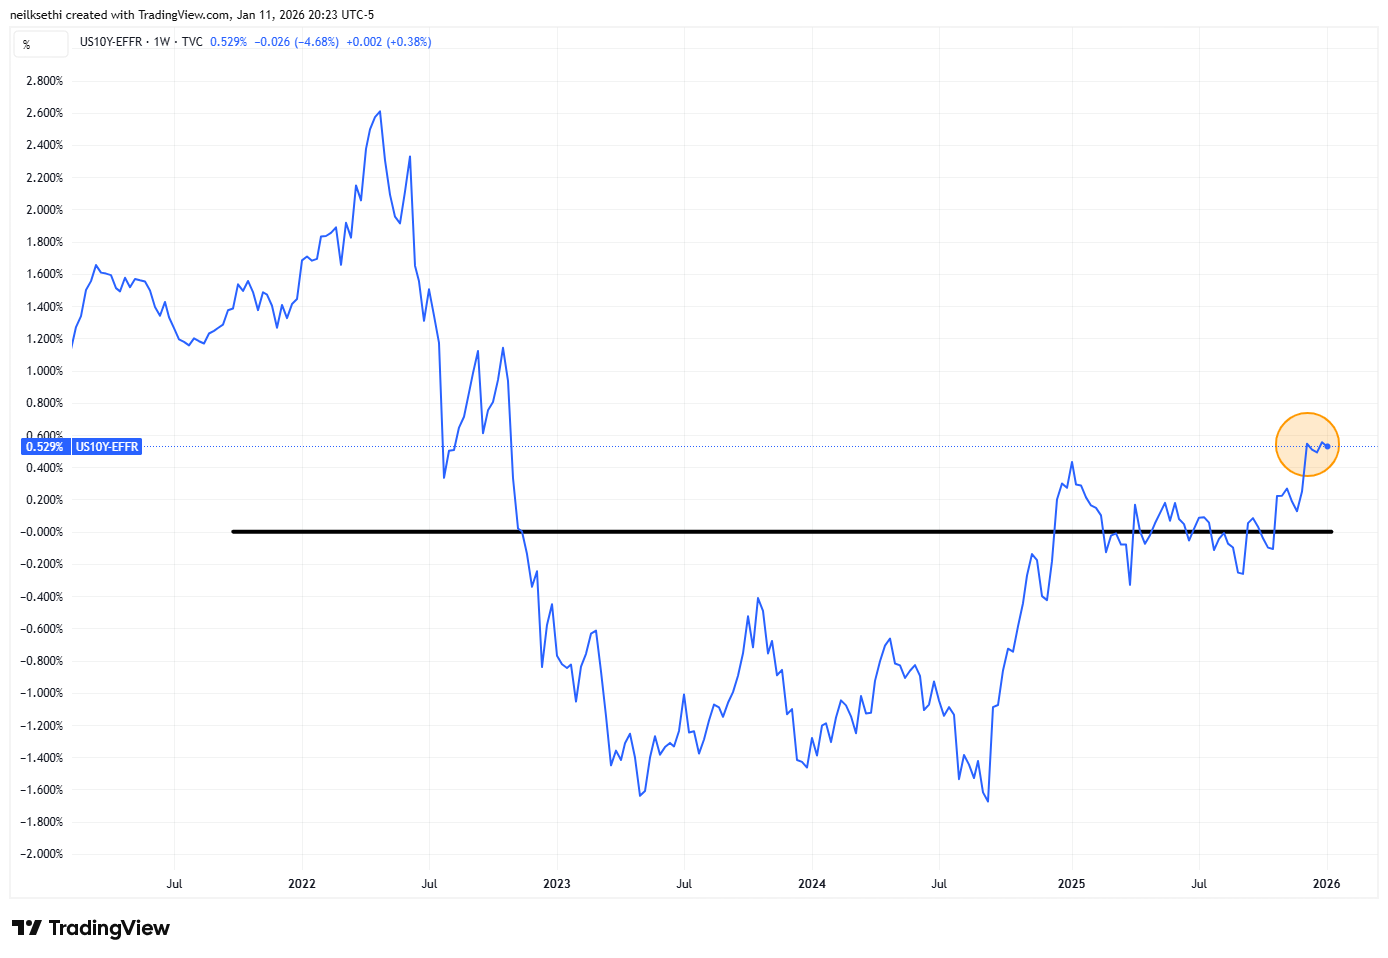
Similarly the 10yr Treasury yield is now more comfortably above the Fed Funds midpoint (and the EFFR), at +53bps (where it’s been the last month) still though well under the typical non-recessionaly spread of around 1-1.25%, so calling for another ~50bps of rate cuts (or perhaps if one thinks the 10yr is mispriced, a higher 10yr yield (or some combination)).
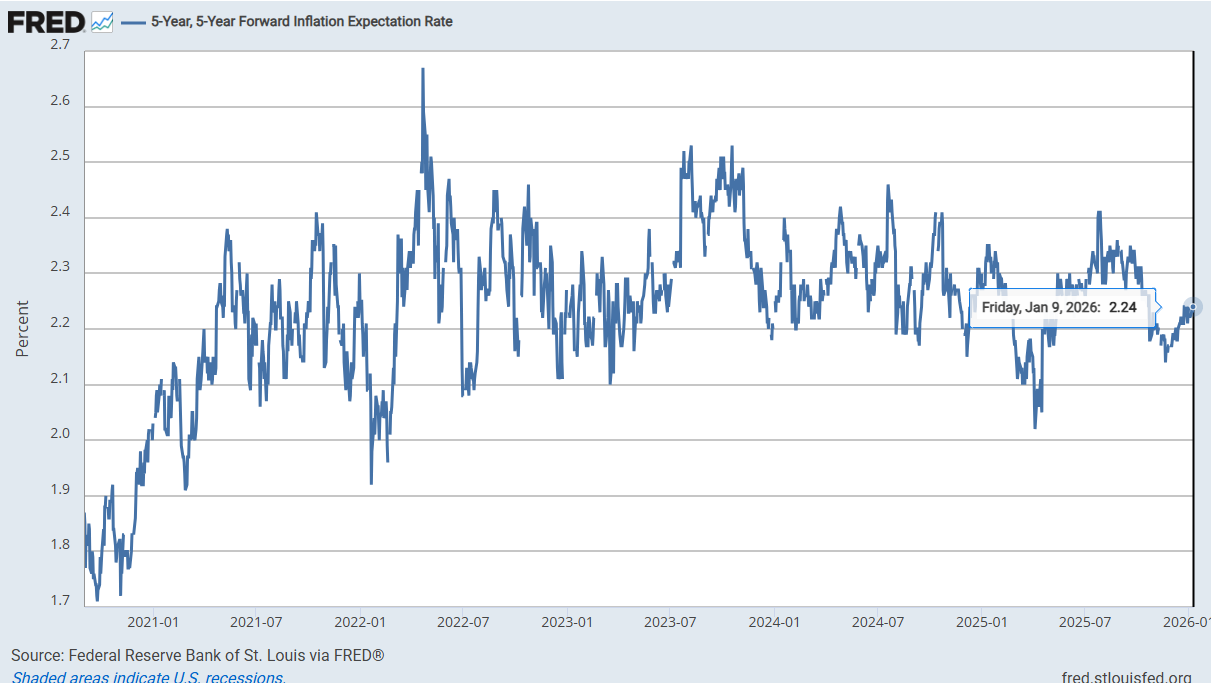
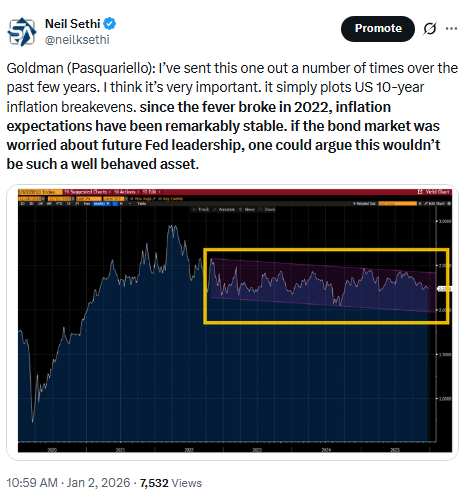
Long term inflation expectations as measured by the 5-yr, 5-yr forward rate (expected inflation starting in 5 yrs over the following 5 yrs) edged back up to 3-month highs at 2.24% but remains still just 8bps from the 2.14% Nov 20th which was the joint the least since April, and before that Mar ‘23, and remaining near the bottom of the range since 2022. They’re also a touch below their 20-yr average (2.25%).
The peak this year was 2.41% July 28th which was the joint highest (with October) in a year) and 2.67% was the post-pandemic peak in Apr ‘22.
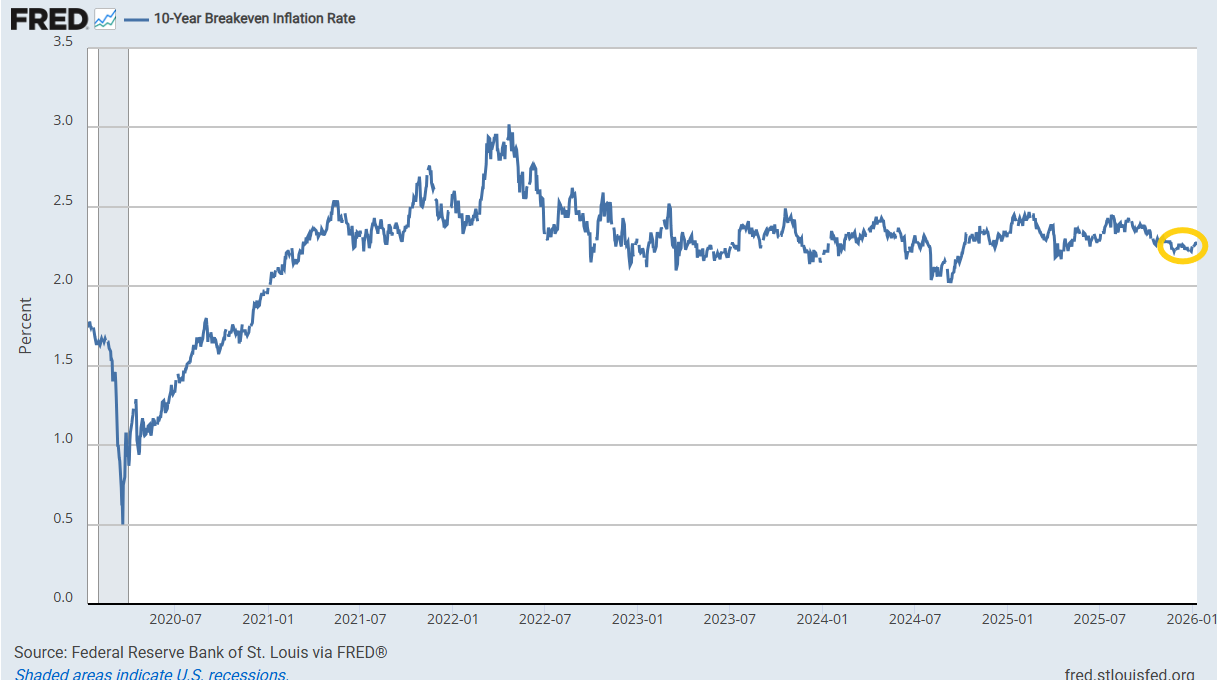
The 10-yr breakeven inflation rate edged up to 2.28% as of Friday, the highest since early Nov, but remaining in its post-2022 range.
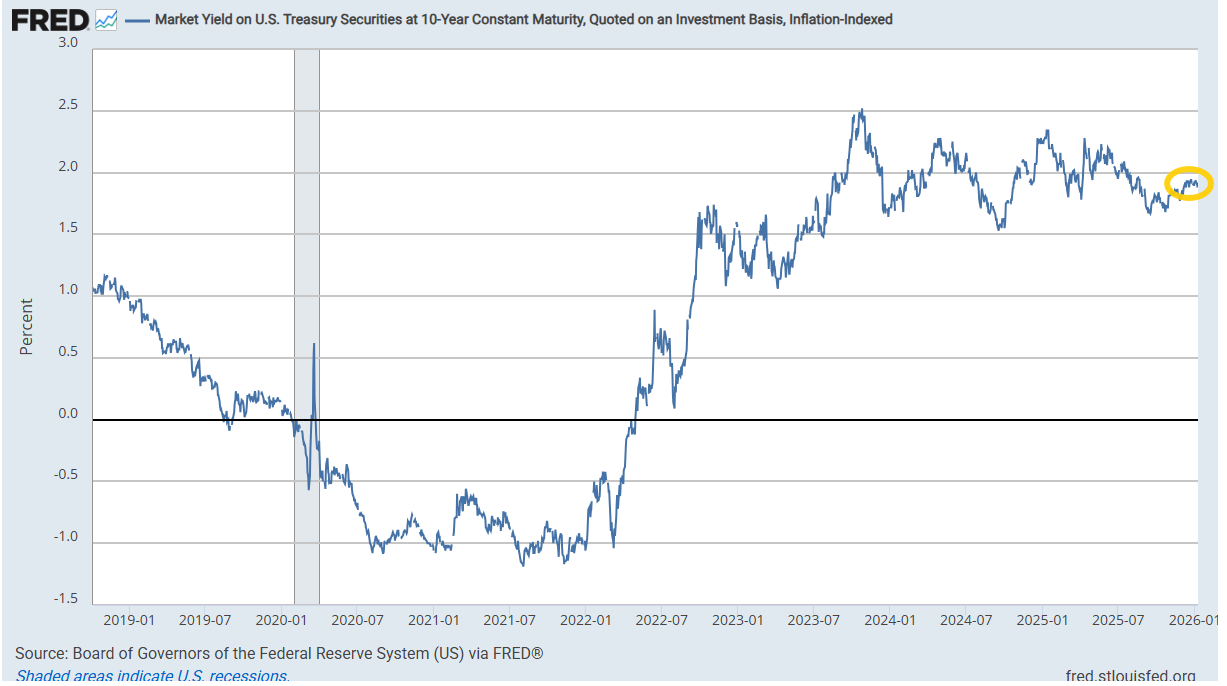
10yr rate real rates little changed at 1.92% last week just off the highest since mid-Aug, but overall remaining in their range since Aug 2023.
They are still well below the 2.34% in mid-Jan (which was the highest since Oct ‘23 (and before that 2007)), but also still well above the 2012-2020 peak of 1.12%.
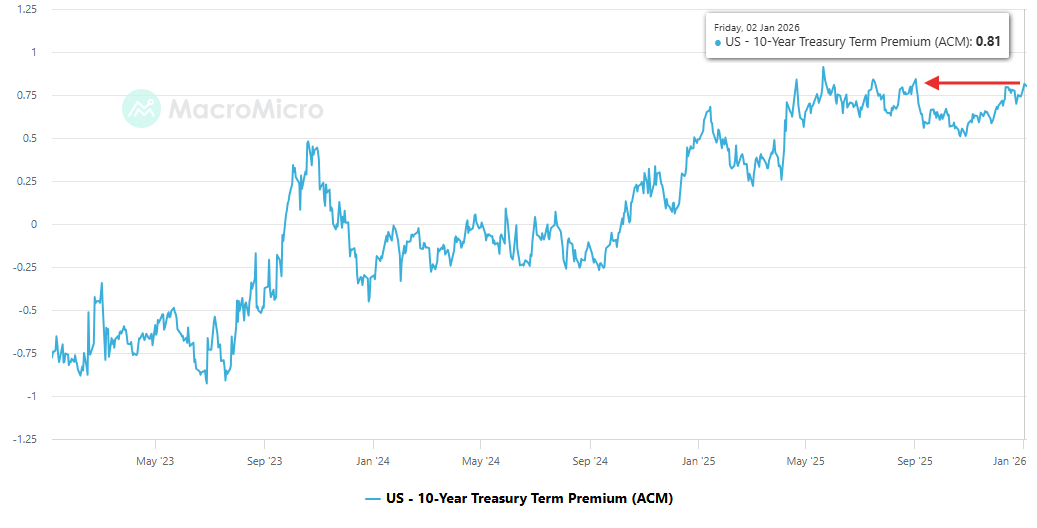
The ACM model of the 10yr #UST term premium (which is solely based on interest rates so has no “external anchor” to help explain why short-term rates may be moving (such as Fed policy expectations)), edged up to +0.81% last Friday, the highest since Sept 2nd, and up from +0.51% Oct 28th (which was the least since April).
The high of the year was +0.91% on May 21st (which was the highest since July 2014). This is up +0.21% since the Oct Fed meeting.
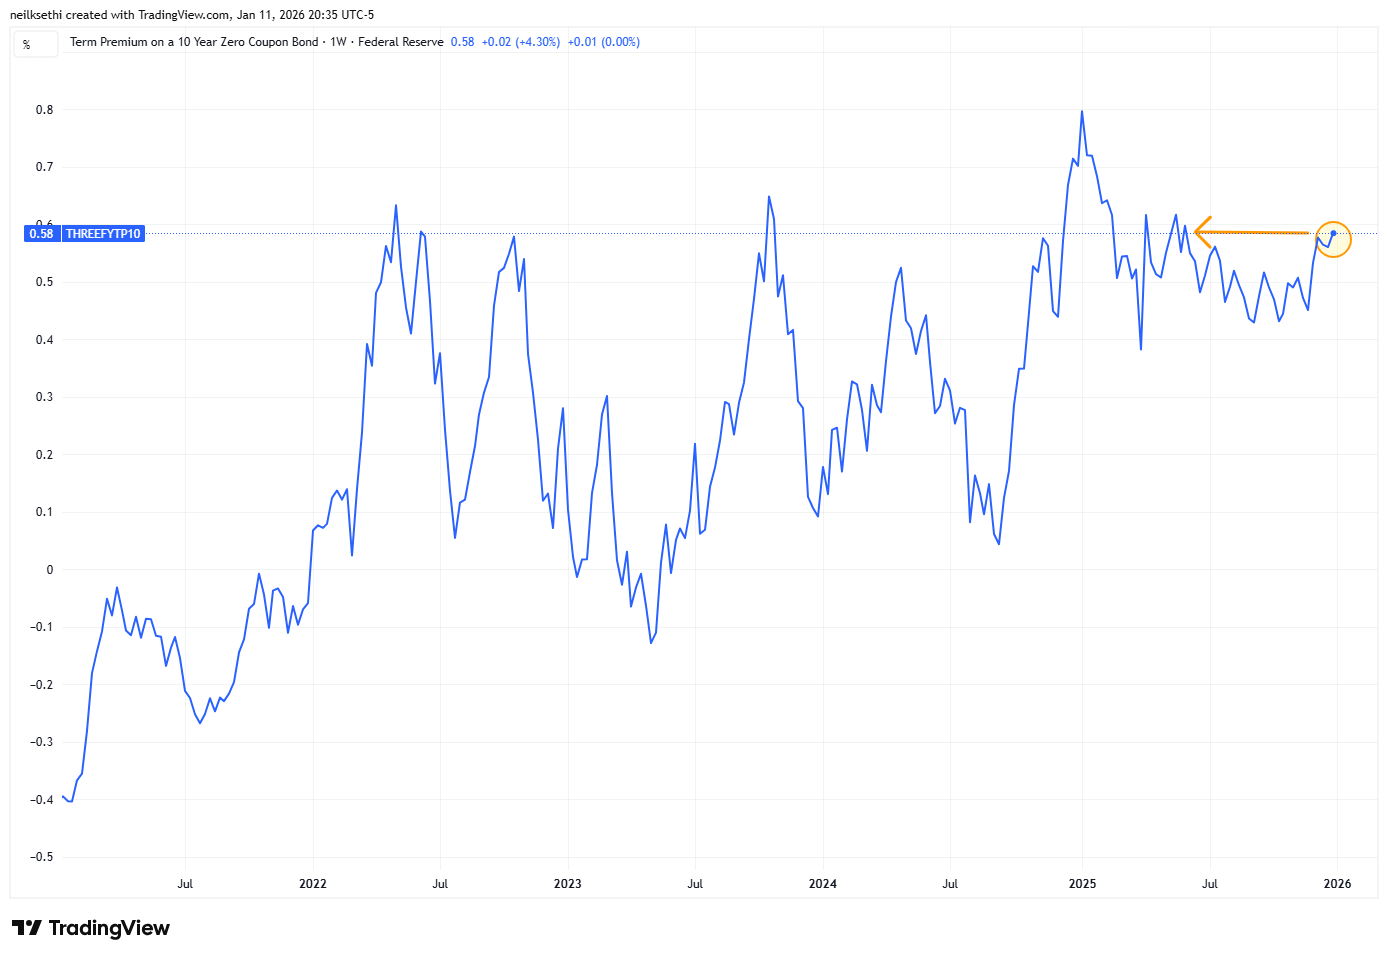
As mentioned above, the ACM model has a weakness in that it looks only at rates with no “anchor” to the external environment. The Kim-Wright model addresses that by adding in an expectations layer (from Blue Chip forecasters) of the expected path of short-term rates. That is just updated through Dec 29th, but that rose to the highest since June at +0.58%.
Unlike the ACM model, the post-pandemic peak was in Jan at 0.80%. The overall message is similar though in that pre-pandemic you have to go back to 2013 to find comparable levels.
The extended discussion on term premium (what it is, why it’s important, etc.), can be found in this section in the Feb 4th Week Ahead.
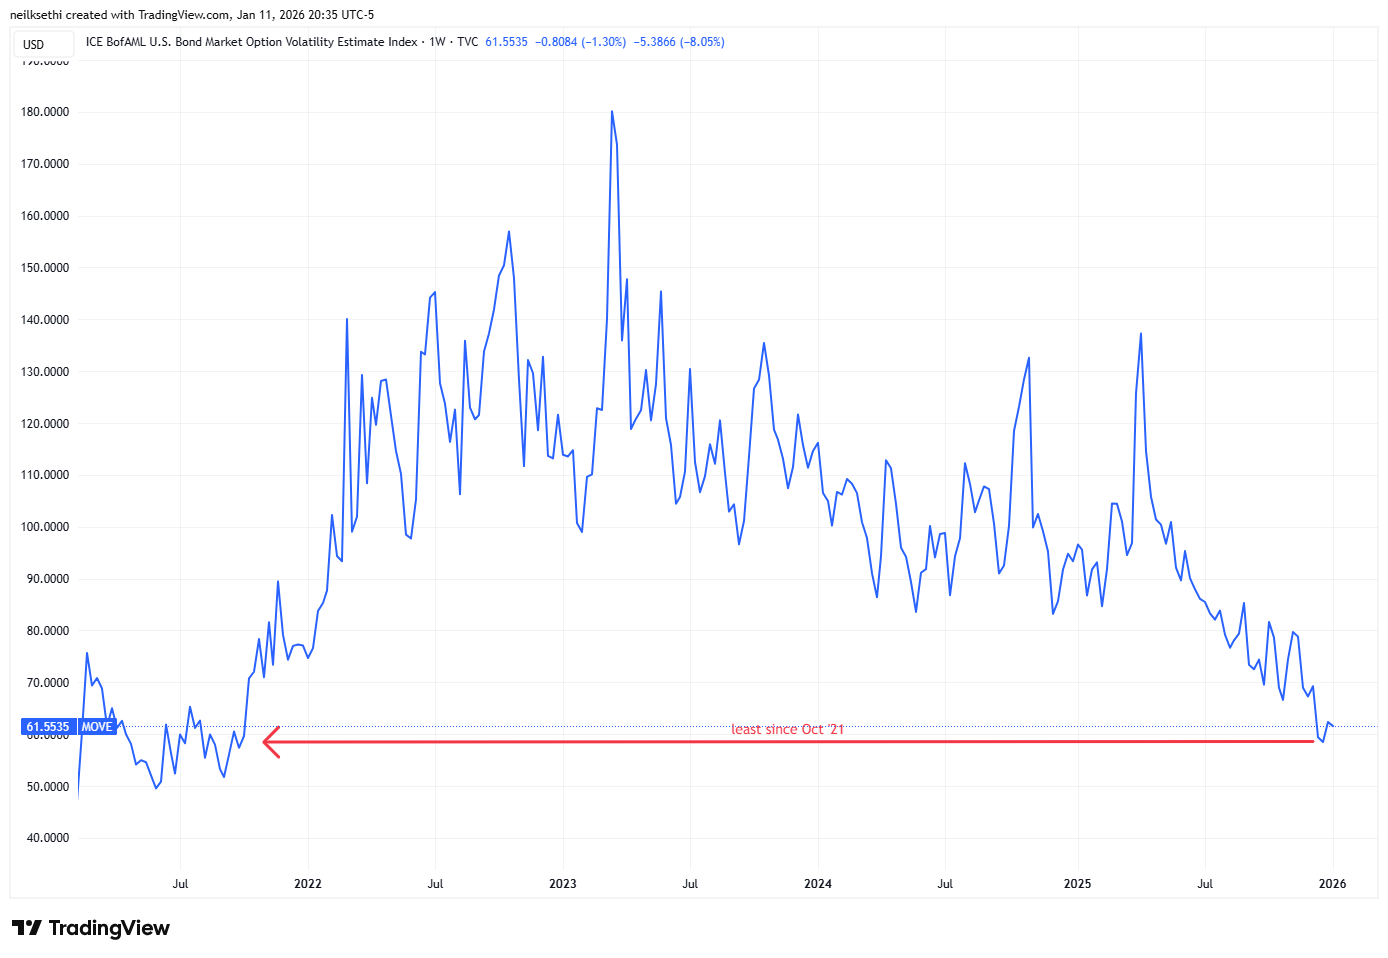
The MOVE index of expected 30-day Treasury note/bond volatility edged lower but at 61.55 remained above the 58.50 two weeks ago which was the least since Oct ‘21.
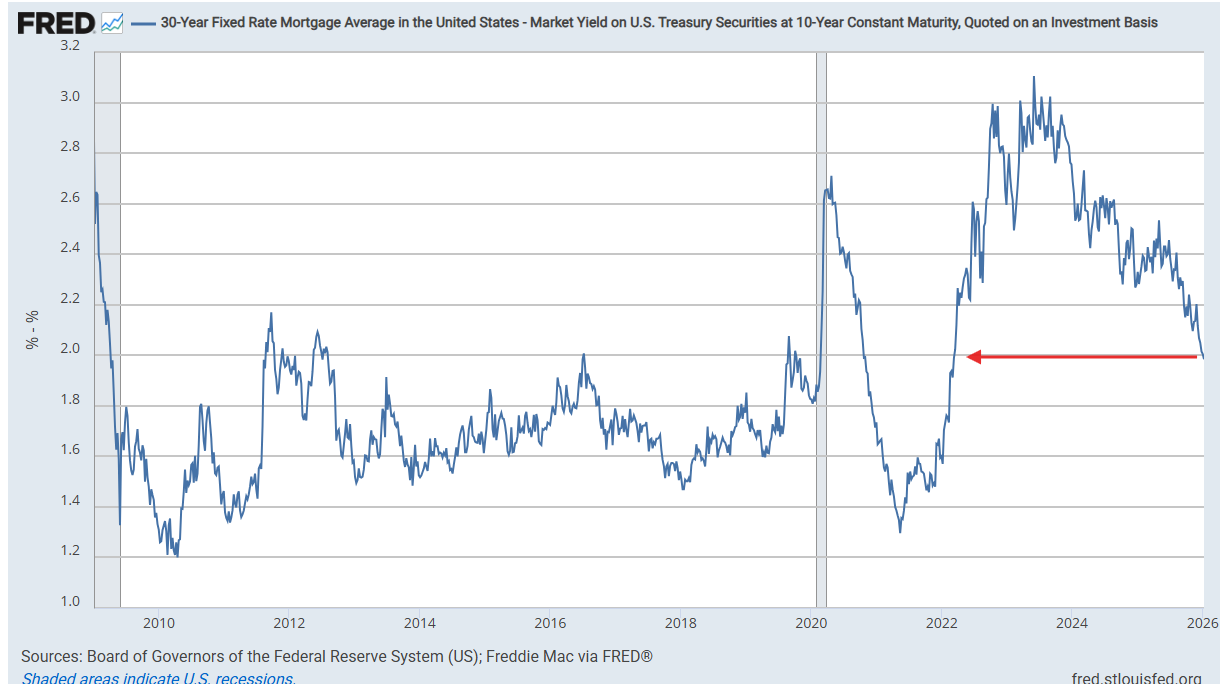
With President Trump’s directing agencies to buy $200bn in mortgage bonds, mortgage spreads (based on the Freddie Mac 30-yr rate) fell under 2% to 1.96% for the first time since March 2022 (when they were surging higher from 1.29% in March 2021 to the 3.1% peak in June 2023 as the Fed tightened rates).
They’ve now fallen under the peaks from the 2010-2019 period but still have some room (~45bps) for them to fall to get to the 2004-2008 avg level of ~1.6% (I use that period as it was like now a period of higher yields than post-GFC and also a period when the Fed wasn’t buying MBS but we had a more robust private market than we had pre-2004). It also happens to coincide with the pre-pandemic 10-year average as well despite the distortions.
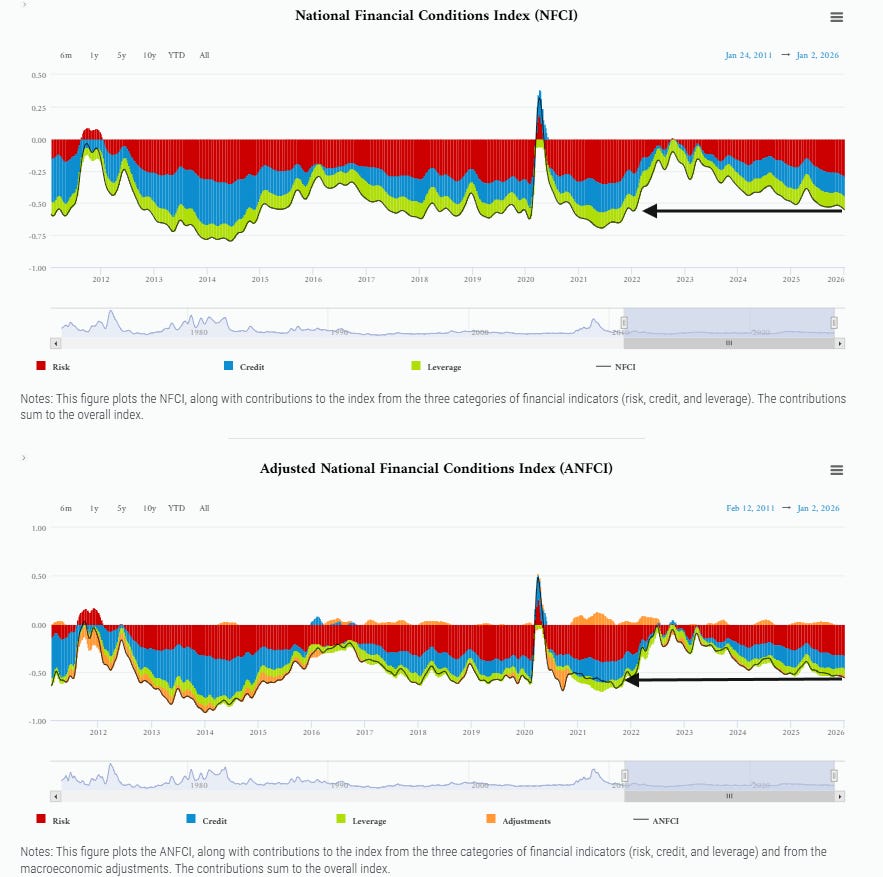
The Chicago Fed National Financial Conditions Index and its adjusted counterpart remained (after revisions) the least (loosest) since Jan ‘22 and Nov ‘21 respectively in the week through Jan 4th.
Both of these indexes are very comprehensive, each w/105 indicators. The “adjusted” version attempts to remove the correlation between the various indicators due to broad changes in economic conditions which also impact other areas (so as to not double count them).
https://www.chicagofed.org/research/data/nfci/current-data
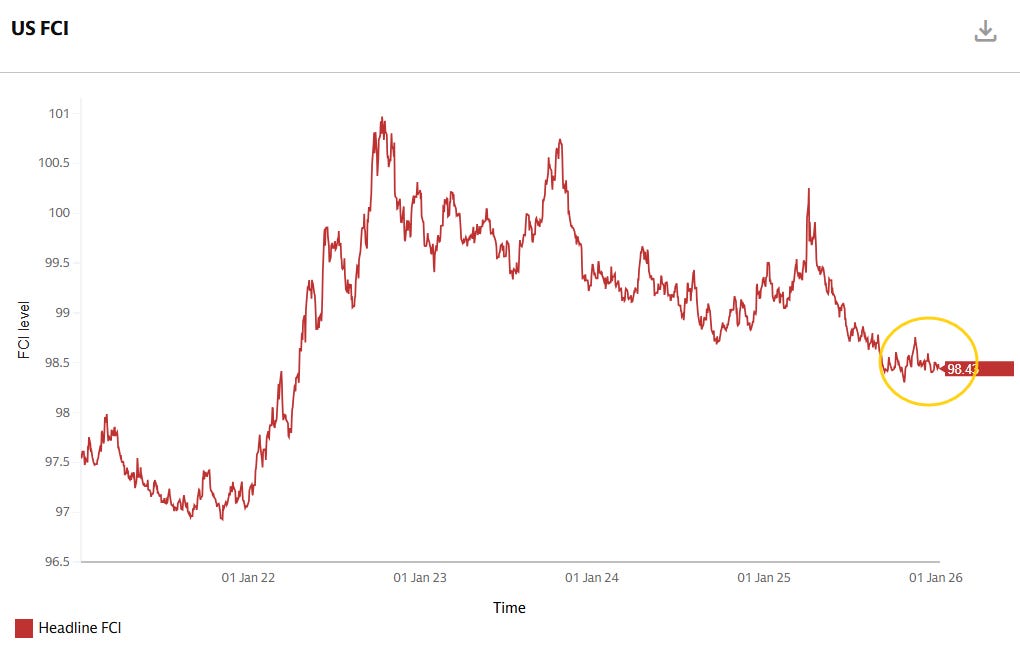
Goldman’s US Financial Conditions Index remained a little above the least since 2022.
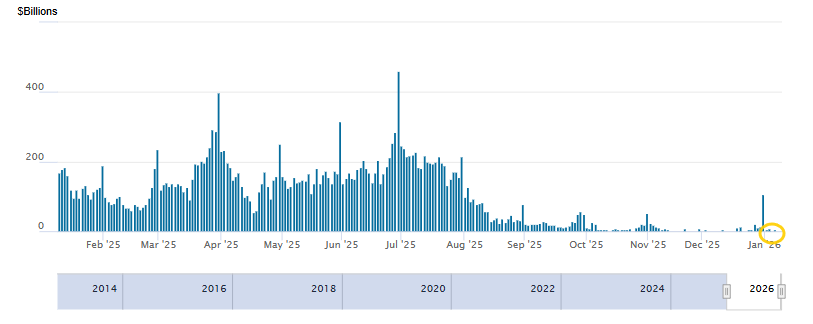
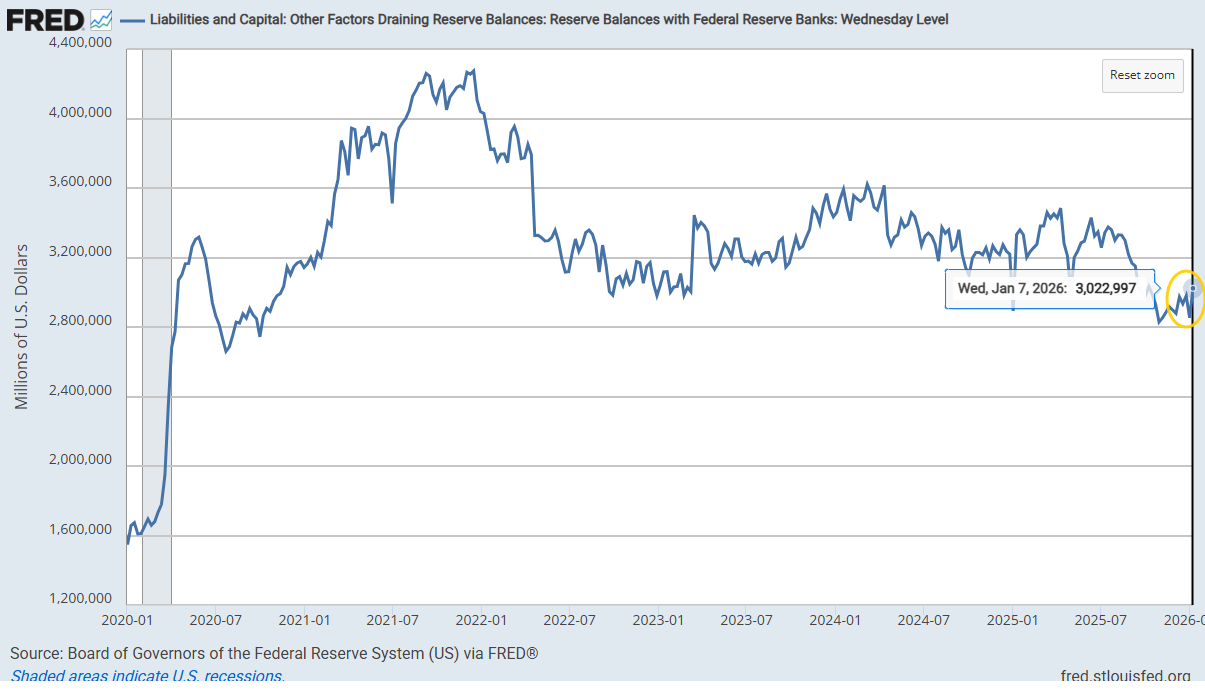
As you know if you read my RRP updates (Reverse Repurchase Program where financial institutions can park money overnight which sets a “floor” under funding markets (as you wouldn’t lend to anyone else at a rate less than you can lend to the Fed risk free)) RRP levels in mid-August finally dropped to the “near zero” levels I had been waiting (seemingly endlessly). In line with my expectations, RRP shot up to $106bn as of Dec 31st about double the typical month-end bump as banks “painted their books” for regulatory purposes, but also as expected they dropped right back down now at just $3bn, effectively at zero, in line with the Fed’s desire to keep them at minimal levels (which led to the Fed having to start the reserve management purchases).
As a reminder, now that RRP levels have drained to minimum levels, attention turns to bank reserves as discussed below.
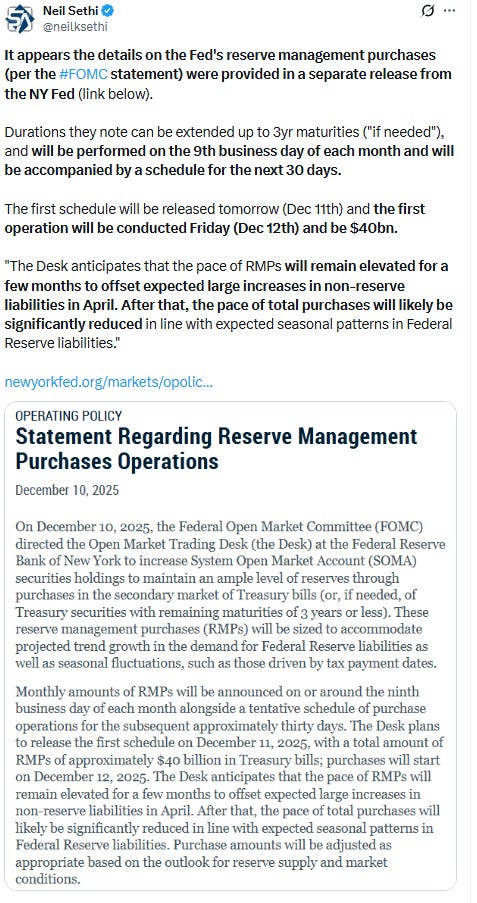
Bank reserves, which fell as low as $2.83tn as of the end of October, which was the least since Oct 2020 and down from $3.6tn Apr 10th (the highs of the year) under my “danger zone” level of sub-$2.9tn, as of Wednesday had popped back to $3.02tn (+$150bn w/w), a three-month high, helped by the passing of year-end (where banks drop their risk-weighted assets) and supported by reserve management purchases of $40bn a month (for the time being) added to the end of QT (as of Dec 1st).
This is a level Fed members have generally indicated they are comfortable with.
Getting back to rates,
I said back in April 2024 that 2-year Treasuries were a good buy at 5%, and as I noted once the Fed started its cutting cycle thereafter the ship has likely sailed on seeing those yields anytime soon (meaning years). I still have some 2yr’s but have been selling on big dips in yields, not really getting a chance to reload as they never seem to be at a level that makes sense, although most analysts think they’re going lower from here.
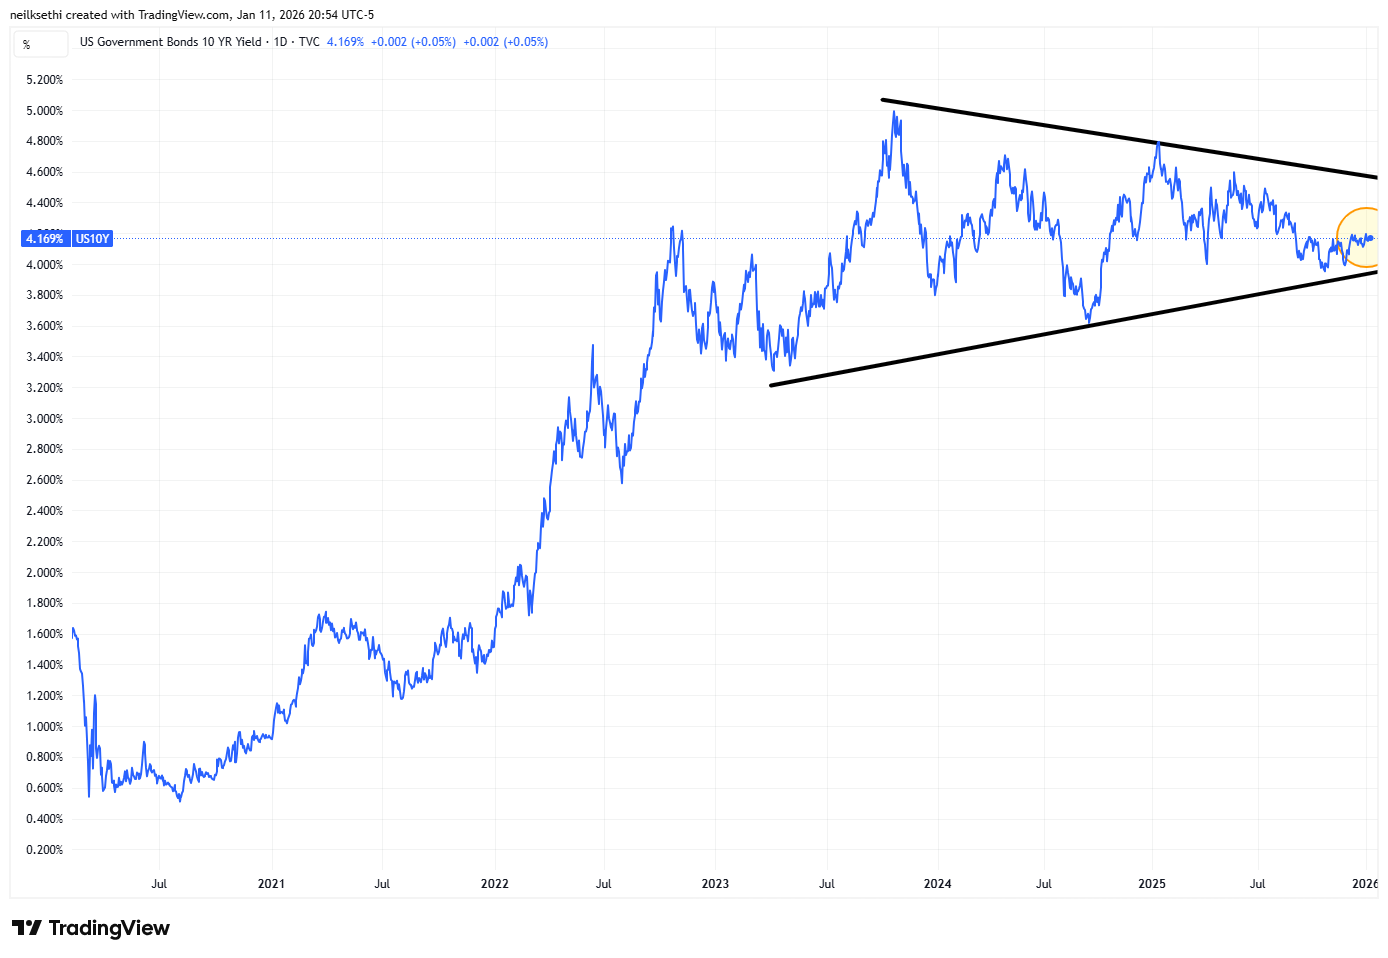
In terms of 10yr’s I had advised then grabbing some at 4.7% (which I subsequently sold on the drop under 3.75% as posted here in September) but at the time that level seemed like something we wouldn’t see anytime soon, but we got back there in January (and I added some as posted here), and it seemed like we might be headed much higher until Treas Sec Bessent noted the administration’s focus on keeping the 10yr yield low (and perhaps more importantly committing to the auction schedule set up by Sec Yellen for the foreseeable future (and perhaps even reducing longer term supply as he has noted in subsequent interviews and through the increase to the Fed’s buyback program), which has exerted downward pressure on 10yr yields). I sold that new, small position on the dip under 4% in April, and I had been waiting on us revisiting that 4.7 - 5% area to reload.
But as noted in late Sept, it is looking less and less likely that I will get that trip back up to the 4.7% area to add to my 10yr holdings any time soon. I had been thinking that 4.3-4.5% is potentially in the cards, but even that seems like too much despite all of the worries about deficits, etc. We have gotten to 4.2% but no further. Most commentators see rates heading lower not higher from here.
In 2025 the 10yr yield for the most part held the bottom of of my 2025 likely trading range of between 4 and 5%. As I have written the past couple of weeks “We’ll see if that level can continue hold and/or if yields can get any traction to the upside or downside.” As I said coming into the year, my 2026 range is 3.5 to 4.5% (with risk to the downside if the labor market continues to weaken).
For all the old “final hike” and “first cut” materials, you can reference the Feb 4th blog post.
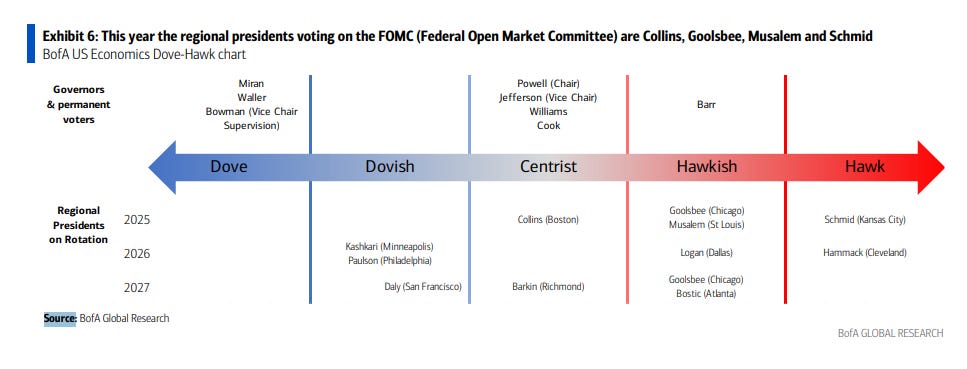
BoA finally updated their Dove-Hawk chart. Logan I think is as hawkish as Schmid, and I’m not sure I’d characterize Goolsbee as Hawkish, more Centrist, but otherwise seems about right.
And JPM added that gives you 2026 voters. I have some quibbles. The ends are fair but there really should be a distinction b/w Miran and the rest. No way is Barr dovish (and he proved that with a speech not long after I first wrote that). He’s now proven himself to be with the Bostic/Kashkari Fed Presidents. Also, not sure about Cook (she seems to vote with Powell). I think Paulson though should be with Williams and Daly (and she proved that with a speech on Dec 12th. Collins was fairly hawkish in her last appearance as has been Goolsbee (although he’s tricky, dissenting from the Dec cut but also saying “I’m one of the most optimistic folks about how rates can go down in the coming year.”). Otherwise hard to argue much with the slotting.
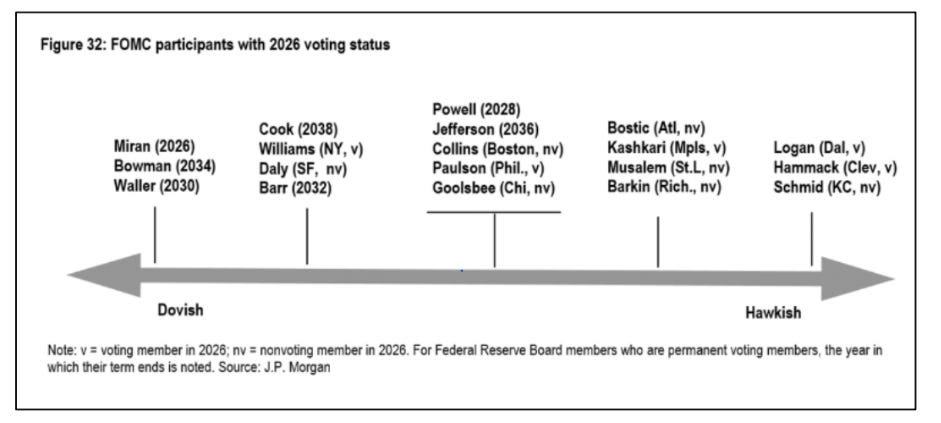
And here’s one that goes over current term expirations. Note that all of the regional Fed presidents had their terms renewed for another five years (so now expire Feb 28, 2030)

Earnings
As a reminder, I have removed most of the background material, which you can get in the Feb 4th blog post. You can reference this post from 12/1/24 for stats on 3Q, this post from 3/9/25 for stats on 4Q, and this post from 6/1/25 for stats on 1Q 25. And the 9/1/25 post for 2Q 25.
While Q3 earnings will continue to trickle in, they won’t move the needle, so if you want to reference the stats for Q3 you can find them at this posta from 11/23/25.
As we get ready to embark on Q4 earnings season, expectations according to Factset are for +8.3% growth, which represents a +0.5% increase from Sept 30th (down though from +1.1% three weeks ago).
That’s the second straight quarter we’ve seen earnings estimates for a quarter increase leading into earnings season in contrast to the decline we normally see (not to mention that in every non-recession quarter, earnings estimates will increase further from here (more on that coming)). The past 5 years the decline from the start of a quarter to its end has been -1.6% and 10 years -3.1%
It’s also the first time we’ve seen back-to-back increases in expectations leading into a quarter since 2021.
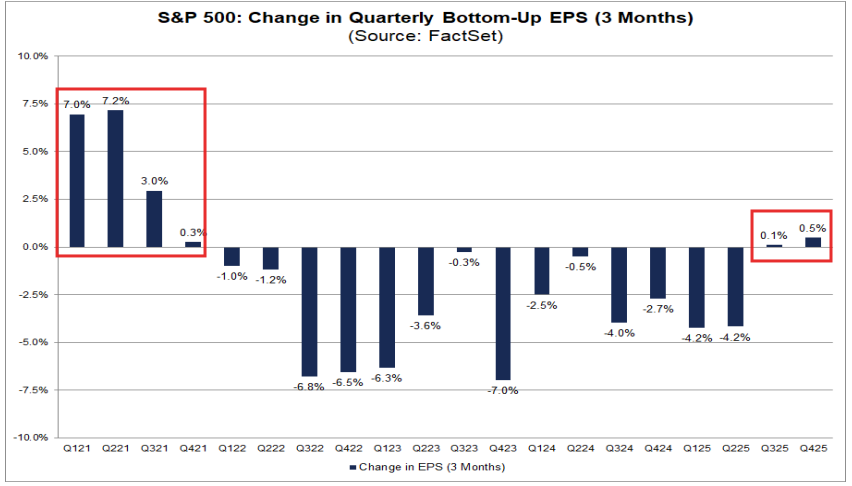
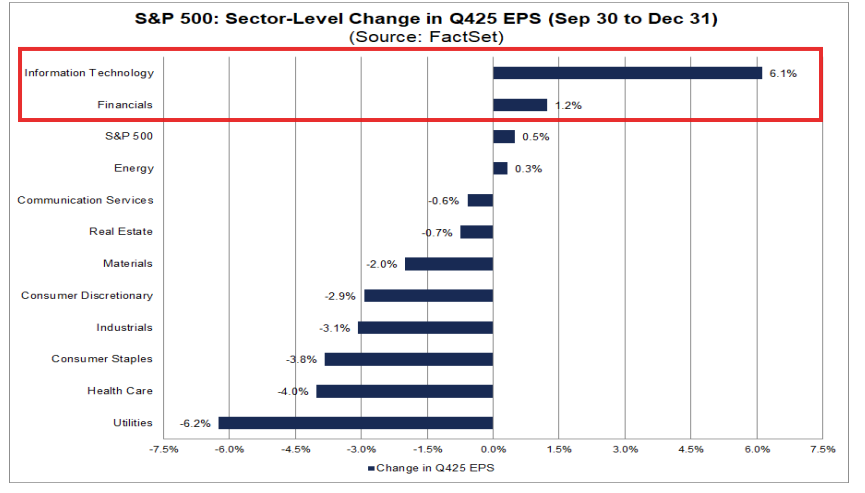
But note that most all of that +0.5% increase has been driven by Tech (+6.1% growth since Sept 30th) and Financials (+1.2%), who, along with Energy (+0.3%) are the only sectors to have seen their expectations rise over that time.
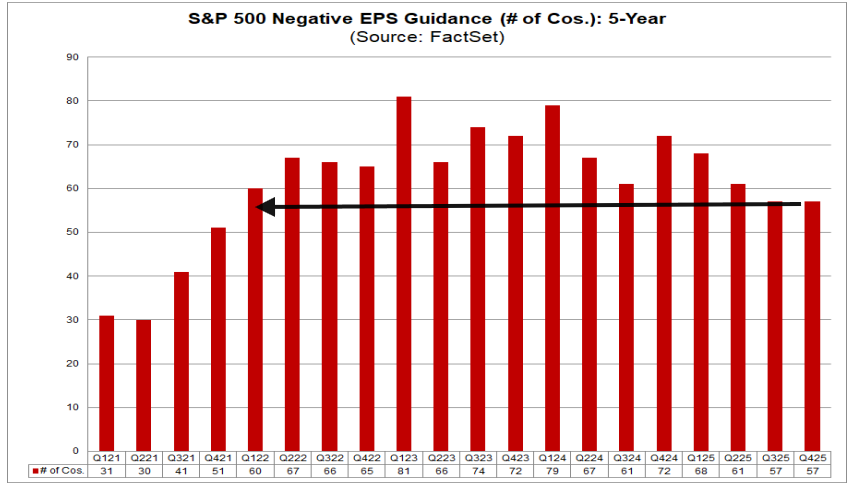
Factset attributes the rise in earnings expectations since Sept 30th to strong guidance with 47% of companies issuing positive guidance, above the 5-year average of 42% and after Q3 (49%) the best since Q3 ‘21 (57%). In addition only 57 companies have guided negatively, the least since Q4 ‘21 (51).
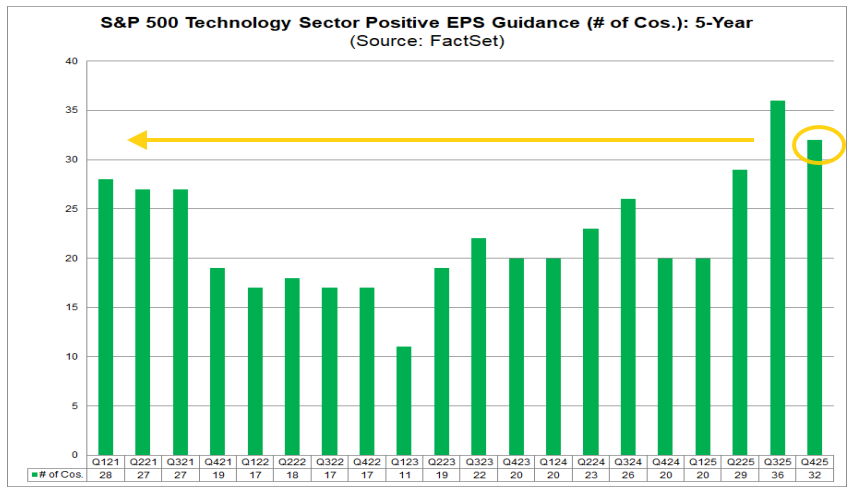
And given the rise in earnings expectations have been driven by Tech, you won’t be surprised that guidance has also been driven by Tech with 32 components guiding higher, well above the 5-year (22.2) and 10-year (18.5) averages and the second most since tracking began in 2006 after Q3 (36).
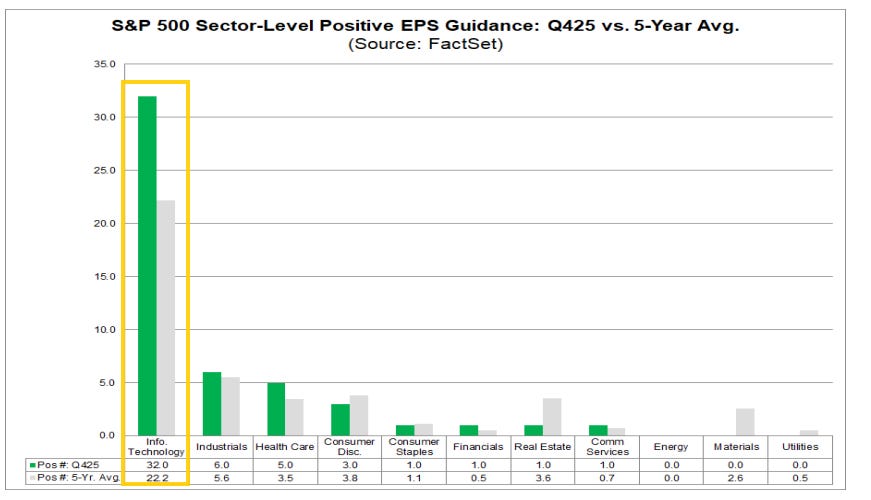
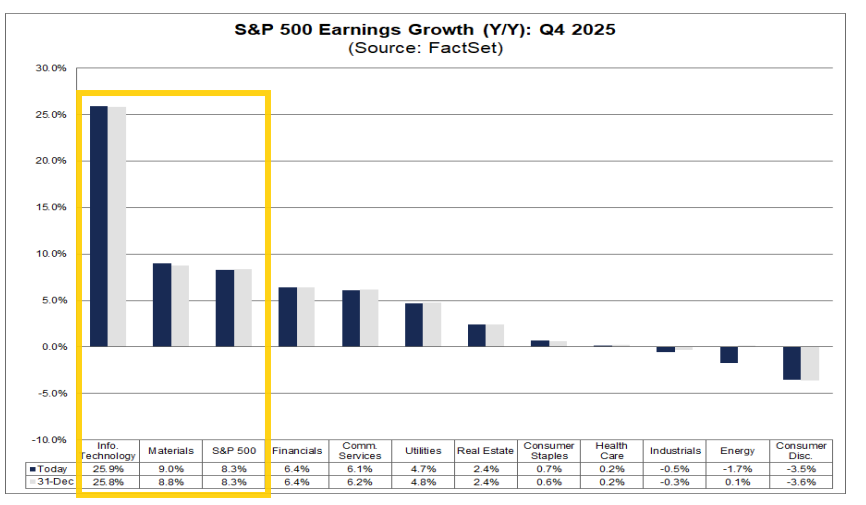
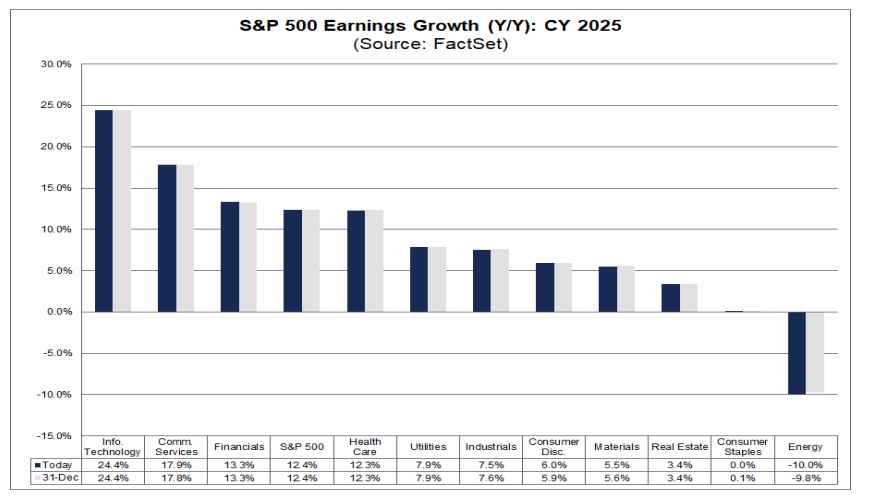
But notably, the 8.3% y/y earnings expectations are largely being driven by Tech which is expected to see a huge +25.9% y/y increase. The only other above 8.3% is Materials at +9.0%. In contrast Cons Discretionary, Energy, and Industrials are expected to see negative y/y growth.
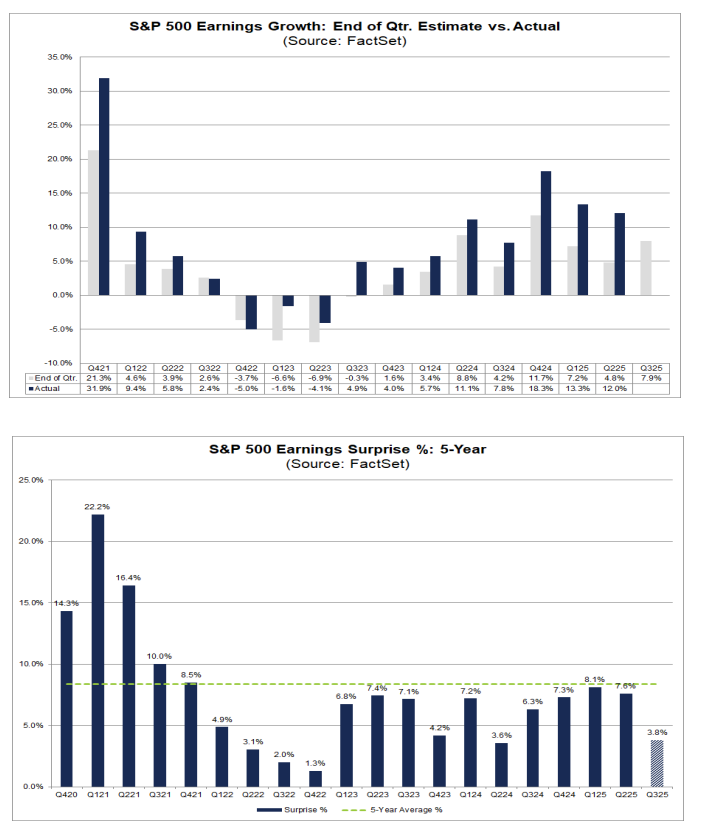
However if past is any guide the earnings growth for Q4 can be expected to come in +15.3% or higher, and I was starting to wonder if we’ll get a below average increase this quarter, but it looks like we’re going to come in at the lower end of the 10-yr average:
Factset data coming into Q3 earnings (where we also saw a large beat) indicated on average over the past 1, 5 & 10 yrs companies have beaten earnings expectations by 7.3%, 8.4% & 7.0% respectively resulting in “inflation” to the earnings estimates on average by 5.9%, 7.9% & 5.4% respectively over where they stood as of the start of the quarter (in this case June 30th which was 7.9%). So the average improvement earnings should mean Q3 earnings would come in at +15.6%, 16.7%, or 15.3% respectively.
Actual earnings by the end of the quarter have not surpassed expectations at the start of the quarter in only 3 of the past 43 quarters (Q1 ‘20, Q3 ‘22, and Q4 ‘22 are the only exceptions according to Factset).
[chart is from the Q3 preview].
And 2025 as whole pushed up to +12.4%, up from +10.6% Sept 30th
2026 earnings expectations though eased off a tenth the past few weeks to still very solid +14.9% growth (despite the higher 2025 base) with Q1 +12.6% (down from 13.1% three weeks ago), Q2 +14.6% (unch), Q3 +14.9% (+0.2%) and Q4 +18.3%(!) (+0.2%).
This would be the third year of double-digit growth
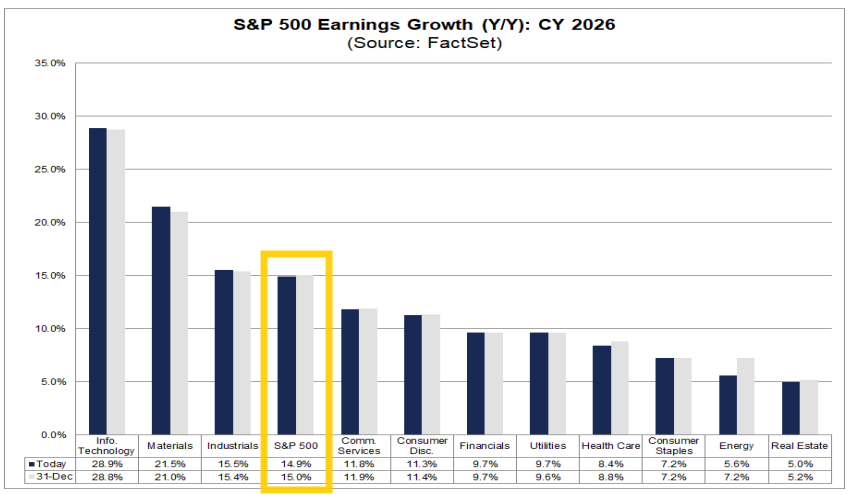
Factset notes that only two of the top five contributors to earnings growth for CY 2026 are “Magnificent 7” companies: NVIDIA and Meta Platforms. Overall, analysts expect the “Magnificent 7” companies will report earnings growth of 22.7% for CY 2026, which is slightly above the estimated earnings growth rate of 22.3% for CY 2025. On the other hand, analysts predict the other 493 companies will report earnings growth of 12.5% for CY 2026, which is above the estimated earnings growth rate of 9.4% for CY 2025.
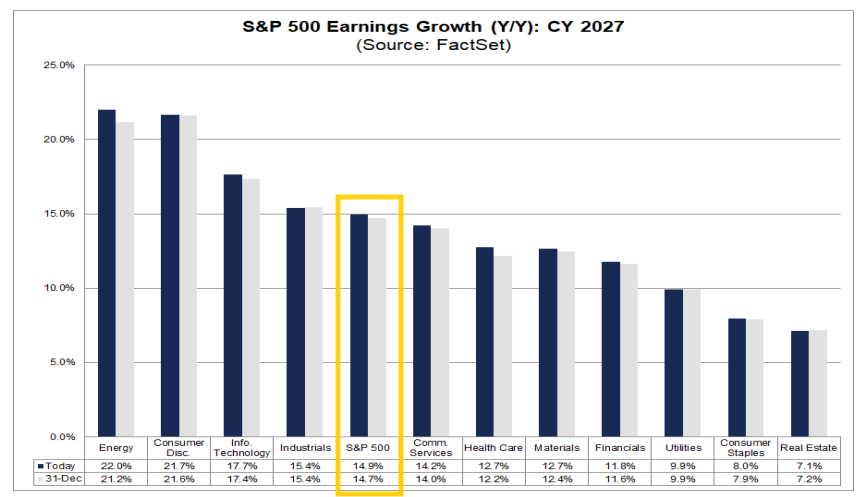
And 2027 earnings are expected to grow another +14.9%, which would be a fourth year of double-digit growth. Interestingly Energy is expected to take the lead +22.0% followed by Cons Discr +21.7% and Tech +17.7%
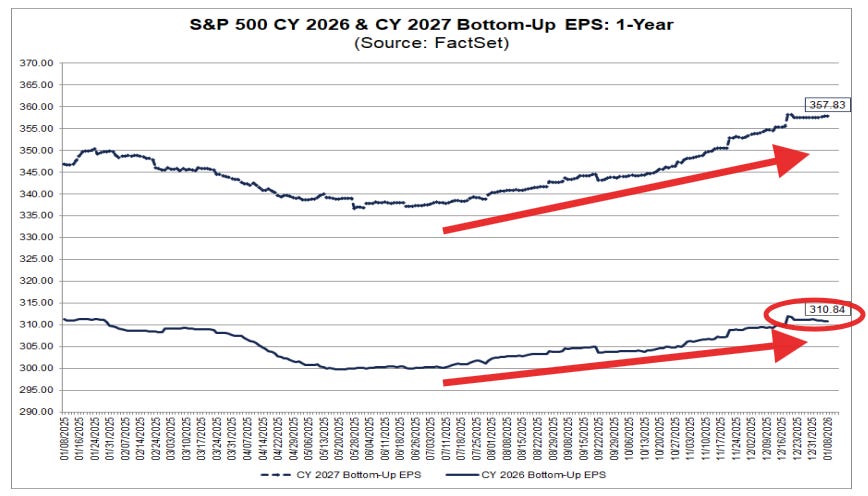
Factset: 2026 earnings expectations on a numeric basis edged lower the past couple of weeks to to $310.84 but still representing +14.9% y/y growth, down just around -0.5% from the start of 2025.
In terms of the earnings growth expected for 2026 Factset notes it will be a record. On average over the past 25 yrs there is a -6.3% deterioration from where it starts the year ($311) which would equate to $292.34 based on the average deterioration. But Factset pulls out 4 outlier years (2001, 2008, 2009 & 2020) where the overestimation was between 27-43% due to recessions. Excluding those, and assuming no recession, the difference is just -1.1% (which would equate to $307.58.
2027 earnings expectations are at $357.83, which would be +15.1% growth.
While 4Q earnings estimates are expected to grow the least since Q1 ‘24, revenues are expected to grow +7.7% y/y (almost as much as earnings) which is the most since Q3 ‘22.
Those have also grown now by more since the start of the quarter (from +6.4% on Sept 30th).
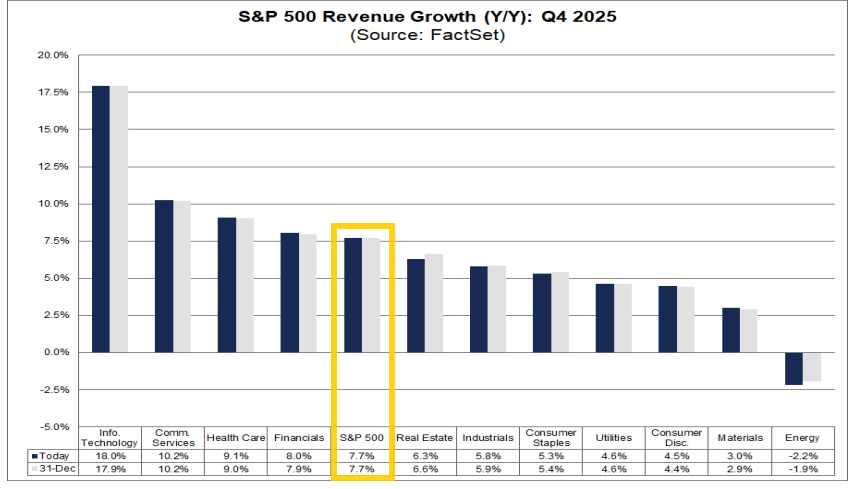
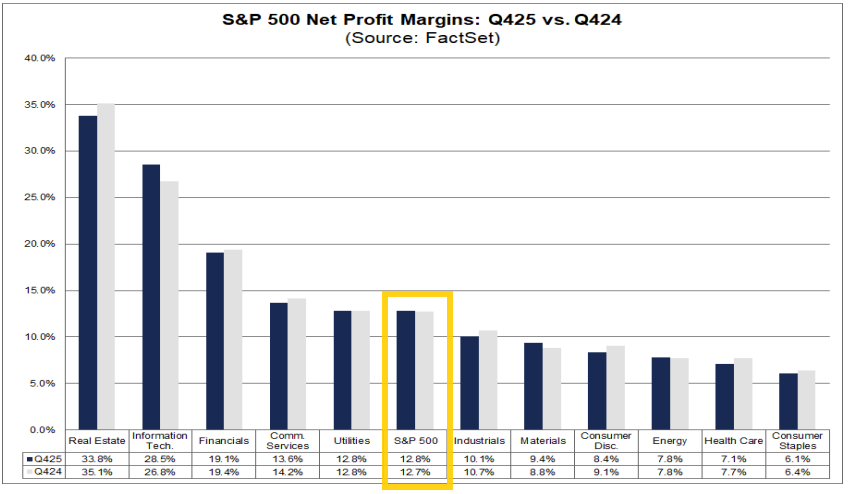
Q4 profit margin expectations are at 12.8%, below the previous quarter’s 13.1%, but above the year-ago 12.7% and 5-year average of 12.1%.
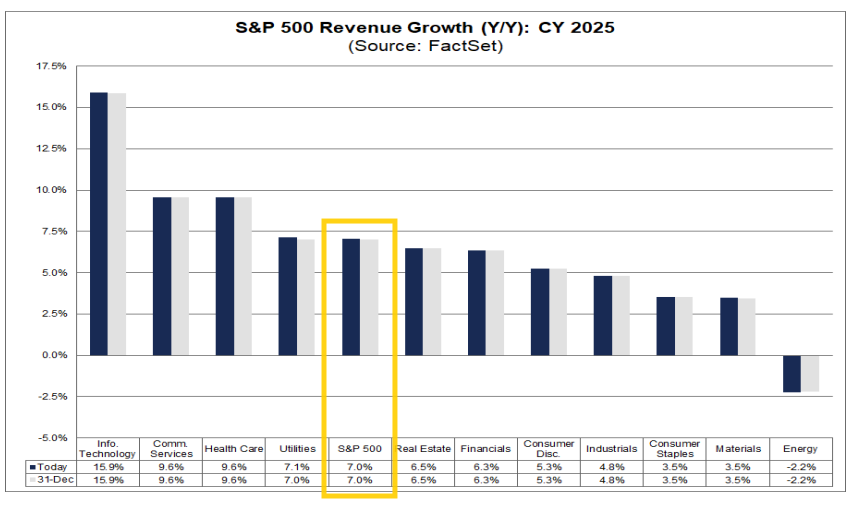
Factset: 2025 revenues are now expected to grow +7.0% up +1.4% since the start of 2025 (which is an unusually high increase). Just energy is expected to have negative revenue growth (but much less than expected even June 30th).
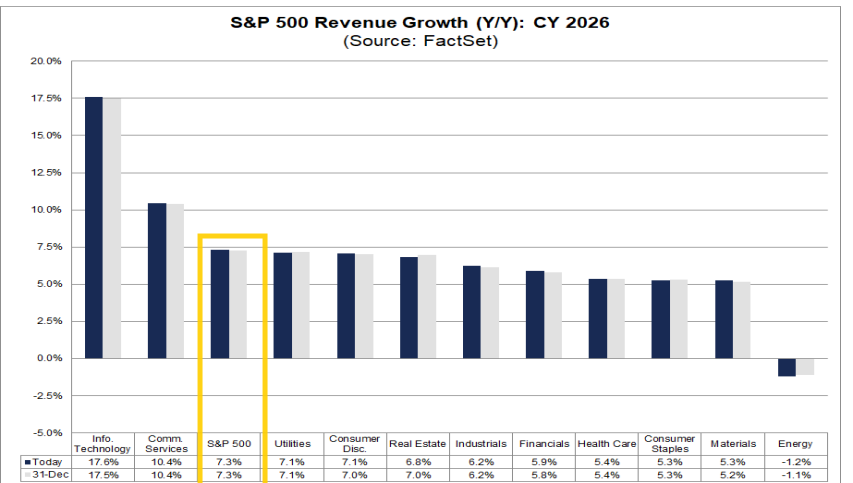
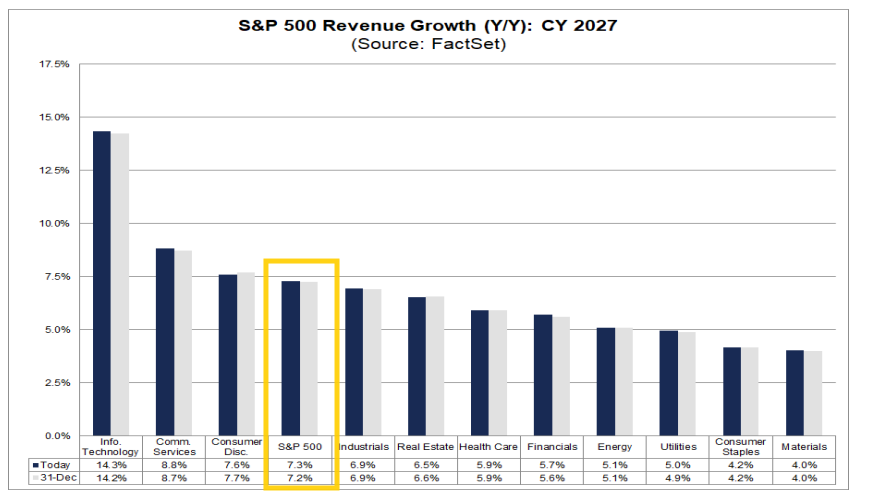
2026 SPX revenue growth is now expected at +7.3%, with Tech +17.6% and Comm Services +10.4% leading.
2027 SPX revenue growth is expected at +7.3% with Tech +14.3% follwed by Comm Services +8.8%.
In line with the larger than normal increase in earnings expectations, Factset’s compilation of analyst bottom-up SPX price targets for the next 12 months as of Thursday continued to increase for a 29th week to 8,011 which would be +18.2% from Thursday’s close. That’s an ATH +37pts the past two weeks (+490pts the past 9 weeks and +1,365pts the past 29 weeks).
Tech (+25%) remains the sector seen by analysts with the largest upside (the only sector above the SPX), followed Utilities (+17.3%while Financials remains the sector expected to see the smallest price increase (+8.0%) followed by Energy (+9.3%).
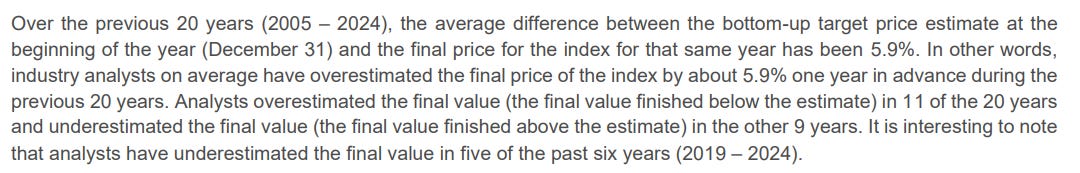
As Factset remind us last week, the last 20 yrs (through 2024) analysts have been on avg +5.9% too high from where they start the year (which was 6,755 coming into 2025, 8,000 for 2026) but note they underestimated it five of the past six years (including 2024). They ended ~100pts too low.)
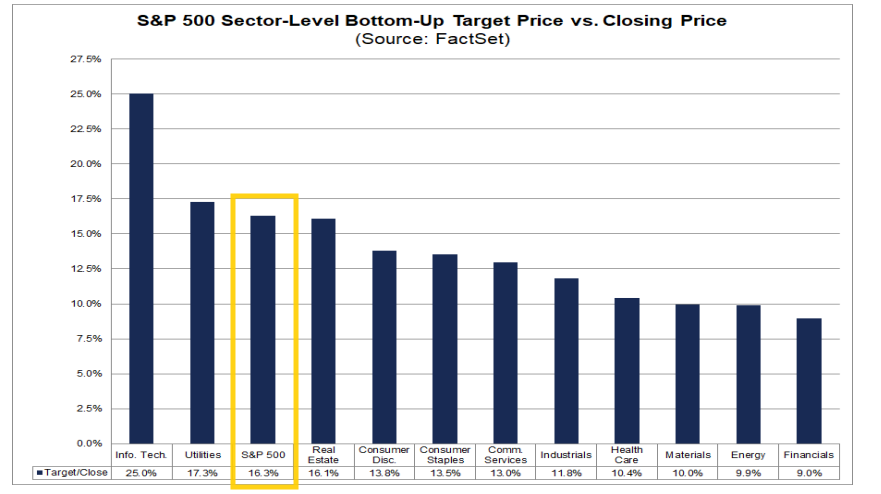
Factset: In terms of analyst ratings, buy and hold ratings continue to dominate with buy ratings at 57.7%, after December tied the month-end mark with Feb 2022 for the highest on record (to 2010) at 57.5% according to Factset. Hold ratings are at 37.3%, with sell ratings at 5.0%.
The Information Technology (67%), Energy (65%), and Communication Services (64%) sectors have the highest percentages of Buy ratings, while Consumer Staples (45%) has the lowest percentage.
Consumer staples also has the most sell ratings at 8% and Hold ratings at 47% (down from 50% four weeks ago, next closest on Hold ratings is Utilities at 46% (up from 45% four weeks ago)).
The percentage of Buy ratings is above its 5-year (month-end) average of 55.1%. The percentage Hold ratings is below its 5-year (month-end) average of 39.0%. The percentage of Sell ratings is below its 5-year (month-end) average of 5.9%.
Factset also notes that two of the three sectors that have recorded the largest price increases since December 31st are also two of the three sectors that had the highest percentages of Buy ratings on December 31st: Communication Services and Information Technology. The other though, Energy, saw the second smallest price gain since then.
Just one of the three sectors that have recorded the smallest price increases since December 31 are also one of the three sectors that had the lowest percentages of Buy ratings on December 31st: Consumer Staples. The others were Utilities and Materials/Industrials.
And some other earnings stuff:
Economy
Over the past 2+ years part of my earnings optimism has been due to the economy holding up better than expected. While earnings only track the economy loosely (and markets look forward 6-12 months), there is a clear positive correlation between the economy and earnings (particularly a weak economy and weak earnings), and there is a very strong correlation between earnings and stock prices (although stock prices (being as noted forward looking) generally fall in advance of a recession and bottom 6-9 months before the end of one). So if you can see a recession coming it is quite helpful, although very difficult (especially ahead of the market). You can reference this Week Ahead (see the Economy section) for a lot of material on how every recession is preceded by talk of a “slowdown” or “soft landing” as close as a month before the start. That report also has the notes about how small caps have shorter debt maturity profiles and more of it (debt).
As long time readers know the beginning of this section hadn’t changed much since I switched to the Week Ahead format in mid-2022, with the indicators to me during that period consistent with solid (which at times has been robust) economic growth, and I have been a broken record that I “certainly do not think we’re on the verge of a recession (although as noted above every recession starts out looking like just some economic softening).”
Since the end of March, though, we’d seen the data soften (it actually stretched back pre-March with 1Q services spending getting a notable markdown in the GDP revisions (as did services exports (tourism, etc.) and construction spending)) with reports since then more mixed, although remaining consistent with an economy running around trend levels (if not a bit above).
While we were deprived of the official data, what we saw during the shutdown “seemed to offer little change in the picture with estimates of layoffs and hires remaining generally low, consumer sentiment remaining weak, but private estimates of spending healthy, reinforced by earnings reports which also indicate a fairly healthy business environment (even if top-heavy) with solid balance sheets and low delinquencies (again though with some cracks in the subprime or leveraged areas and what seems like perhaps some slowing in certain pockets of discretionary spending like restaurants).”
As noted three weeks ago we’re finally starting to get some more recent data, and as I said last week “we continue to see an economy with some softening in hiring but spending remaining very solid along with good business investment spending, strong government spending (concentrated in defense and other administration priorities), offset somewhat by weak spending on structures outside of data centers and subdued exports.” The data this week continued in that vein with the caveat that there seems to be some tentative evidence of some stabilization in the labor market, even if job growth remains mildly disappointing. I’ll have more next week when I have a little more time.
Overall, I would say, as I have the past several months, the data continues to show an economy remaining in “ok” shape (although a 3Q GDP print over 4% is definitely more than “ok” and now 4Q is looking to be better than anyone had expected coming in), with continuing “tiny cracks” as I put it in mid-June.
As I said at the start of September 2024:
without question, the evidence is building that the days of >3% real GDP growth are behind us (although as noted the Atlanta Fed now has a nearly 4-handle for 3Q, and we should be happy to settle into something more around trend (1-3% real (infl adjusted) growth). That though is far from a disaster. The important thing will be to see the softening level out (L-shape) rather than continue to fall turning the “soft landing” into a recession.
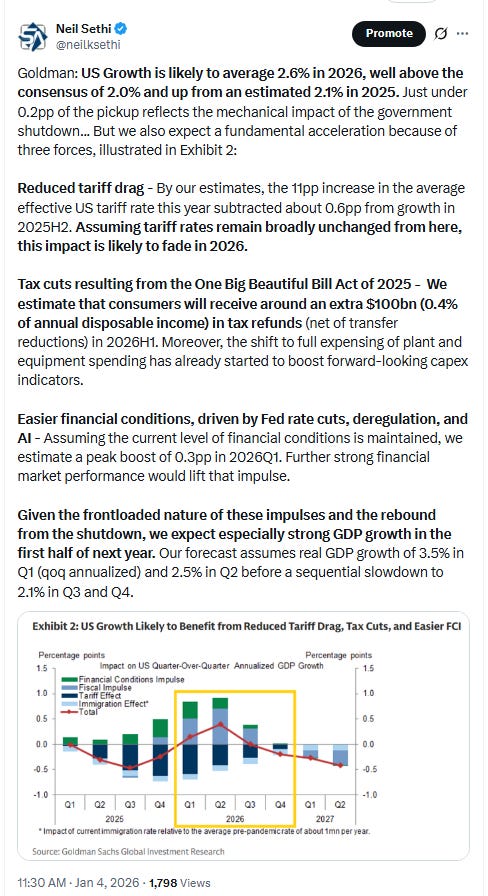
Finally, as a reminder, as we turn the page into 2026 we’ll be getting more economic boost from deregulation and the OBBB which should at the very least offset the drag we’re getting from the tariffs, restart of student loan payments, and in the short-term loss of the health insurance subsidies (although I expect those to be replaced at some point) and perhaps provide a bigger tailwind than many are expecting.
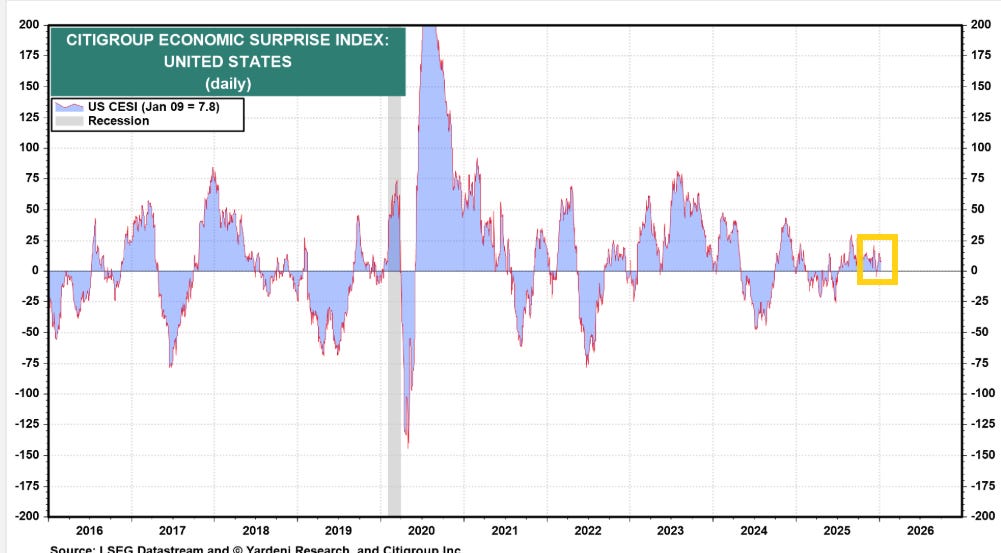
The Citi Economic Surprise Index fell back to +7.8 from +14.2 the prior week in the middle of its recent range of +21.8 Dec 10th (which had been the highest since Sept) and -4.6 Dec 22nd (which had been the least since July).
The high of 2025 was 28.6 Sept 4th and the low was -24.6 in late June. The 2024 high was 47.2 (in Feb) and the low -47.5 (in July).
And GDP estimates are for now consistent with a no recession call (again though remembering GDP going into recessions generally doesn’t look like one is coming (it was up around 2% in Q2 & Q3 2008 well after the recession had started)). After a very strong read in Q3, estimates are for a more moderate read for Q4, but estimates for the most part have been rising with a 2+% quarter now expected which is a world away from the 1% most were expecting a few months ago.
Atlanta Fed saw their 4Q GDP tracker surge to +5.45% after having come in the closest for 3Q at +3.48% vs the actual 4.3%.
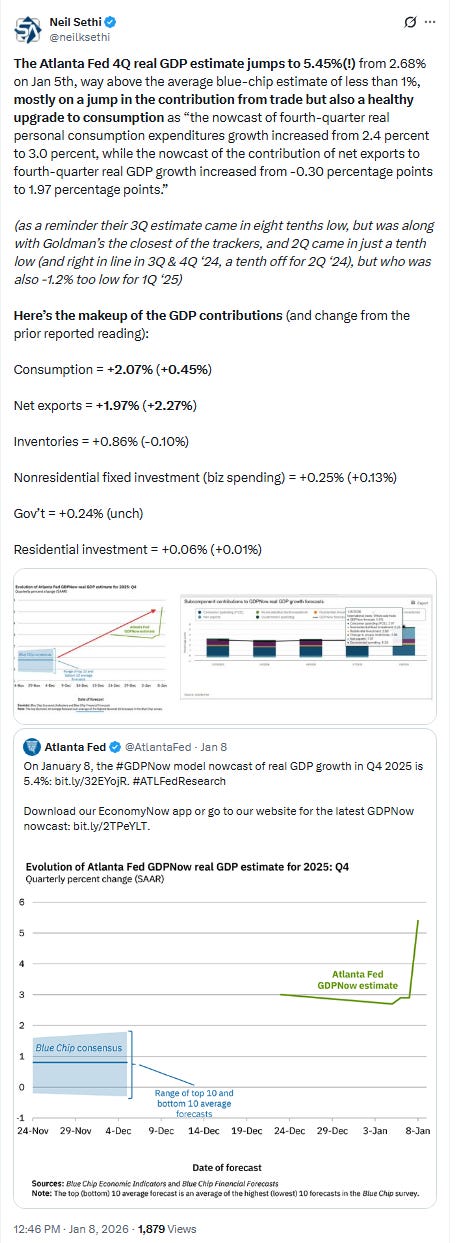
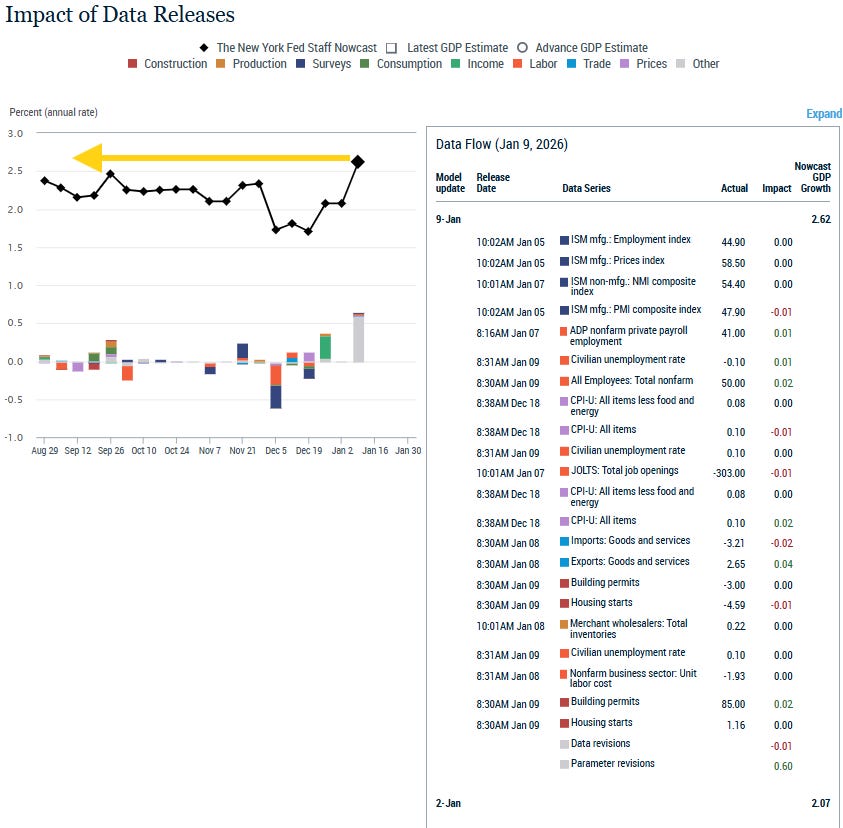
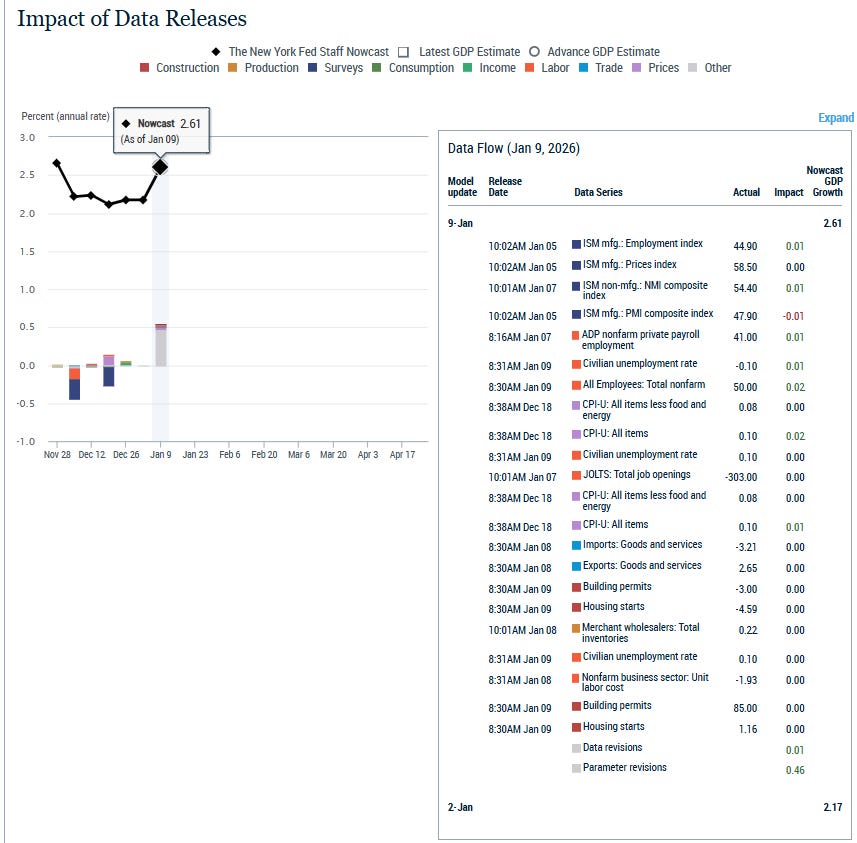
NY Fed’s 4Q GDP tracker saw a much more modest increase than the Atlanta Fed +0.55% to 2.62% and interestingly that was mostly on “parameter revisions” of +0.60% (the model is “dynamic” and so adjusts in real time as data evolves).
In contrast the trade report, which Atlanta Fed, JPM, etc., saw boost their GDP estimates by nearly 2% saw just a +0.02% boost.
As a reminder, they were well under for 3Q at +2.31% vs the +4.3% actual first estimate and 2Q at +1.68% vs +3.0% after being too high for 1Q at +2.6% vs -0.3% (although they have been closer in most quarters prior to 2025)).
Their Q1 2026 tracker was +0.54% w/w to +2.17%.
The St. Louis Fed 4Q GDP tracker continues to confound falling -1.46% to -0.34% (yes, they are now tracking a negative GDP print) on Friday. Unhelpfully they do not give a breakdown of the inputs.
The St. Louis Fed was a pretty good tracker pre-pandemic, but since Q2 ‘20 it has been much less so. For the just completed 3 Q they were by far the lowest of the trackers at +0.42%, nowhere in the vicinity of the 4.3% actual first estimate.
That dismal 3Q performance comes after undershooting 2Q ‘25 by -1.2% and overshooting Q1 ‘25 by +3.7%. It did though do well Q4 (and Q1) ‘24 but otherwise has been at least 1.5% off every quarter since Q2 ‘20, often by much more than that.
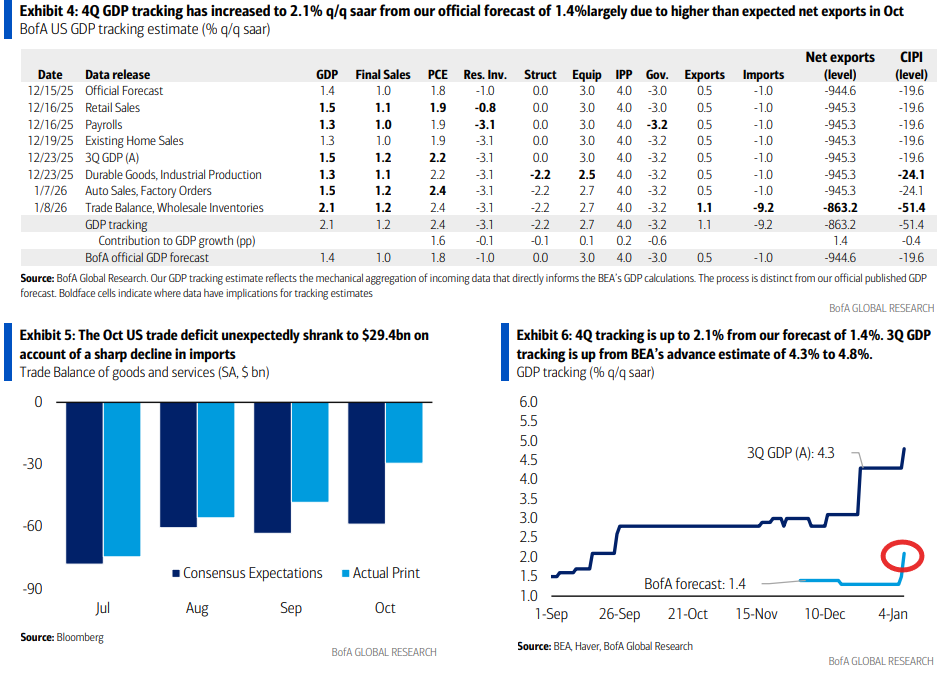
BoA sees their 4Q GDP tracker (which they published for the first time this week) jump to 2.1% (from 1.3% the prior week) as of Thursday on the back of better than expected auto sales, lower inventories, and the smaller trade deficit. They also expect an upward revision to 3Q looking for 4.8% now. They see final sales coming in at 1.0%.
As a reminder their tracker was 1.2% low for 3Q vs the first estimate and 0.8% low for 2Q ‘25 GDP, a tenth high for 1Q, right on for 4Q ‘24 GDP & two tenths high for 3Q ‘24.
Their official forecast was 2.7% for 3Q GDP (vs 4.3% first estimate) and is 1.4% for 4Q.
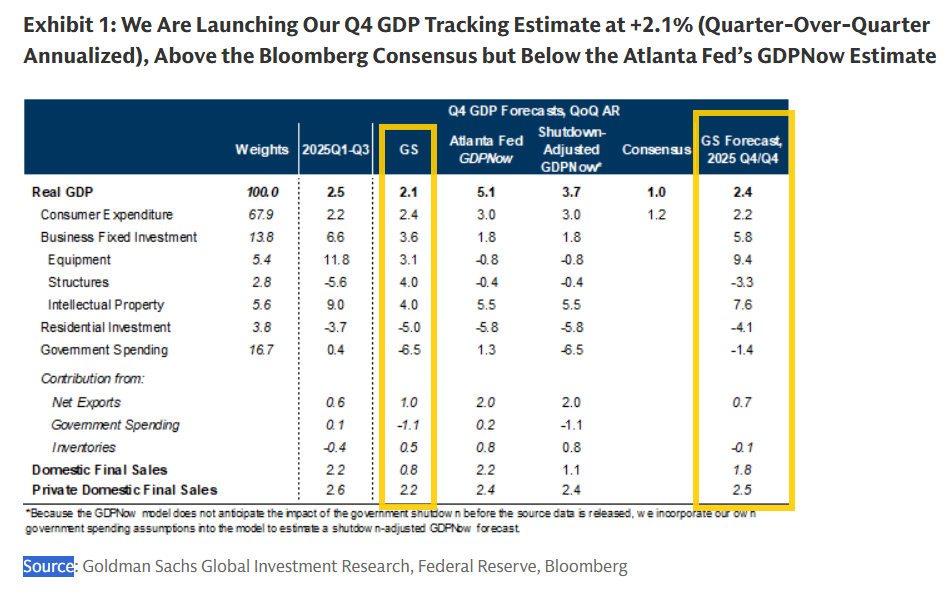
Goldman launched their 4Q GDP tracker on Sunday at +2.1% (Q/Q SAAR), “1.1pp above the Bloomberg consensus but 3.0pp below the Atlanta Fed’s GDPNow model…our forecast incorporates a large drag (-1.1pp) from the government shutdown, but since the Atlanta Fed’s GDPNow model is a nowcast based on available data for the quarter, it cannot anticipate the impact of the shutdown before it materializes in the source data… This accounts for about a third of the gap between our forecast and the GDPNow model.
“Private domestic final sales growth, which excludes government spending, inventories, and net exports (and therefore will mostly look through the temporary impact of the shutdown), should provide a better gauge of underlying growth in Q4. We forecast quarterly annualized private domestic final sales growth of +2.2% for Q4, slightly below the +2.6% average pace in Q1-Q3 but marking another quarter of firm growth.”
Goldman’s official “house forecast” is for +2.4% GDP with +2.5% private domestic final sales growth (last column).
Goldman’s Dec US Current Activity Indicator edged down -0.3% to +1.5%, down from 2.0% in Nov.
The CAI is their “real-time measure of inflation-adjusted economic momentum using 37 inputs.”
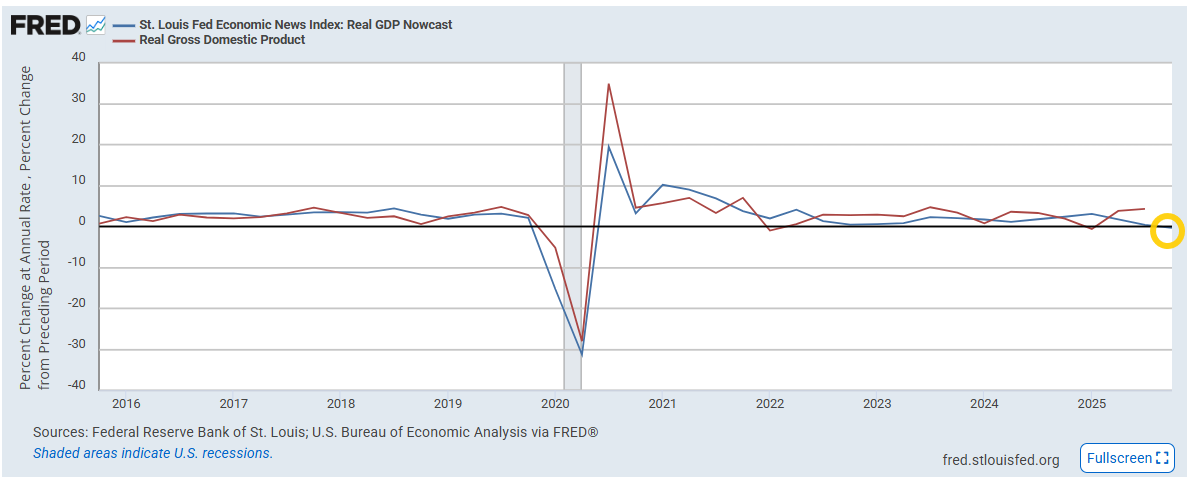
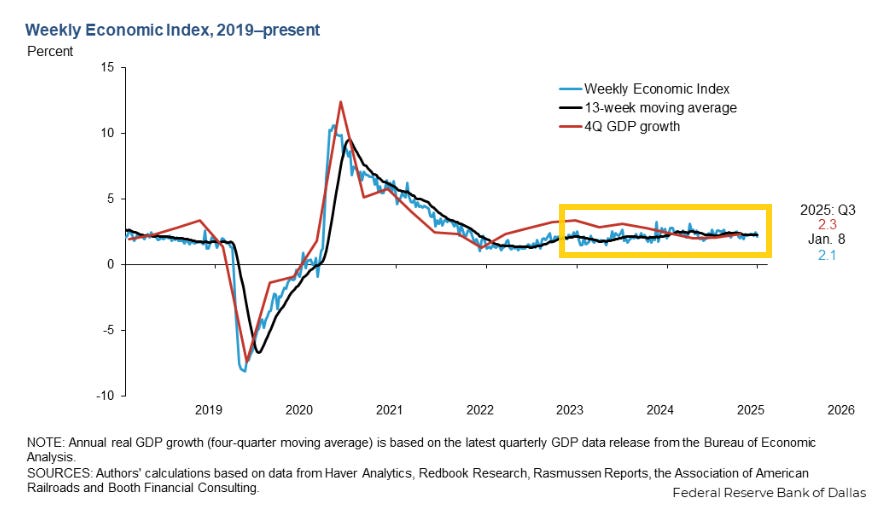
The Weekly Economic Index from the Dallas Fed (scaled as y/y rise for real GDP (so different than most GDP trackers which are Q/Q SAAR) and which uses 10 daily and weekly economic series but runs a week behind other GDP trackers), in the week through Jan 3rd fell back -0.36% to 2.13% (after though the prior week was revised +0.26% higher), remaining in the 1.49 - 2.79% range it has occupied since 2022 only poking above a couple times (most recently Apr 5th).
This series has become one of my favorites as it has a high correlation with actual GDP (see chart and note the recently released Q3 GDP report showed y/y GDP at 2.33%, right in line with this index) and has consistently indicated no recession and relatively healthy growth since the pandemic (which is what we’ve seen). It was referenced in November by Dallas Fed Pres Laurie Logan as support for her contention that the economy “remains solid”.
Importantly, the 13-wk avg is at 2.24% (down a bit from the 2.53% reading May 3rd, which was the best since 2022, but still a very healthy reading), continuing to evidence economic momentum that is slightly above trend.
https://www.dallasfed.org/research/wei
Other economy stuff:
Valuations
Like the other sections, I’ll just post current week items regarding the multiple. For the historical stuff, see the Feb 4th blog post.
With equity indices moving higher, P/Es did as well, led by mid- and small-caps (although hard to see on the chart):
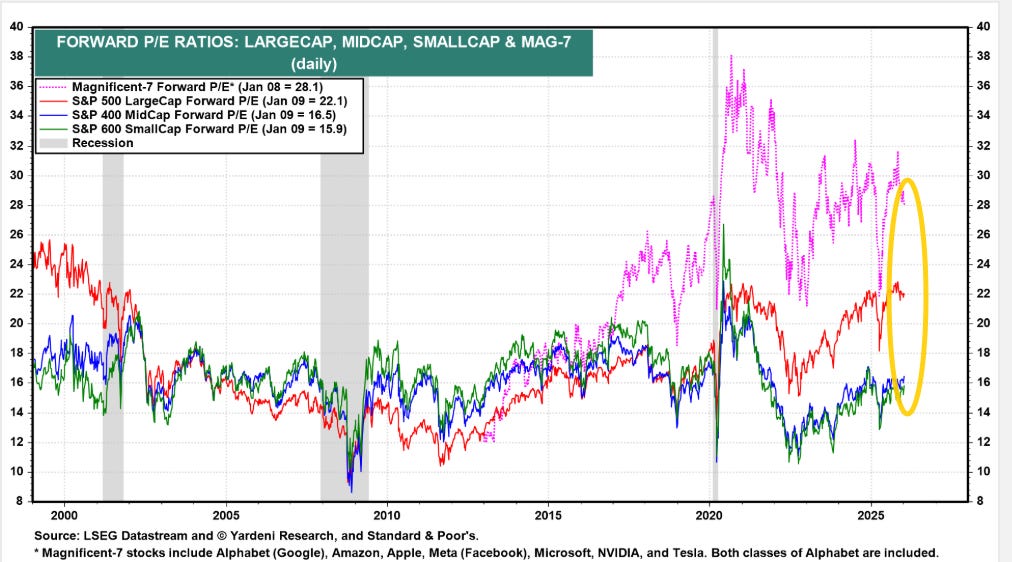
-The SPX forward P/E (red line) back to 22.1 (+0.3pts w/w, -1.5pts from the highest since 2001 on Yardeni’s model (which is a bit lower than most others (presumably due to the forward earnings calculation and earnings data source))).
-Mid-caps’ (blue, S&P 400) +0.5pts w/w to 16.5 (-0.6pts from the highest since early-’21 (17.1)).
-Small caps’ (green, S&P 600 so higher quality than the Russell 2000) +0.6pts to 15.9 (-1.2pts from the highest since early-’21 (17.1)).
-Mag-7 (purple) edged +0.1pt to 28.1, from the least since Aug (-2.8pts from the highest since 2024 (30.9)).
https://yardeni.com/charts/stock-market-p-e-ratios/
Other valuation stuff:
Breadth
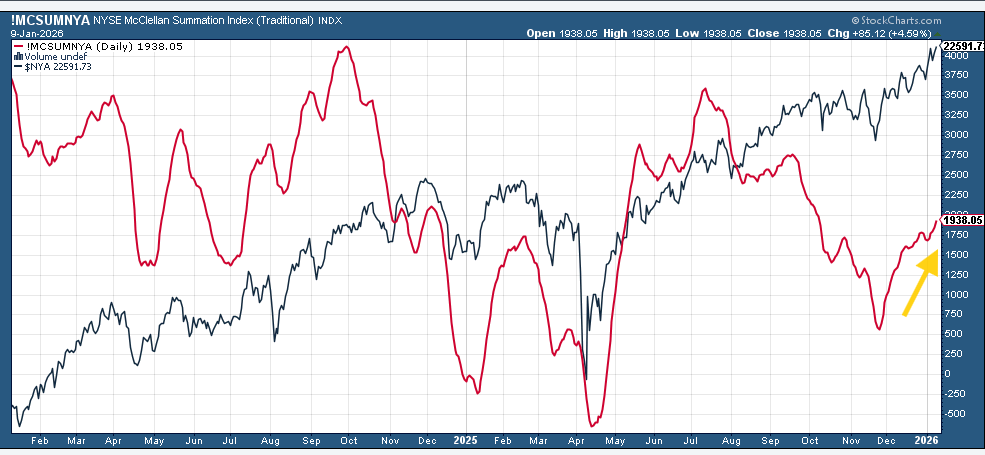
The McClellan Summation Index (“what the average stock is doing”) resumed its upward move after taking a dip the previous week now the highest since early Oct.
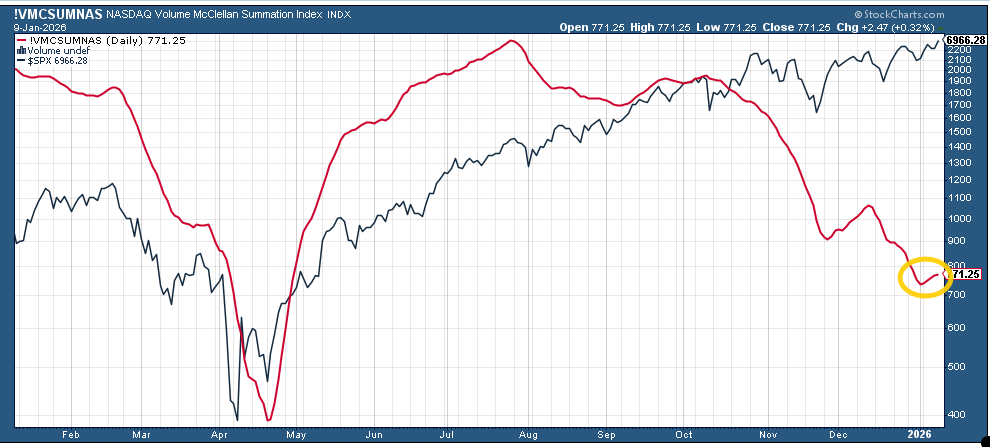
The Nasdaq volume-based version (red line, favored by Helene Meisler for this index) also finally turned up from the least since April.
SPX new 52-wk highs (red line) jumped to 64 on Mon/Tues the best since Nov ‘24.
The 10-DMA (blue line) also turned higher moving from 19, the least since June, to 30. The 2025 high was 40 in October (and the 2024 peak was 76).
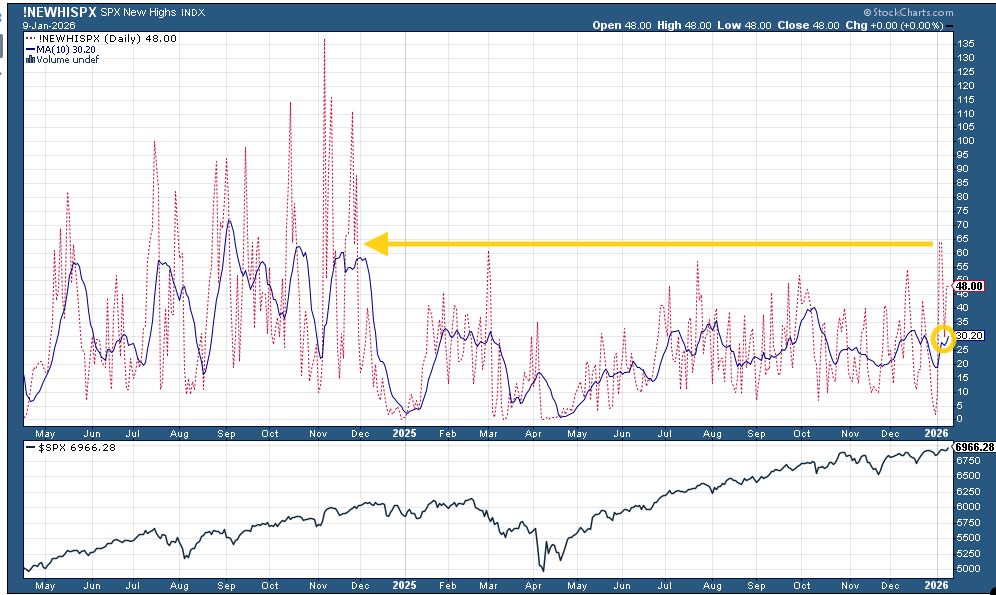
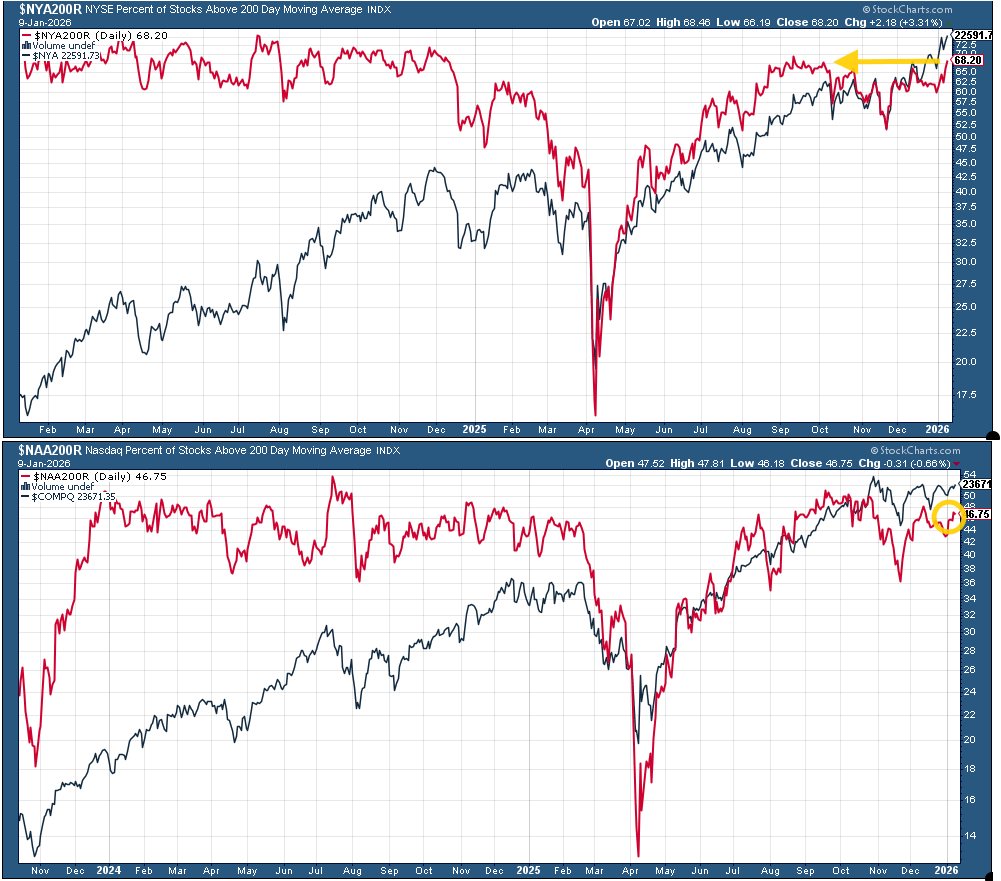
% of stocks over 200-DMAs (red lines), a gauge of stocks in longer term uptrends, which had been lagging the price action, got in gear last week for the NYSE and moved to the highest since Oct, just off the best in 2025. Nasdaq though, like price, is lagging a bit.
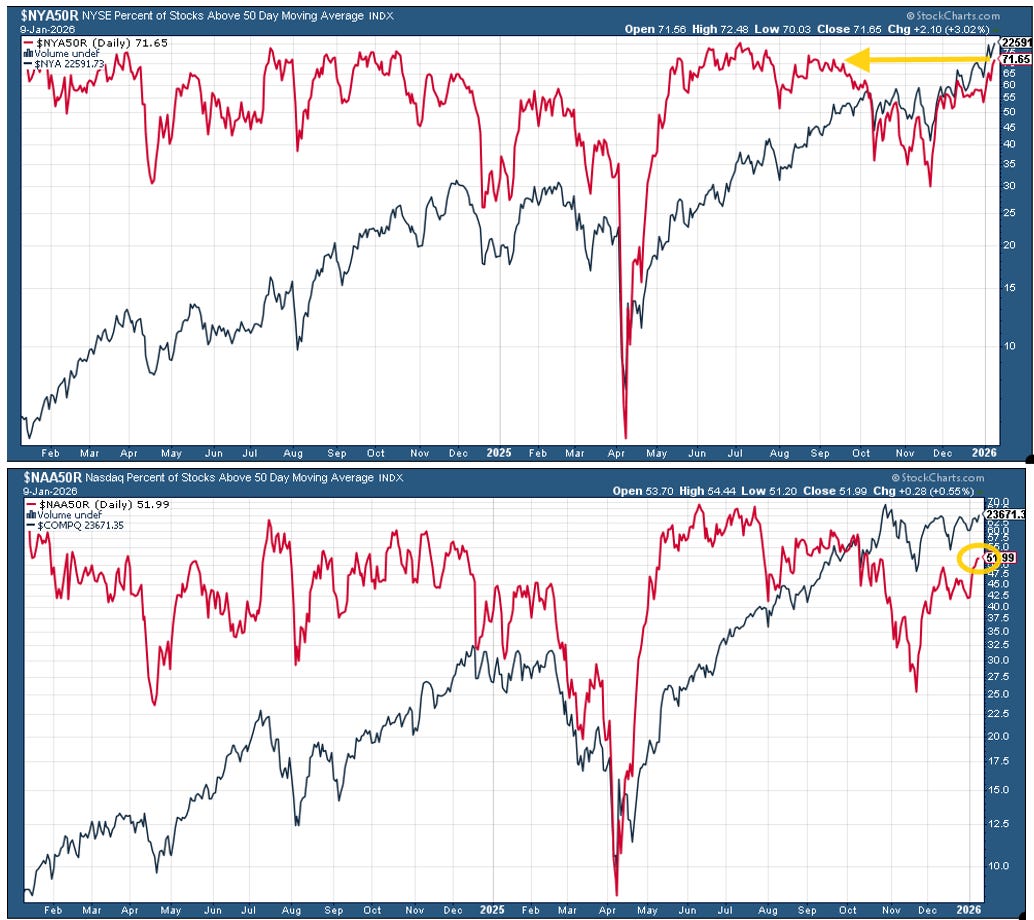
% of stocks above 50-DMAs (red lines), a gauge of stocks in medium-term uptrends a similar story, although those highs were in June.
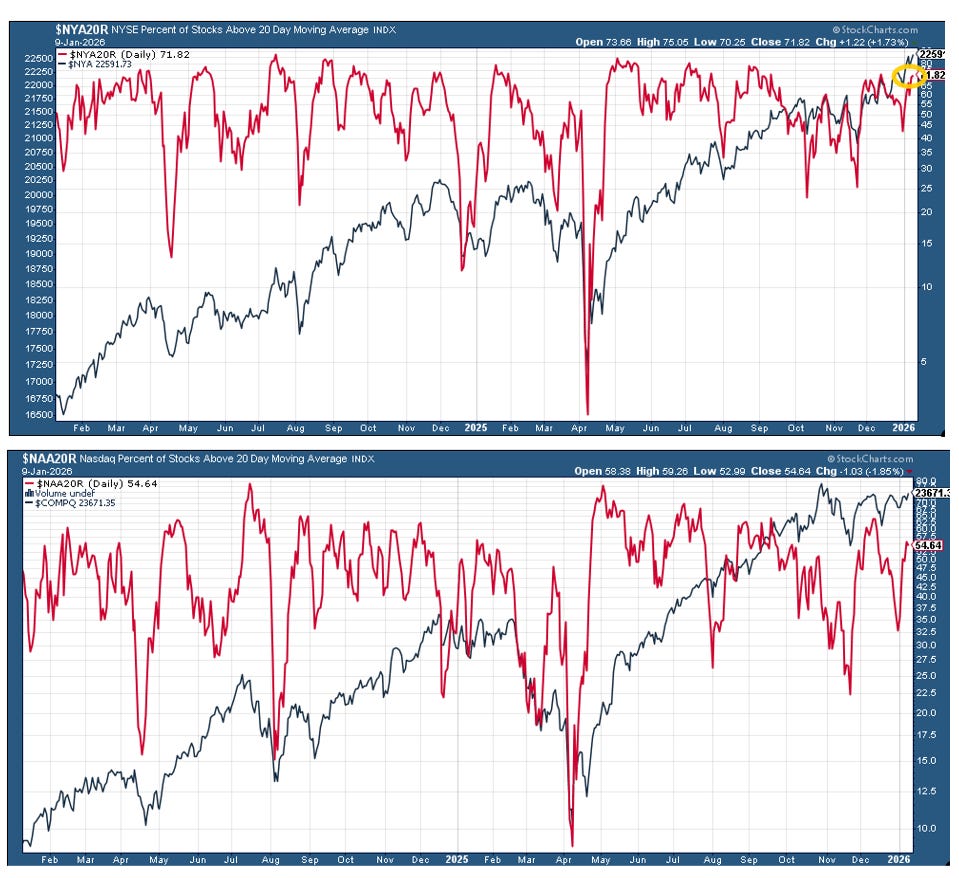
And shortening the lookback to % of stocks above 20-DMAs (red lines, indicative of equities in shorter-term uptrends) the same idea.
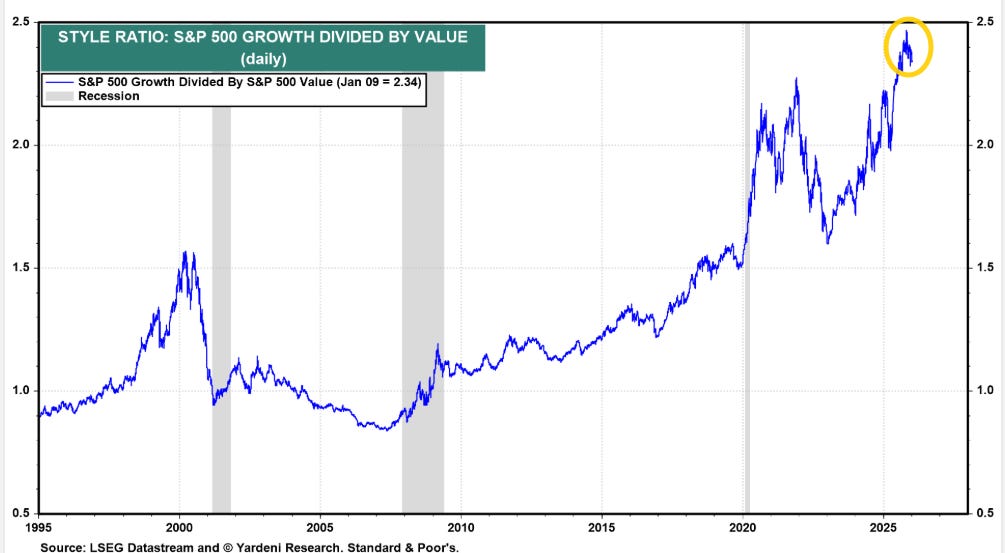
SPX growth/value fell to a 4-mth low of 2.34 as of Jan 9th, down from the highest since 1995 (2.44) the first week in Nov, but still up from around 2.0 to start 2025.
https://yardeni.com/charts/growth-vs-value/
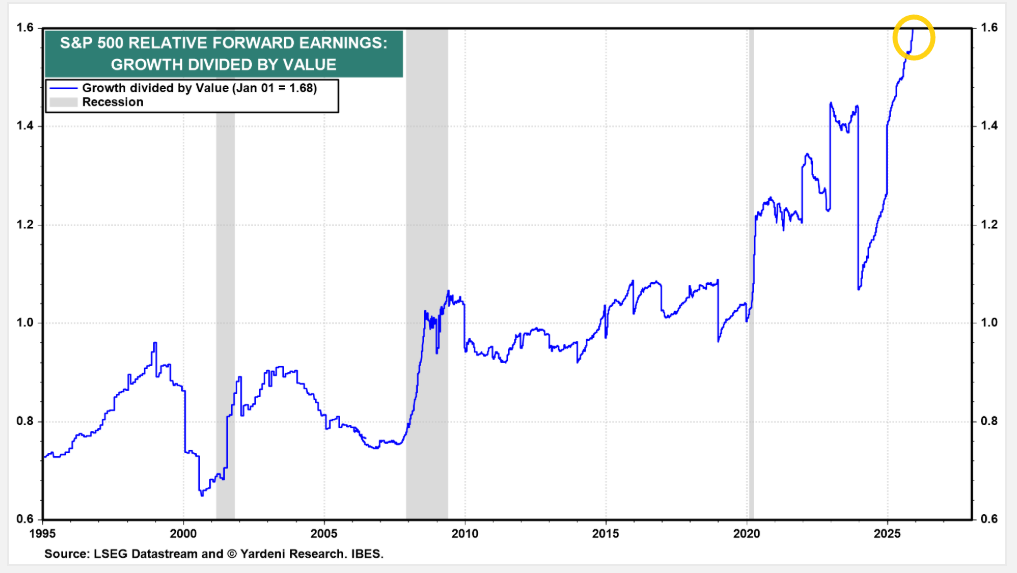
Even as the relative forward earnings of growth vs value remained at record highs (1.68 as of Jan 1st), remaining off the chart.
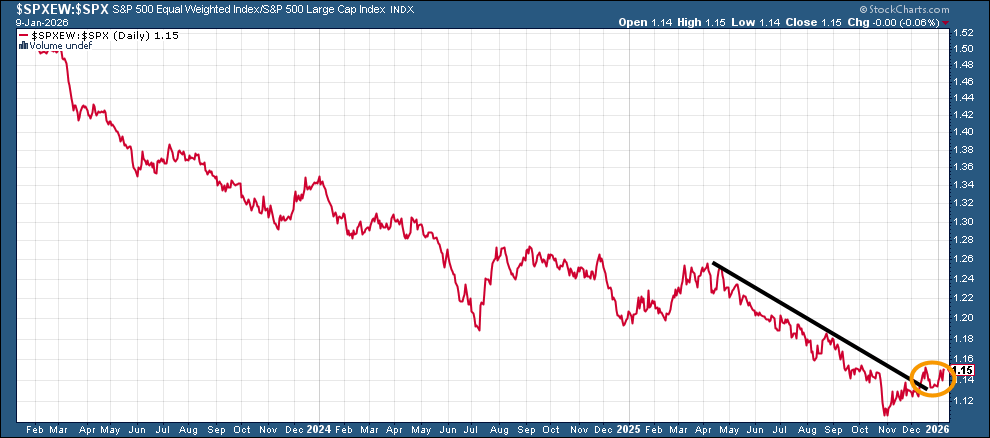
Equal-weighted SPX vs cap weighted ratio moved higher but not able yet to make a higher high stuck in its range over the past 6 weeks still not yet extending after clearing its downtrend line from April, remaining not far from the least since 2003.
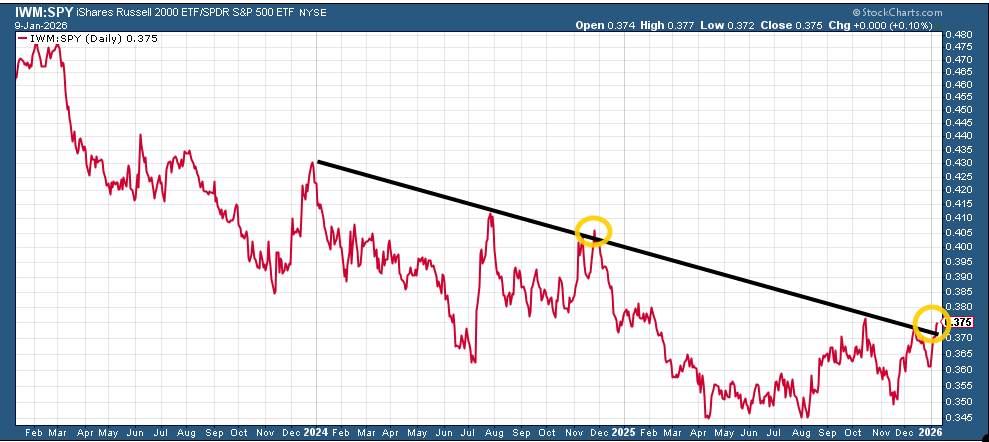
IWM:SPY (small caps to large caps) edging over its downtrend line from the start of 2024. Will this be another fakeout like Nov 2024?
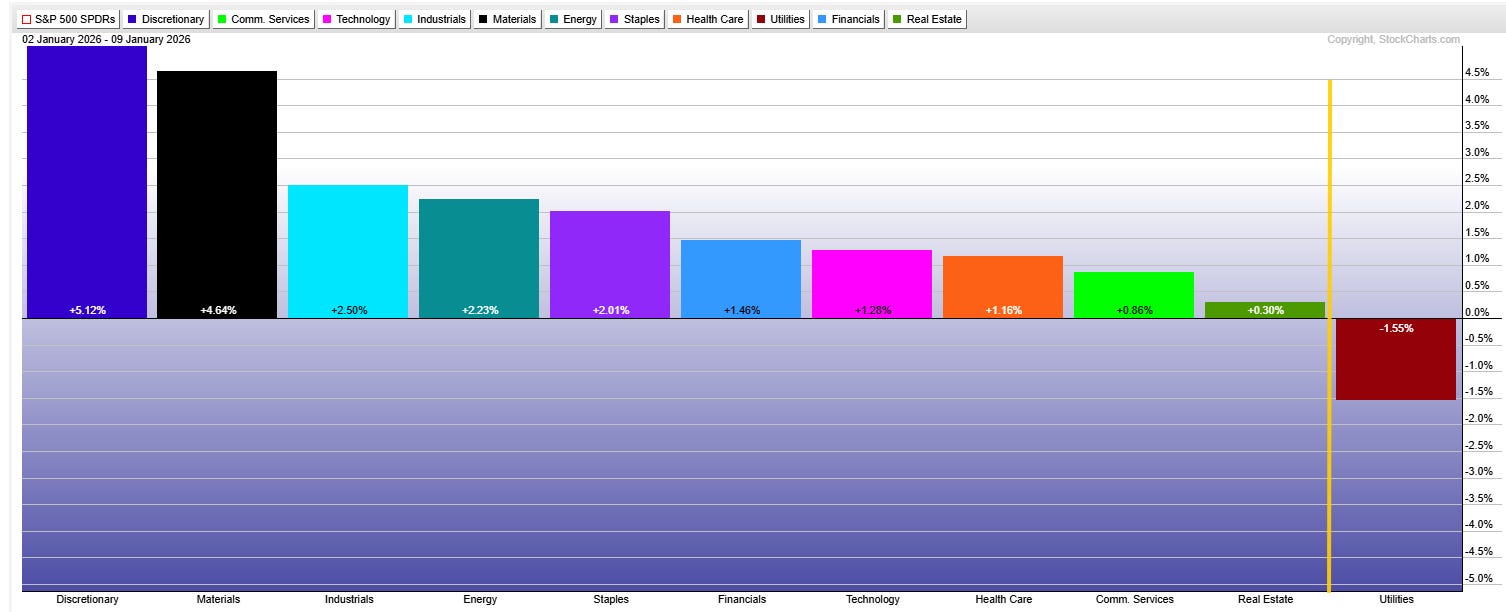
SPX sector breadth quite strong last week with 10 of 11 sectors higher (the most since Nov) up from 4 the prior week, and eight of those were up over 1% (vs one the prior week), five up over +2% and two up at least +4.6%(!) (Cons Discr and Materials).
The lone down sector was Utilities (+1.6%).
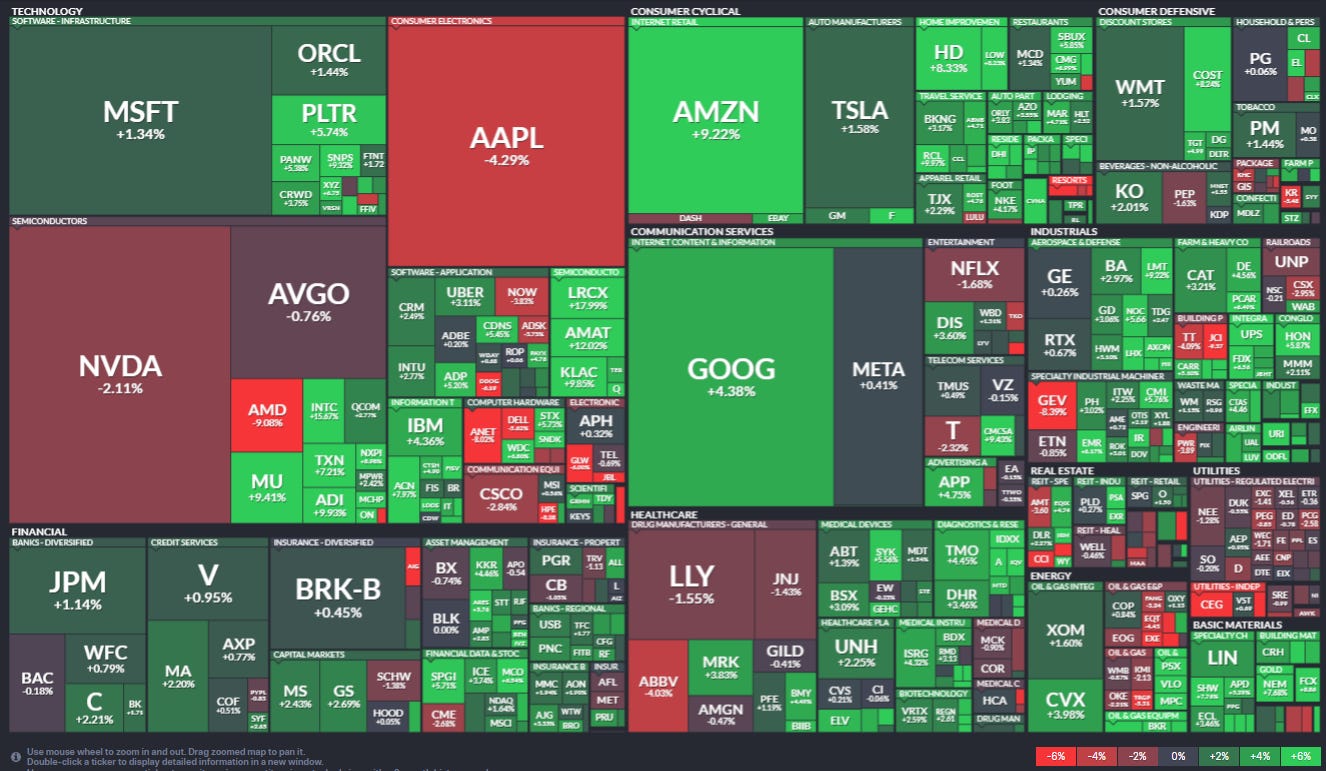
Stock-by-stock chart from @FINVIZ_com relatively consistent, although a little more red than I would have thought for that type of sector breadth. Still the overwhelming majority of stocks were green, and those strongest sectors saw almost no stocks were lower.
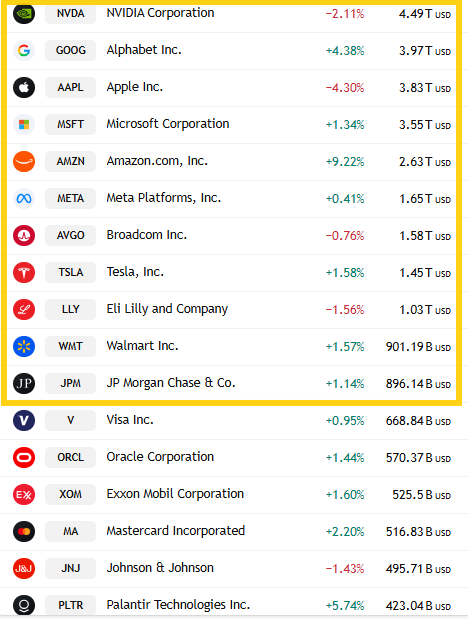
Looking at the top 11 stocks by market cap, seven were higher (vs three the previous week but down from nine the week before that) led to the downside by AAPL -4.3%. Leading to the upside was AMZN +9.2%.
2025’s top gainer SanDisk SNDK (up a jaw-dropping ~+560%) added another +37.1% to lead the SPX last week, one of 22 stocks up at least +10%.
~100 SPX components were up over +4%, up from 18 and 15 the prior two weeks and the most since Nov. A little over a third of those were >$100bn in market cap in LRCX, INTC (again), AMAT, ADI, KLAC, MU (for a fourth week), APP, LMT, AMZN, HD, COST, LOW, NEM, TXN, HON, SBUX, PLTRK SPGI, SYK, PANW, ADP, IBKR, APP, DE, BMY, KKR, TMO, GOOG, IBM, ISRG (in descending order of percentage gains),
On the other side First Solar FSLR, led decliners -13.0%. Three other components were down over -10%.
~35 SPX components were down -4% or more (around the same as the previous week but up from just 3 the prior week), but just four were >$100bn in market cap (after eleven the previous week but none the week before that) in AMD, CEG, AAPL, ABBV (in order of percentage losses).
Other breadth stuff:
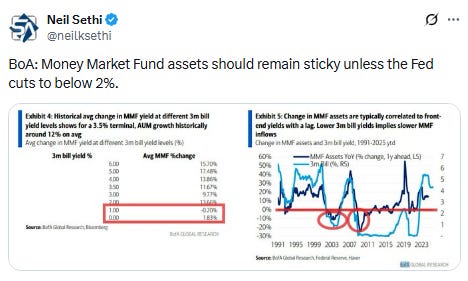
Flows/Positioning
Flows from the Flow Show:
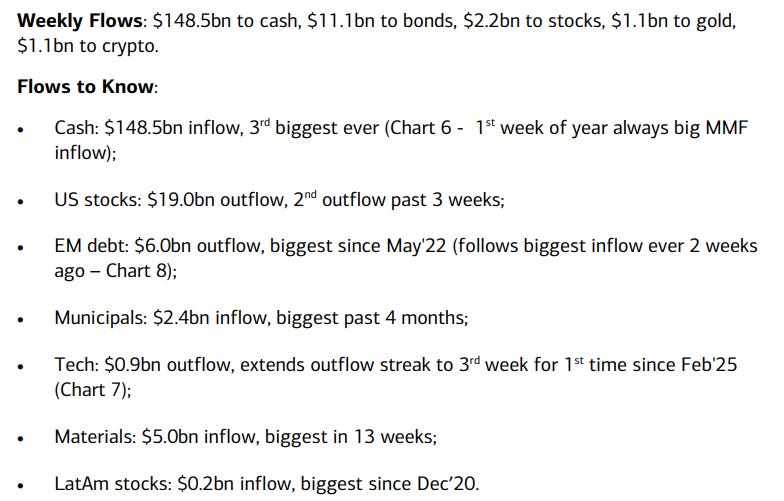
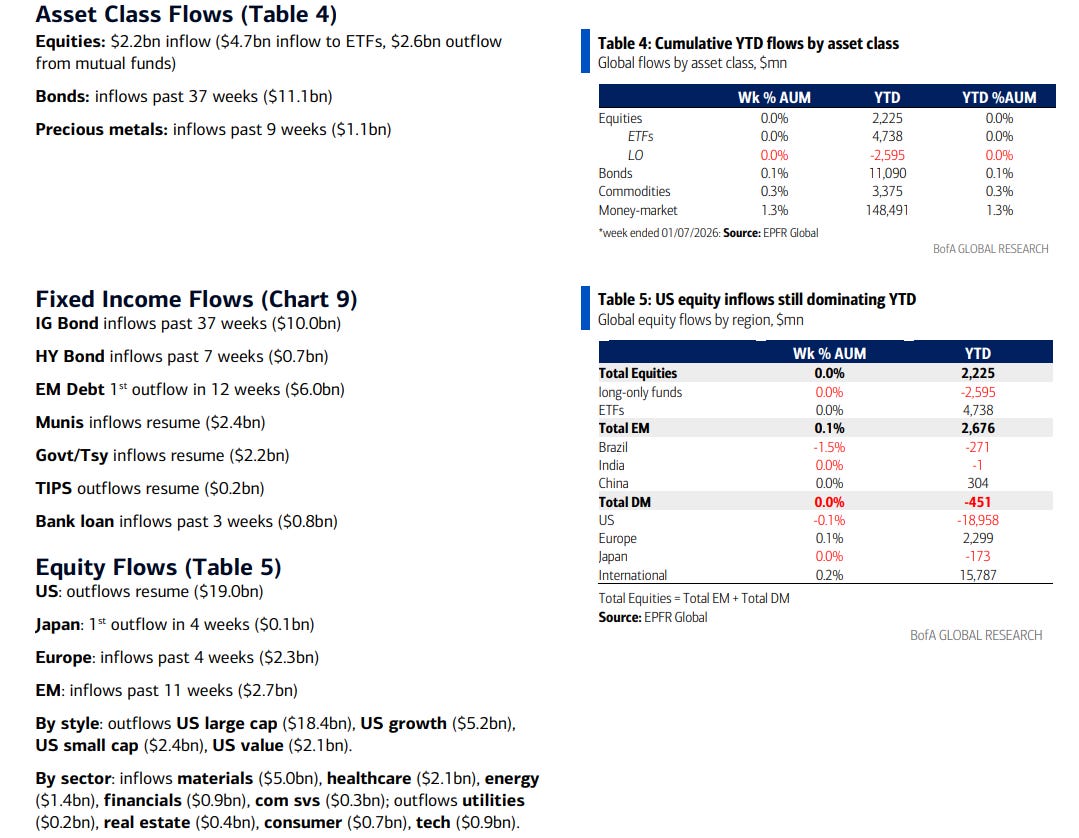
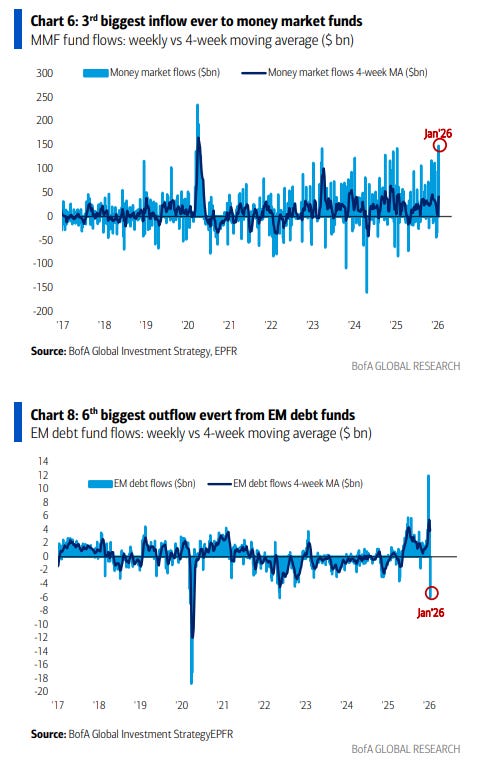
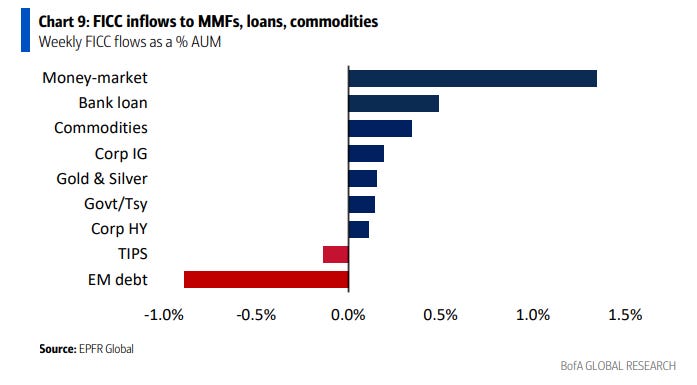
It’s been a couple of weeks, but EPFR FICC flows in the week through Wed saw Commodities and Gold/Silver fall back out of the top spots although remaining positive at third and fifth on the inflows list (w/+0.5 & +0.4% in AUM respectively).
Cash was by far the winner with a hefty +1.4% of AUM (the 3rd largest inflow on record (but the report notes 1st week of year always big MMF inflow”)) followed by semi-risky bank loans (+0.6%). Corp IG, UST’s and Corp HY were also positive while TIPS continued to bleed AUM and riskier EM debt went from first to last with -0.9% AUM of outflows (”biggest since May ‘22” but only after “biggest inflow ever 2 weeks ago”.
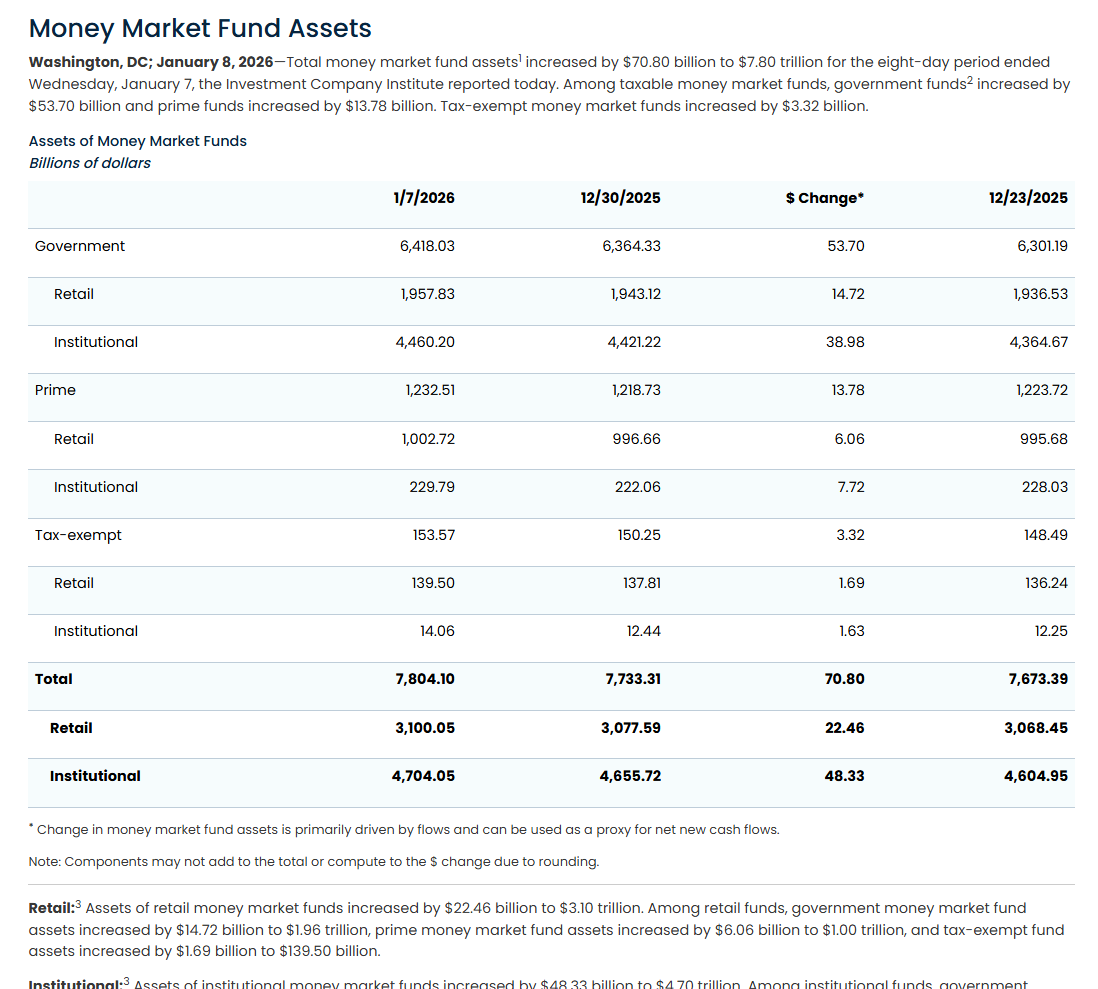
ICI data on money market flows in the week through Jan 8th saw inflows accelerate to +70.8bn (although less than half the $148.5bn EPFR recorded) which brought their seven week total to +$282.5bn.
Institutions (who hold ~60% of MMF assets), continued to lead inflows for the 7th week in 8, at $48.3bn bringing total inflows over the past 17 weeks to +$496.1bn.
Retail though also accelerated to +$22.5bn, the most in at least 5 months (I haven’t been keeping a record of this that long) now +$133.1bn the past 17 weeks).
Total MMF assets up to a record $7.80tn.
https://www.ici.org/research/stats/mmf
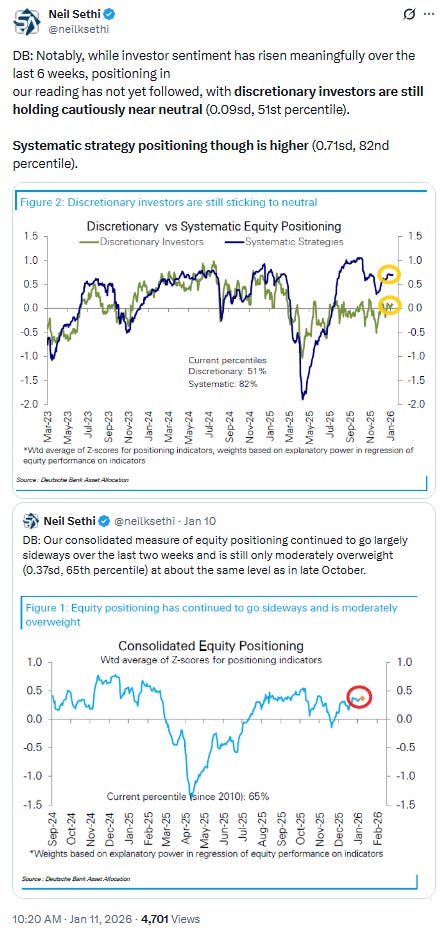
BoA again this week doesn’t provide any written commentary, but the charts on consolidated systematic positioning show we continue to move higher from the levels from late Nov, but also still not quite back to the levels seen in Sept (which were the highs of the year), but the highest since then.
And like the last several weeks we remain with an unbalanced outlook similar to what we had seen until mid-Nov with much less scope for buying then selling:
BoA estimates a combined +$22bn of buying in a flat market (down from +$34bn in their last estimate with buying driven by vol control and CTAs,
just +$2bn of buying in an “up” market (”up market” defined as 97.5 %ile price path or ~+3.5% similar to Goldman)),
but -$127bn selling in a “down” market, slightly down from -$132bn in their last update (”down market” defined as the 2.5 %ile price path or ~-2.9% (different than Goldman who uses --4.5%)).
CTAs dominate the selling in a down market (due to both increased volatility but more importantly breaking sell triggers) representing -$86bn of the -$127bn in combined estimated selling but vol control is becoming a larger piece adding the rest (with some very small risk parity buying).
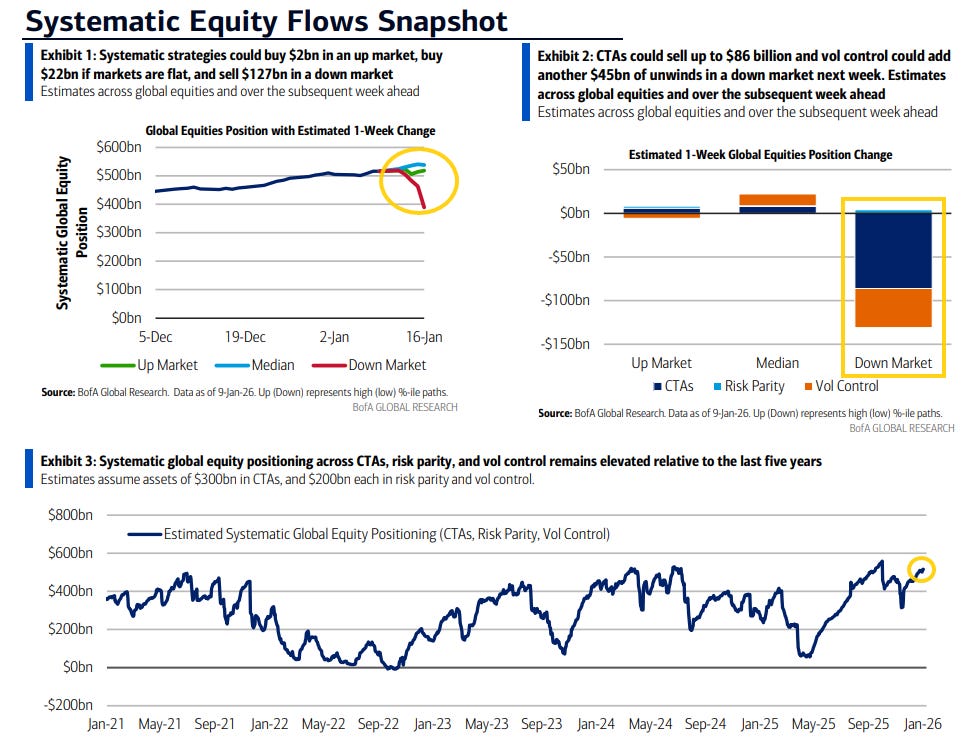
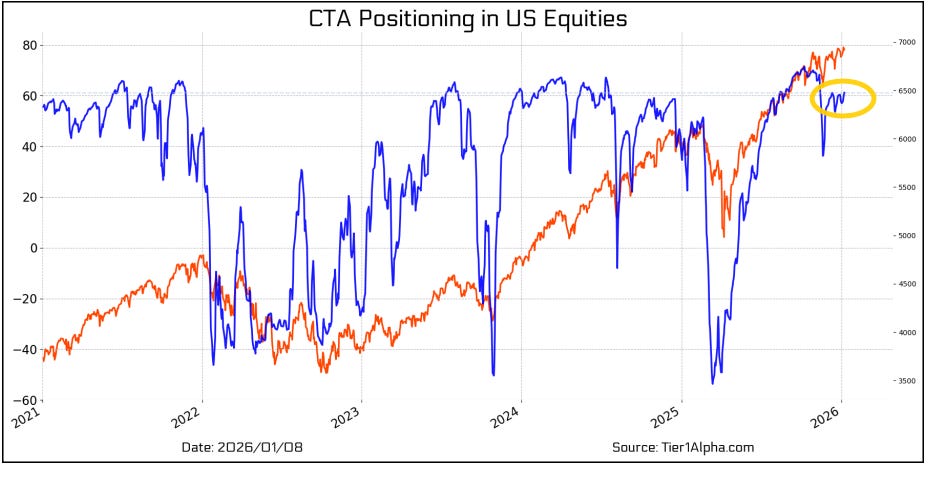
Tier1Alpha continues to model a little less of a rebound in overall systematic positioning just now getting to the levels of late Oct and just above the average net length to 2011.
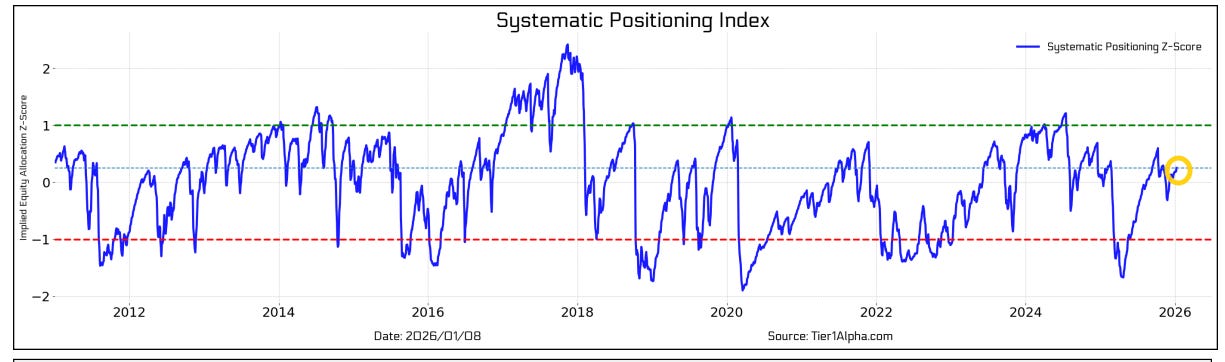
DB sees systematic positioning even more full remaining at the 82nd %ile net length to 2011.
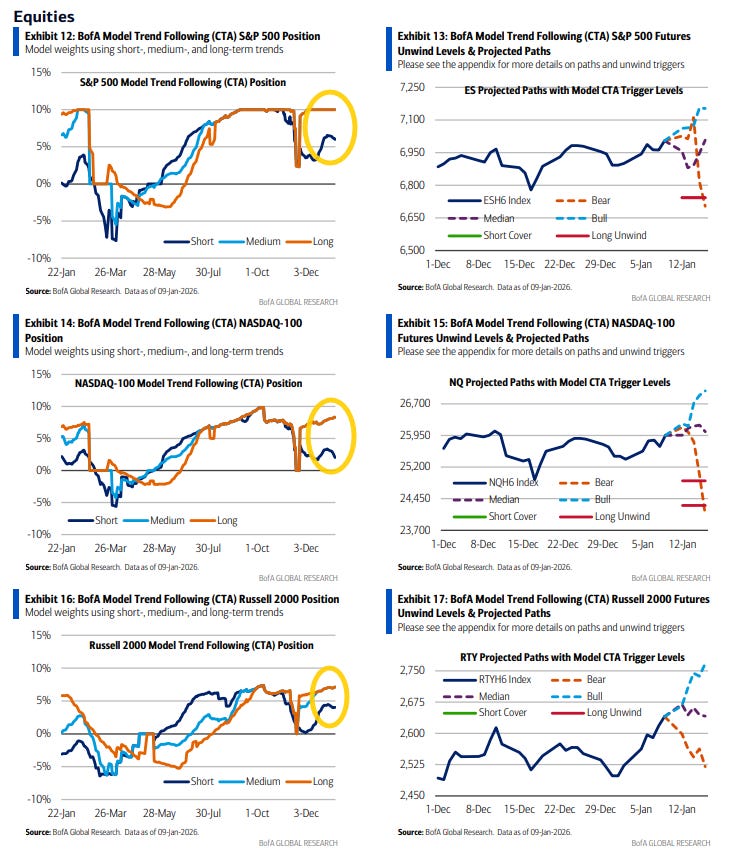
Looking more specifically at CTA (systematic trend follower) positioning in the US indices, BoA says:
“CTAs with medium- to long-term trend signals remain stretched long across US equities. Short-term models are more sensitive to spot price movements, adjusting positions as markets shift, while medium- to long-term models rely more on volatility dynamics to guide positioning. With equity markets hovering near all-time highs, the near-term risk of position unwinds is less; we estimate it would take at least a 3.5% decline for the first unwind triggers to hit.”
As a reminder, BoA now looks at bullish, flat, and bearish price paths (which are based on price trend vs moving averages), but also in short, medium, and long term price trends. It appears that we continue (as we have since early December) to see only the shortest not yet having brought their positioning back up to the levels from early Nov (and short-term CTAs saw positioning fall last week) leaving less room for CTAs to add per the systematic positioning summary, but they also see a good amount of breathing space before any selling would take place.
They don’t therefore provide buy levels (as that is more volatility dependent as they note) but they see the first layer of sell triggers at 6743, 24876 on the SPX, NDX respectively.
DB sees CTA equity positioning at 73rd %ile to 2010 up from the 56th %ile six weeks ago. In terms of the US, long positioning is at just the 54th %ile in the SPX, 53rd for the RUT and 46th for the NDX, so seeing more room to expand than BoA models.
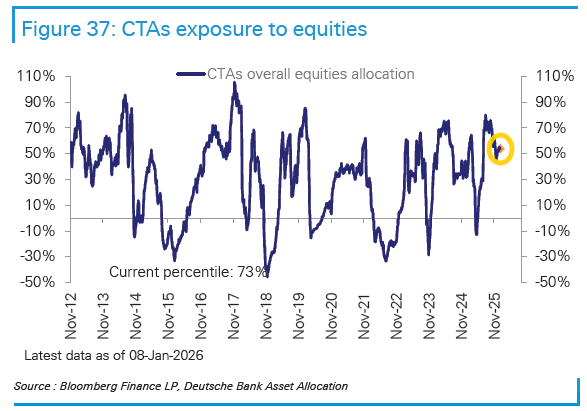
Tier1Alpha sees CTA positioning in US equities more in the mode of BoA closer to full positioning.
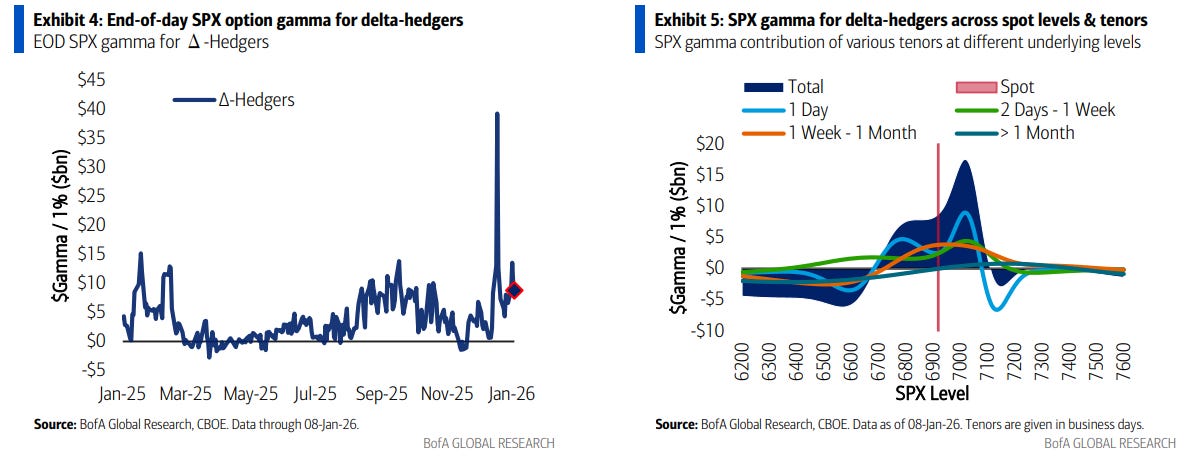
BoA on SPX gamma:
“Except for sporadic episodes, 2025 was not characterized by elevated SPX gamma; the average for the year was +$3.6bn (only the 5th highest yearly level in the last decade) compared to 2024’s +$6.2bn which was the largest on record. However, gamma has been persistently elevated (avg. of +$9.6bn ytd.) ever since it set a new all-time-high of +$39bn on 23-Dec. On Thursday gamma was +$8.8bn.”
As BoA notes, while gamma had been quite low for most of 2025 it picked up into year end and remains a little over double the 2025 average, which should cushion volatility.
BoA continues to model gamma building on moves to that 7050 area (which is an interesting spot as Tier1Alpha says the JEPI call strike is 7155, so perhaps BoA disagrees) but falling off on declines, although not turning negative until the 6700 level. So a good amount of room to the downside before we need to worry about a decline turning quickly more severe.
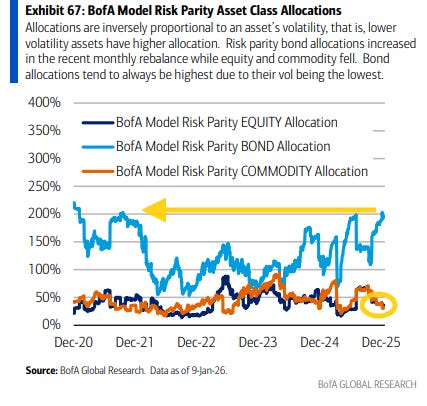
BoA’s estimate of risk parity positioning (which they estimate at around $200bn of AUM at max exposure) saw another week of increase in the leveraged exposure to bonds, now at the highest since 2020, and while the stock and commodity exposure continue to drift lower.
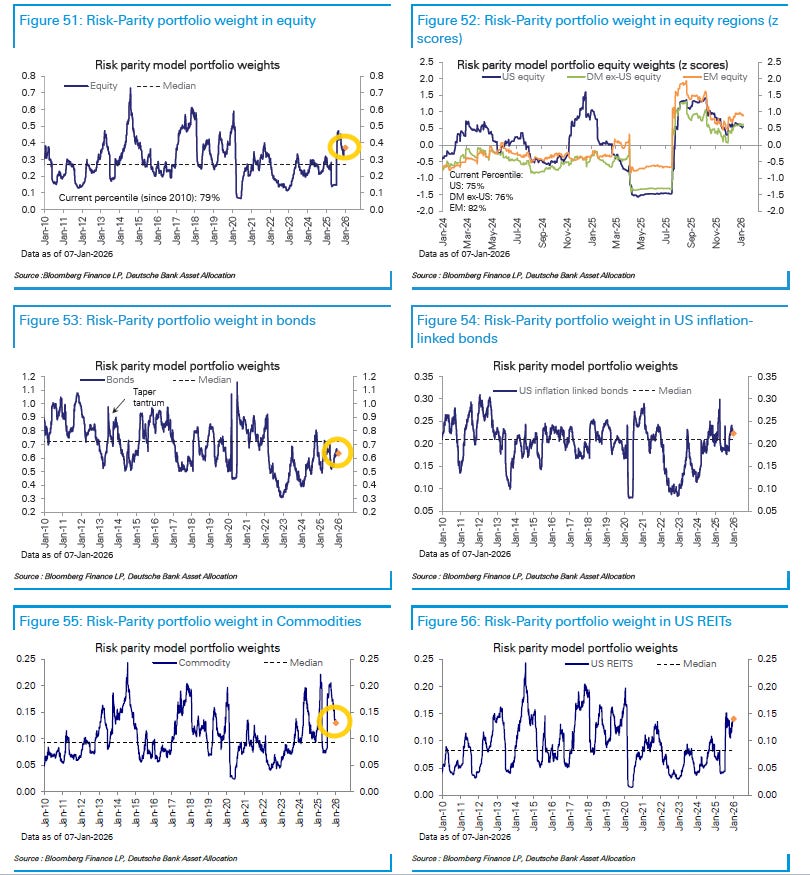
DB models risk parity funds (est ~$250bn in max AUM) much differently with the equity allocation at the 79th %ile and commodities the 77th but bonds at just the 37th (although the charts don’t look quite in line with that):
“Risk-parity funds’ overall equity allocation moved largely sideways this week (79th percentile), with the allocation staying flat in the US (75th percentile), edging slightly higher in other developed markets (73rd percentile), and edging down in EM (83rd percentile). Their allocation to bonds (37th percentile) inched up, while allocation to inflation-protected notes (64th percentile) and commodities (77th percentile) was trimmed.
With the relatively subdued volatility, BoA’s estimate of vol control equity exposure (which they estimate at around $200bn of AUM) continued to edge higher. While not yet at the 2025 peak, it is quite full historically.
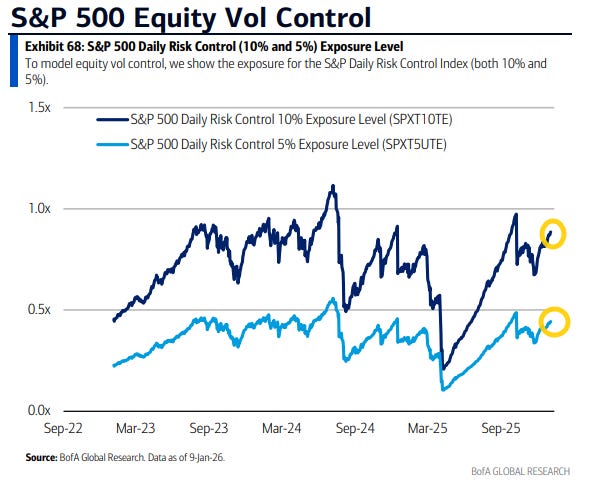
DB sees vol control funds at “their historical maximum,” with their “sensitivity to market selloffs low”.
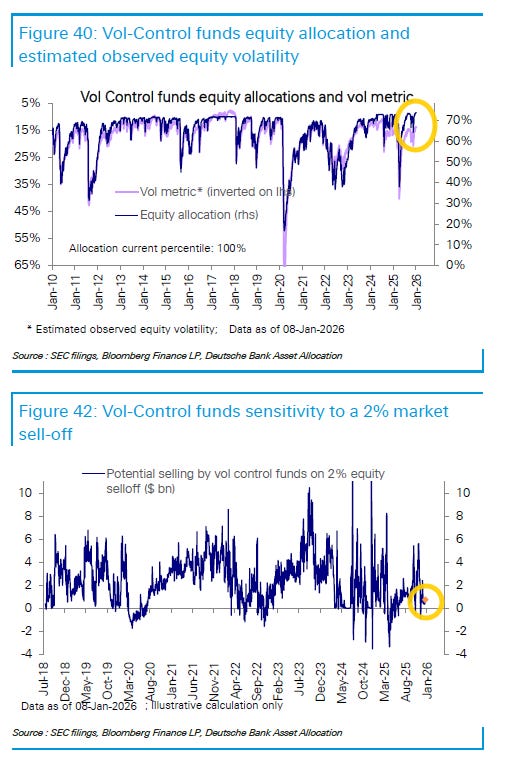
Tier1Alpha in contrast sees vol control edging back their net length to more neutral levels.
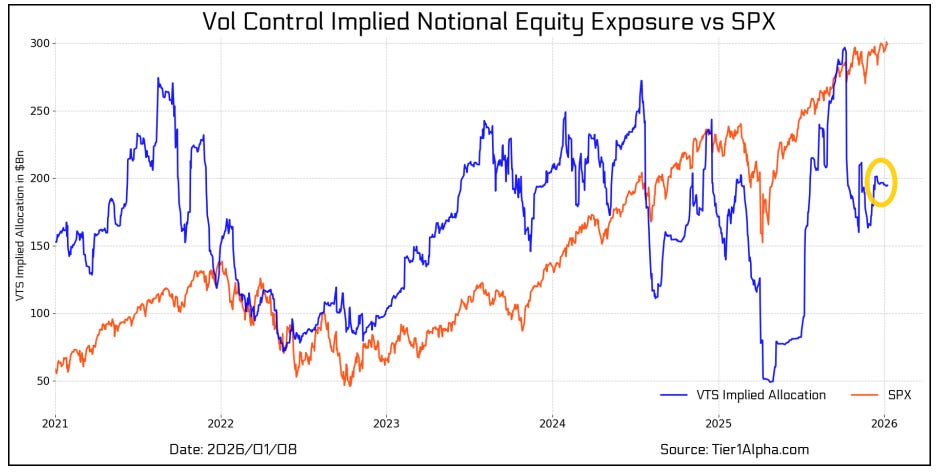
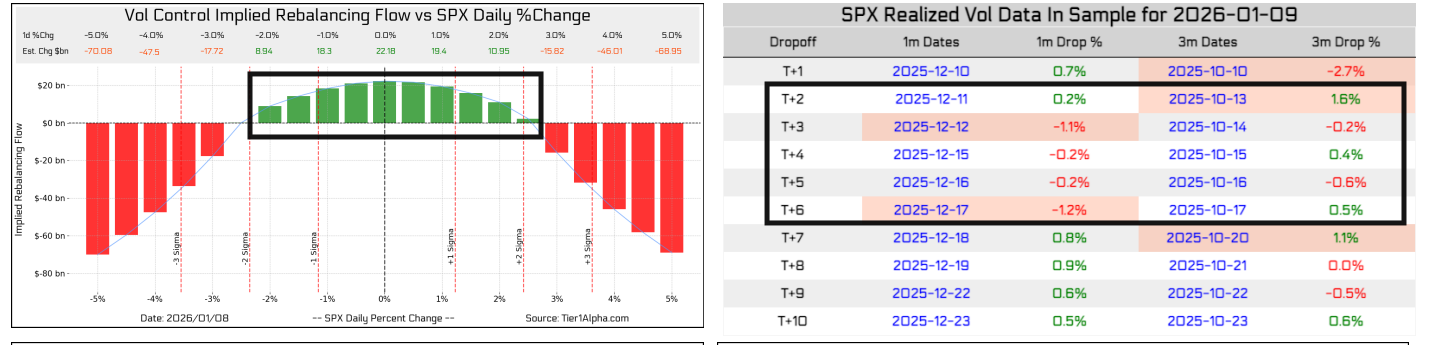
But they see it likely that vol control exposure moved higher Friday (which likely aided markets) as a 2.7% day fell out of the 3-month lookback (which is “the new rebalancing toggle,” as it has moved over the 1-month), along with a 1.5% day Monday (and a 1.1% day next Monday). There is also a 1.1% day falling out of the 1-month.
“Overall, we could see as much as $20B in buying requirements hit the tape over the next several days, providing a non-discretionary tailwind for the equity market into early [this] week.”
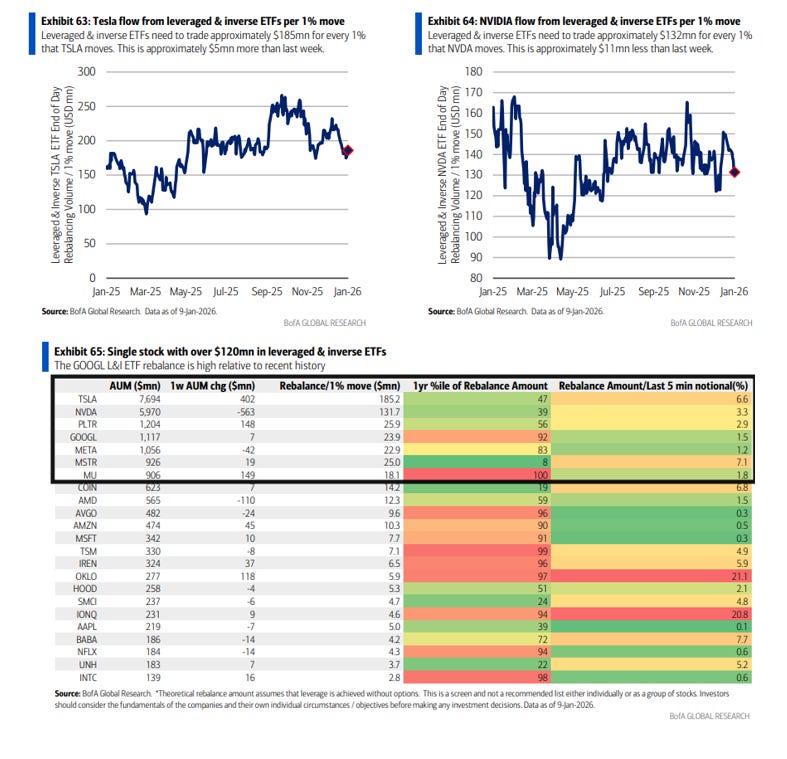
I like to look at the impact of moves in leveraged ETFs on the overall market as a barometer of risk appetite (the greater the impact, the more investors have in these ETFs which I think of as “higher risk”), and both SPX and NDX leveraged ETF AUMs moved higher although both remaining below the levels from early Nov (and further from the levels in late July). Both though much, much closer to the highs of the year than the lows.
Remember, this is a “constant negative gamma” source as Charlie McElligott put it in a Oddlots appearance (meaning that there is double/triple buying pressure from them as they rebalance each day).

Looking at the two largest single stock ETFs $TSLA and $NVDA, in line with the pivot away from the Mag-7 both have seen their AUM’s fall back the last few weeks although they went in different directions last week with TSLA ETFs adding +$0.4bn in AUM to $7.6bn (which is now a 6.6% rebalance amount daily in the last 5 minutes (the 47th %ile over the past year)), while NVDA leveraged ETFs fell -$0.5bn to $6.0bn (39th %ile rebalance over the past year).
$PLTR remained in third place at +$1.2bn, but $GOOG overtook $META ($1.11bn vs $1.06bn). MSTR remained in fifth place ($0.93bn) but Micron $MU is right behind now at $0.90bn.
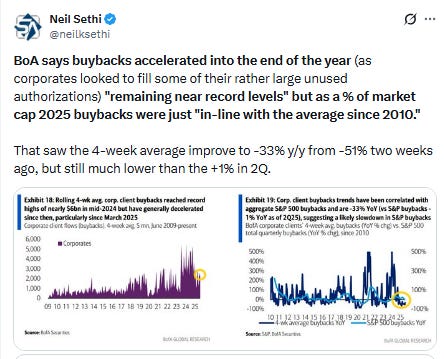
And after buybacks ended 2024 at record levels and started 2025 even better, they had by and large remained below seasonal averages since April until October when they seemed to have picked back up (depending on who you ask), but according to BoA they accelerated into year-end but still just in line with the average since 2010 on a market cap weighted basis We are now into the the buyback blackout window which will continue for the next few weeks which take away discretionary buybacks.
And some other notes on positioning:
Sentiment
Sentiment (which I treat separately from positioning) is one of those things that is generally positive for equities when its above average but not extreme (“it takes bulls to have a bull market”, etc.), although it can stay at extreme levels for longer than people think, so really it’s most helpful when it’s at extreme lows (“washed out”). We got close to washed out levels in April before steadily recovering much of that through late July (when I said we were “getting to” euphoric).
Since then things had been much more mixed on the sentiment front, before again moving back towards the July levels in later October (and in some cases exceeding them (NAAIM hitting the highest in over a year, and a variety of other metrics like II bulls-bears, BoA Bull/Bear indicator, 10-day put/call ratio, etc., hitting the most frothy levels of the year)). Those all fell back though along with the equity drawdown in November, and a couple hit at or near extremes for the year at the end of November. But like clockwork they rebounded along with the equity recovery although only a couple are really anywhere near extreme levels, but the list is growing.
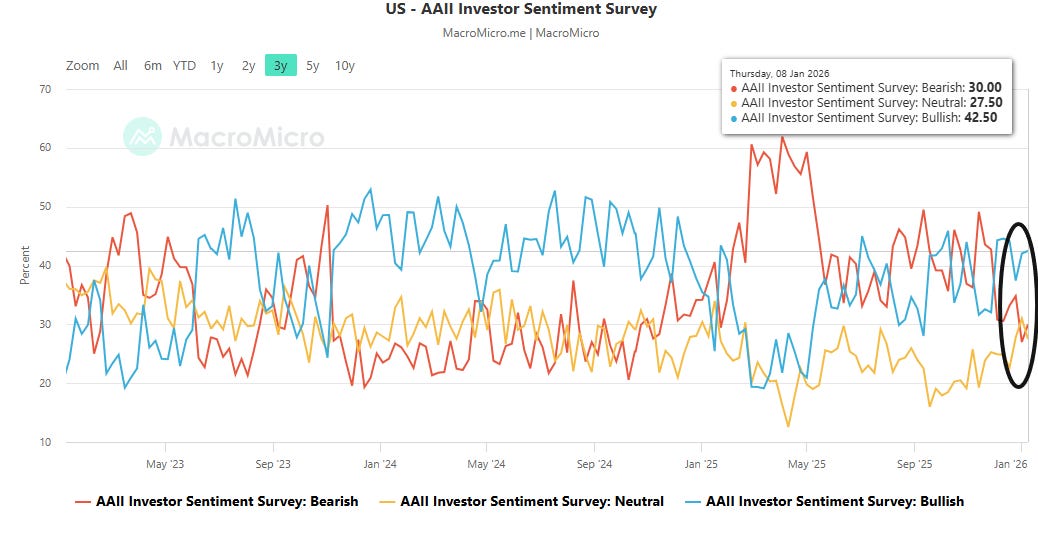
A couple of the AAII bears who “moseyed over to the fence” as Helene puts it her RealMoney columns moseyed back with not many joining the bulls yet:
AAII bulls (those who see higher stock prices in 6 mths, blue line) edged higher to 42.5% from 42.0% the prior week (still down from 44.6% Dec 11th, which was the highest since Oct 8th), remaining above the long-term historic average of 37.5% for the 5th week in 6.
Bulls also remained above the level of the bears (who see lower stock prices in 6 mths, red line) for a 6th week, the longest streak since 2024, but their ranks grew a little more than the bulls to 30.0% from 27.0%, which was the least since Oct ‘24. Bears though remained under the long-term average of 31.0% for a second week but only the 6th time since Dec 12th.
With both bulls and bears increasing, the Neutral camp (yellow line), which shot to 31.0% the prior week, the highest since Jan, fell back to 27.5% remaining under the long-run average of 31.5% for the 76th week in 78 (since July ‘24).
https://aaii.com/sentimentsurvey
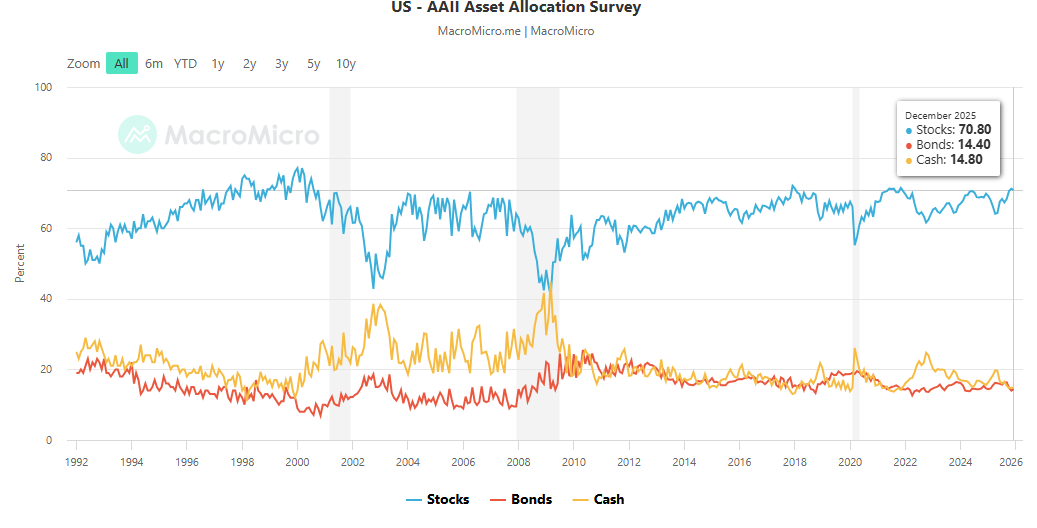
The AAII asset allocation survey saw the allocation to stocks edge down to 70.8% in December from 71.2% in Nov, which was the highest since Nov ‘21, moving into bonds which edged up to 14.4% from 14.0%, which was the least since May ‘24, while cash remained at 14.8%, a tenth off the 14.7% in Oct which was the least since Nov ‘21.
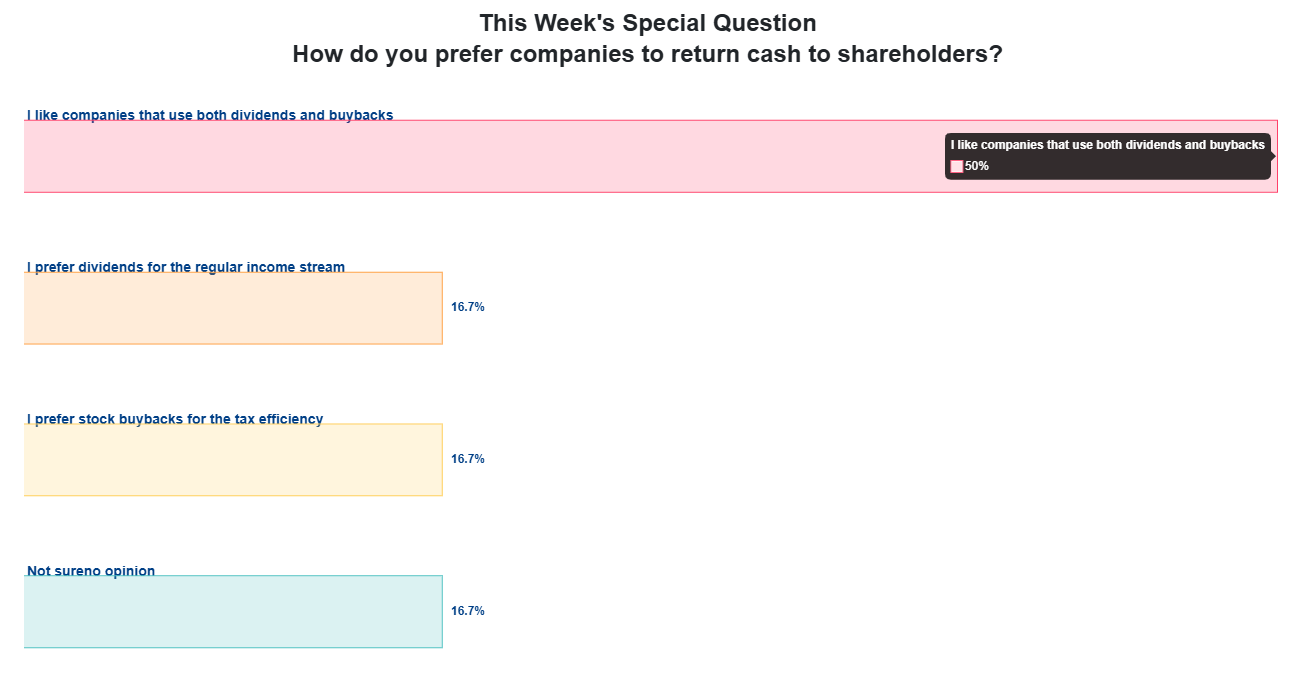
In the special question this week AAII asked “How do you prefer companies to return cash to shareholders?”
Half (50%) said they liked a mix of dividends and buybacks.
The other choices saw a perfect three-way split with 16.7% each choosing “dividends for the regular income stream,” “buybacks for the tax efficiency,” and “no opinion”.
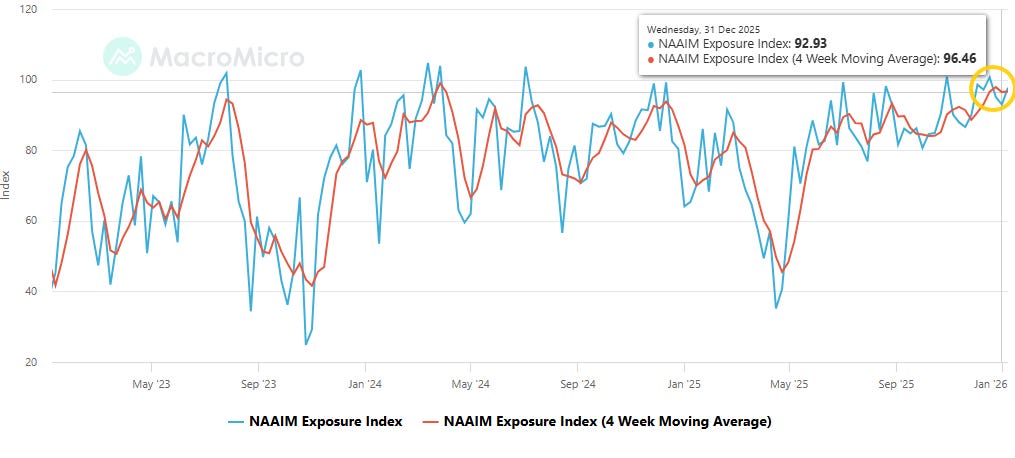
NAAIM (investment managers) exposure index (blue line) edged higher after softening for two weeks after exceeding the 100 mark for the second time in 2025 three weeks ago (which means that the average respondent (investment manager) is levered long equities), up to 97.72% from 92.93% still down from that 100.70% reading which in turn was just a touch under the 100.83% Oct 29th, which was the highest since July ‘24.
The 4-wk avg (reddish line) was little changed at 96.61% just below the 97.9% two weeks ago, which was the highest since Mar ‘24 (99.0%).
As a reminder, the index “represents the average exposure to US Equity markets reported by our members” and which ranges from -200% (2x short) to +200% (2x long).
https://naaim.org/programs/naaim-exposure-index/
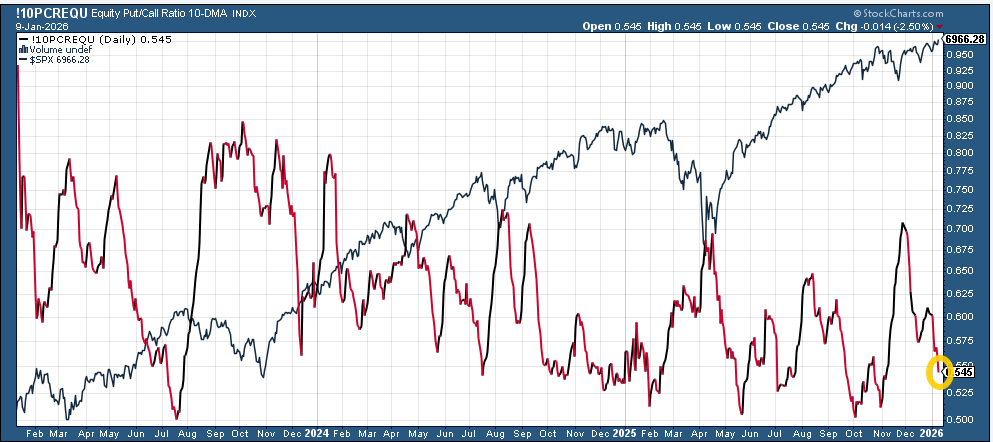
The 10-DMA of the equity put/call ratio (black/red line) after turning back down the prior week fell to the least in a month at 0.55 from 0.60 a week ago, evidencing increased demand for upside vs downside protection (down from the 0.71 in late Nov (the highest in a year) and now closer to the 0.50 it hit at the start of Oct (which was the joint lowest in three years)).
When it’s increasing it normally correlates to a consolidation in equities and increase in volatility and vice versa.
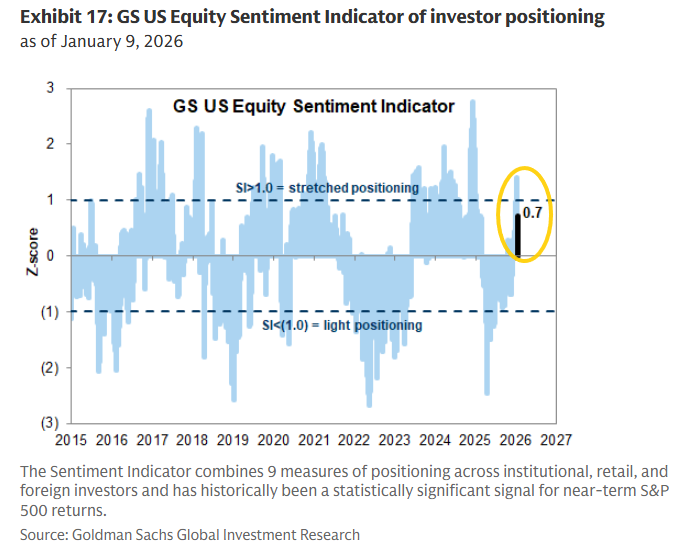
Goldman’s US Equity Sentiment Indicator after moving into “stretched positioning” (over 1.0) the prior week for the first time in nearly a year softened back to +0.7 but remaining positive for a fifth week.
The indicator combines “six weekly and three monthly indicators that span [across the more than 80% of the US equity market that is owned by institutional, retail and foreign investors]. Readings of +1.0 or higher have historically signaled stretched equity positioning. Readings of -1.0 or lower have signaled very light positioning and have historically been a statistically significant signal for subsequent S&P 500 performance”.
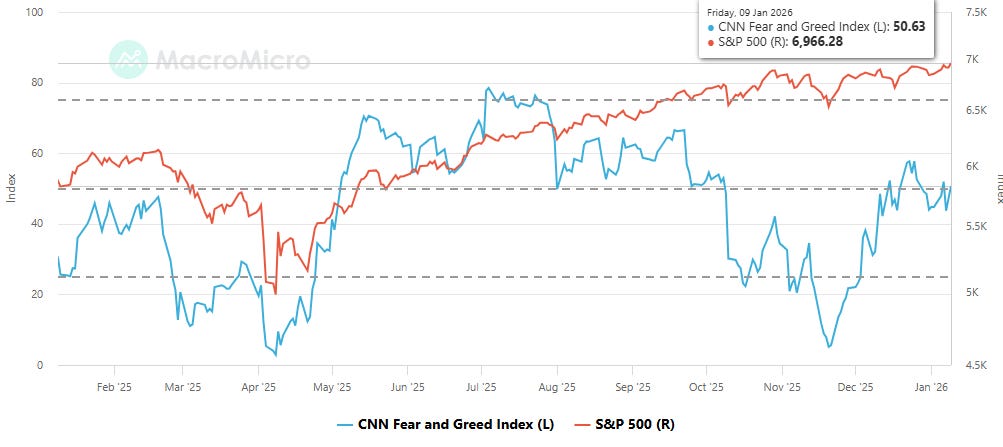
The CNN Fear & Greed Index (blue line) was choppy but rose w/w to 50.63 from 44.63, remaining in “Neutral”, still below the 57.74 Dec 25th, the highest since Sep 22nd, but remaining a world away from the 6 it hit intraday on Nov 20th.
After having the seven indicators on one side or the other for the most part in 2025, they are spread pretty evenly this week:
Extreme Greed = junk bond demand (vs investment grade)
Greed = market momentum (SPX vs 125-DMA) (from Fear)
Neutral = market volatility (VIX & its 50-DMA); stock price strength (net new 52-week highs) (from Fear)
Fear = stock price breadth (McClellan Volume Summation Index); safe haven demand (20-day difference in stock/bond returns) (from Extreme Fear)
Extreme Fear =put/call options (5-day put/call options) (from Fear)
https://www.cnn.com/markets/fear-and-greed
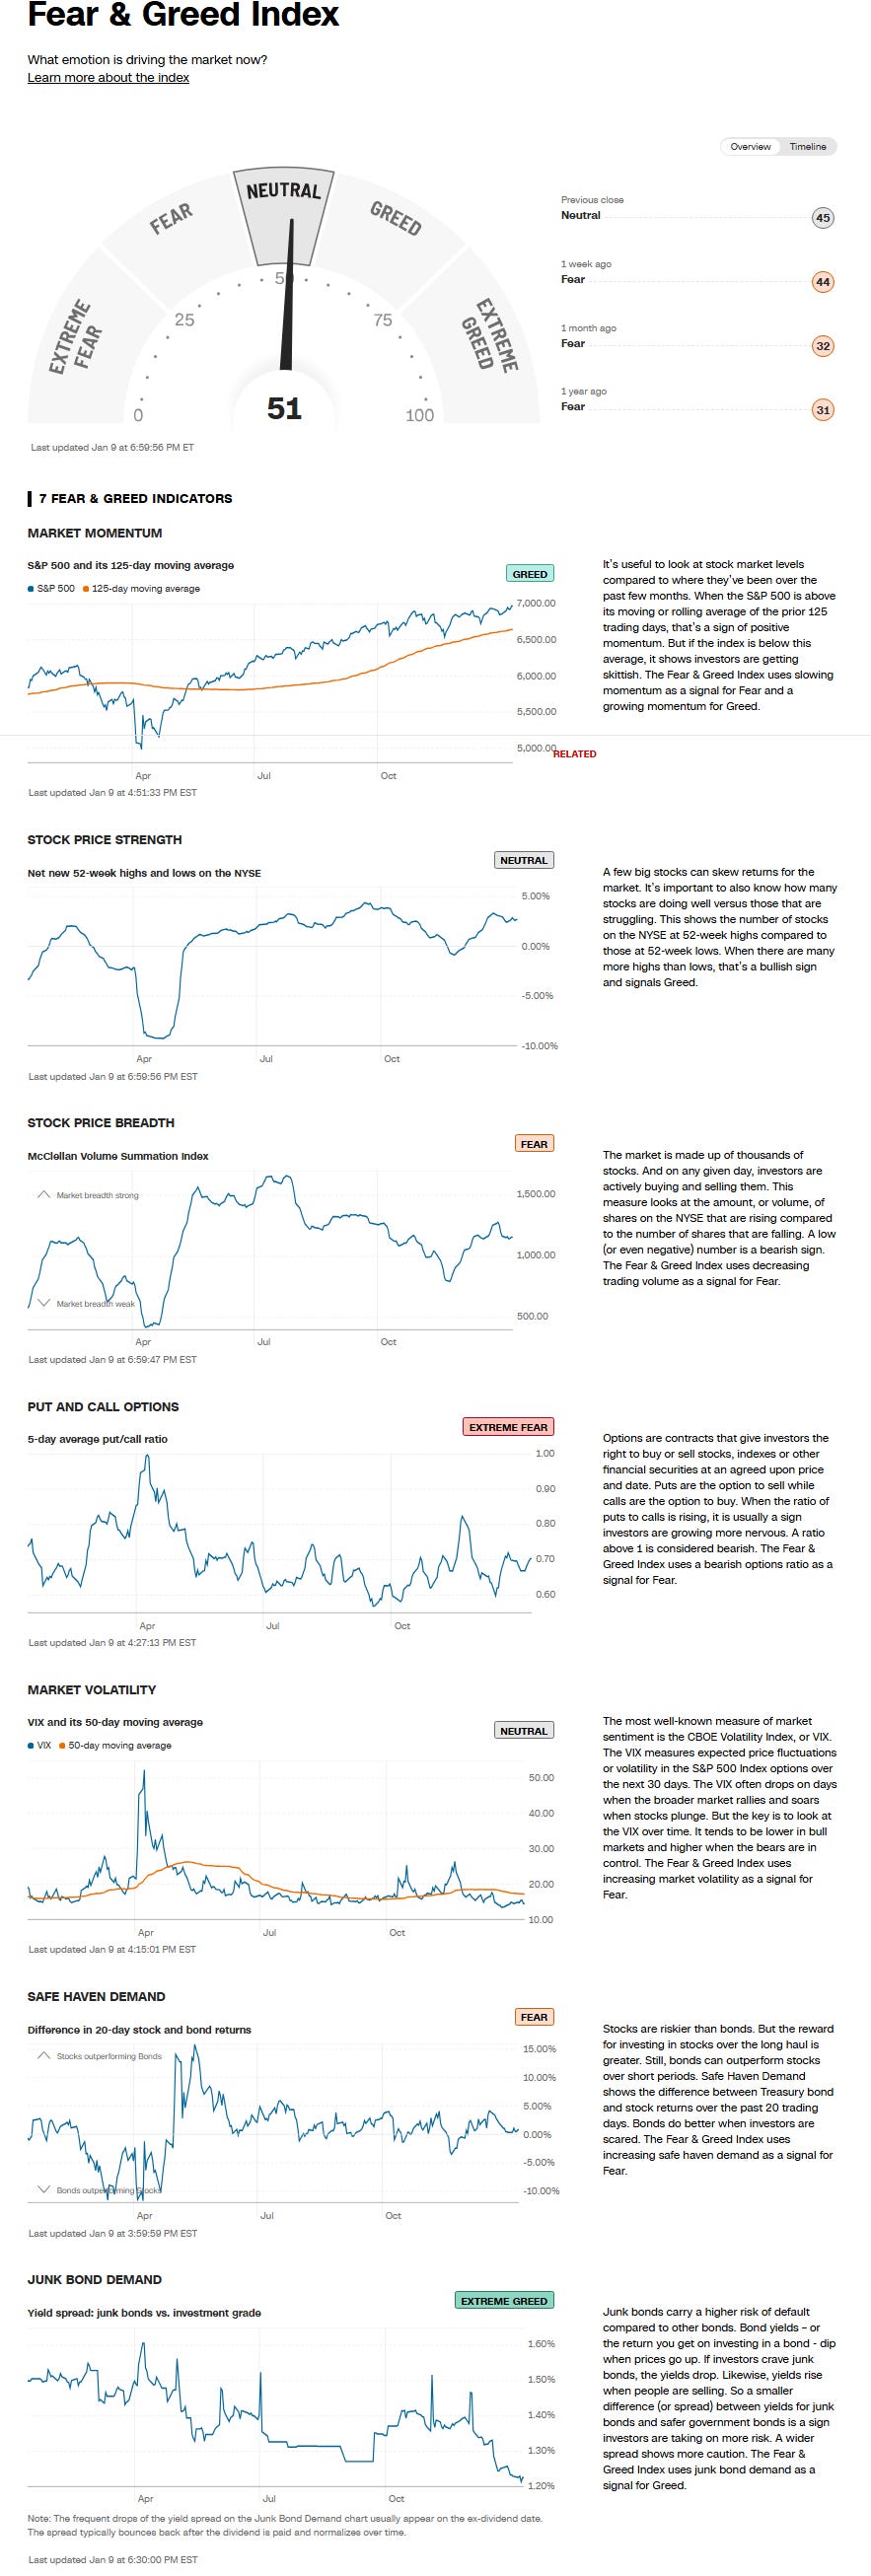
The revamped BofA Bull & Bear Indicator is now at 9.0, exceeding the 8.9 on Oct 1st which was “an extreme bullish level last seen in Feb’18 & Feb’20,” and remaining above the “contrarian sell signal” level.
“[O]utflows from tech stocks & EM debt [were] offset by very strong global equity breadth (98% of country indices above 200dma), super-low BofA Global FMS cash positions (record low 3.3%), hedge funds adding to S&P 500 longs via futures; new revamped B&B Indicator 8.5 on Dec 17th, 8.8 on Dec 24th, 9.0 on Dec 31st [and Jan 7th]”
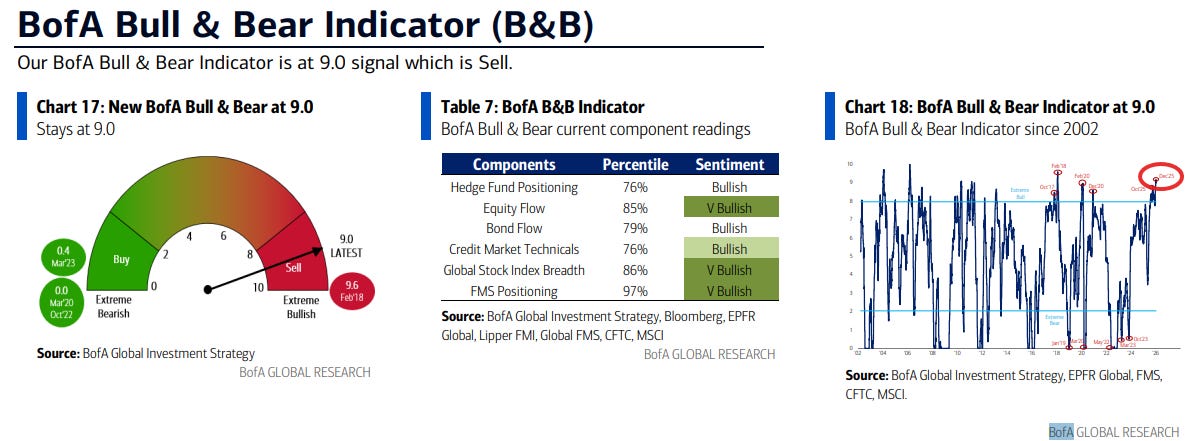
Hartnett notes the the “old” BofA Bull & Bear Indicator1 dropped from 7.4 to 7.2 (Chart 5).
The record streak of bullishness in Helene Meisler’s weekly poll extends to a 13th week (after breaking the 10-week streak from early 2021 two weeks ago). As I said then, “like this streak, that streak was after an extended bull run which carried on from there.”
And the bullishness accelerated a bit to 60.9% voting next 100pts higher on the SPX from 57.4% the prior week, but still below the record high of 73.3% three weeks ago.
While they started the year unusually much more wrong than right (but also after Helene had to start with a new X address which dropped her followers dramatically), they have been more accurate since the start of October (mostly coinciding with their newfound bullishness).
The low of the year was 33.2% on May 17th (also a record).
And the link to Helene Meisler’s always excellent Weekly Chart Fest.
Her message this week:
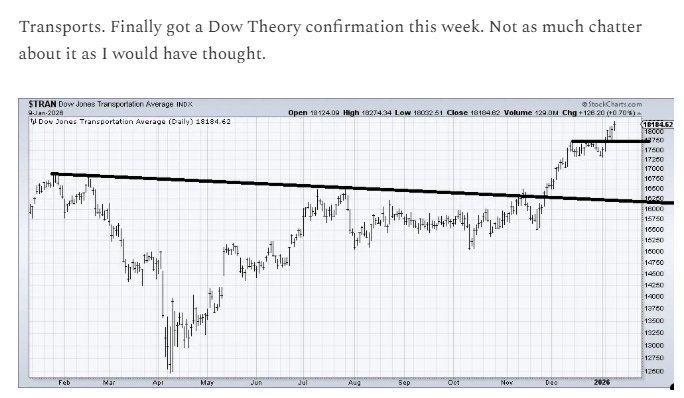
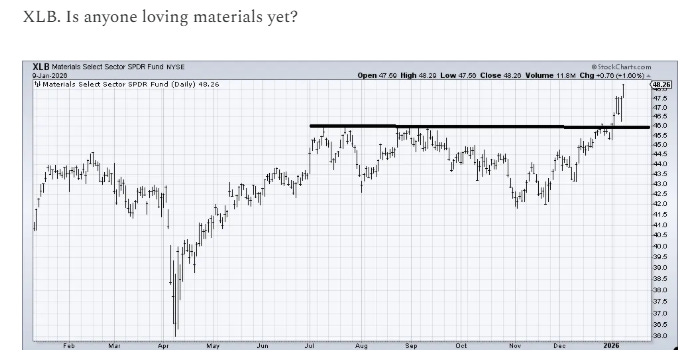
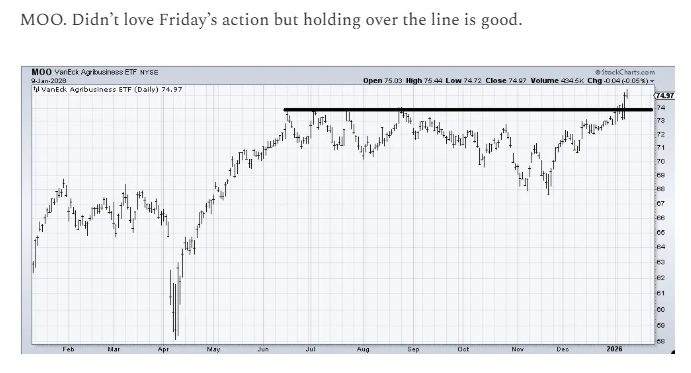
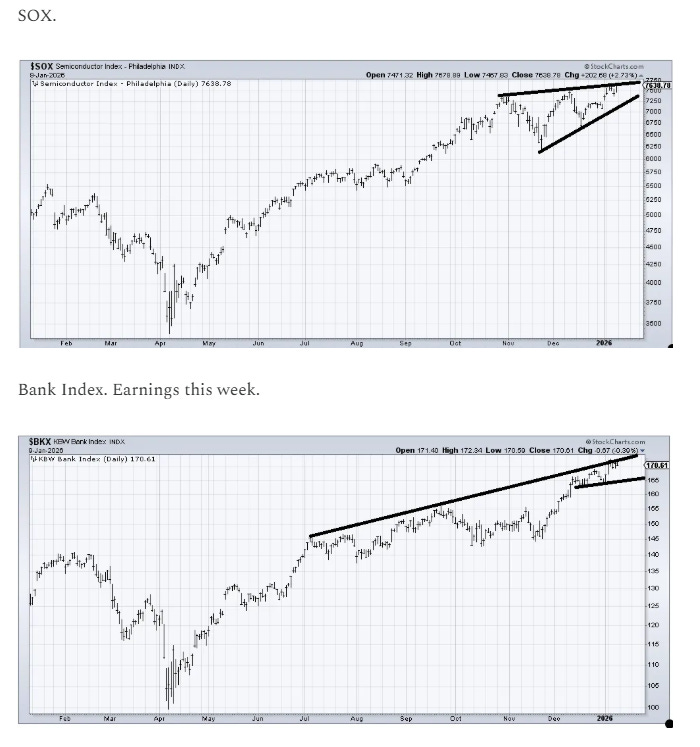
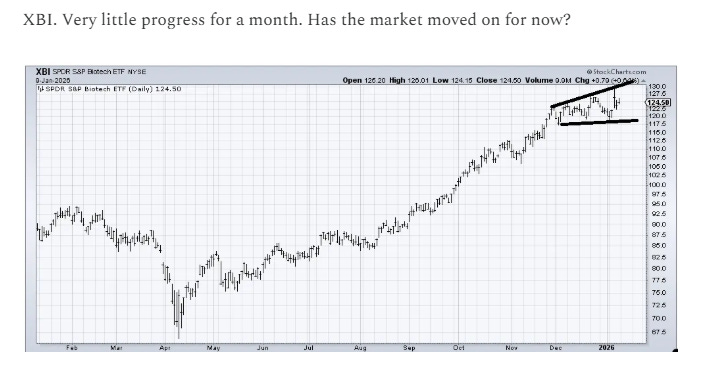
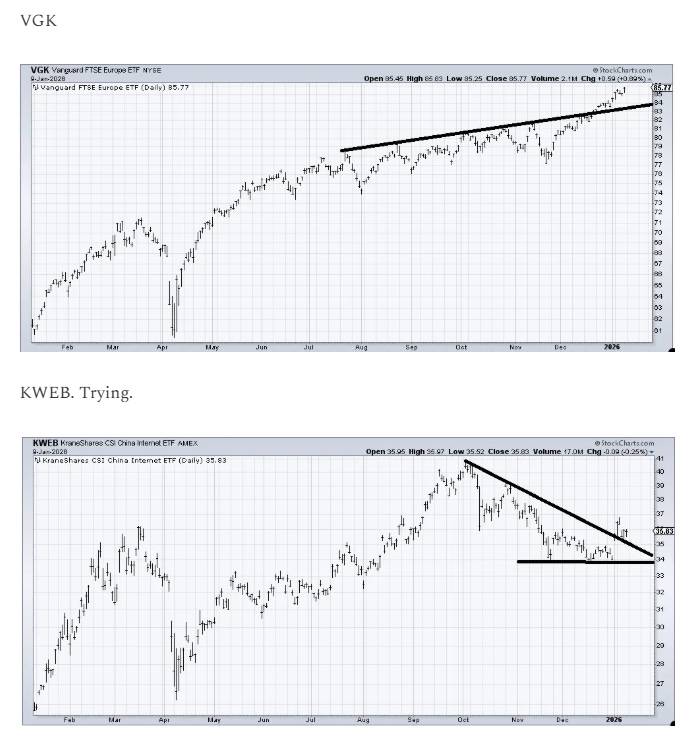
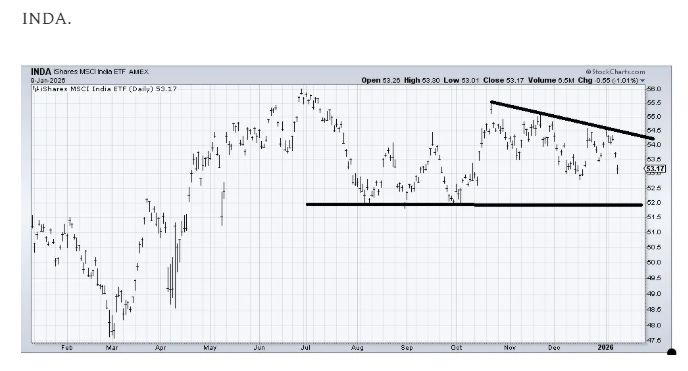
We certainly had a rally this week in the 493 so I’m eyeing which groups made higher highs. XLB and MOO (two relatively new charts here) did. I’m also eyeing the groups that stalled out (looking at the banks and semis and biotechs). Away from the US, VGK kept on going, INDA disappoints me and KWEB continues to shape up.
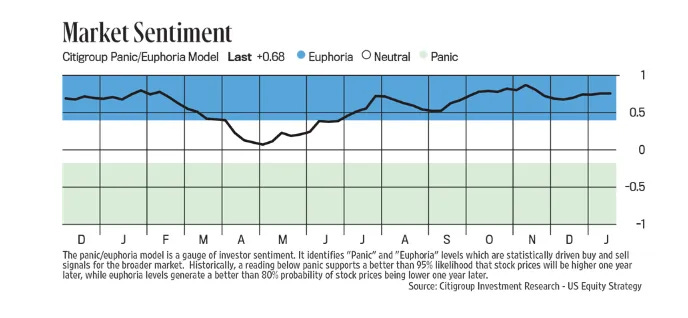
It normally includes Citi’s Panic/Euphoria Index which fell almost to the zero line at the end of April, moved higher, softened again in August but never left Euphoria before hitting new 52-week highs six weeks ago before again softening but remaining well into Euphoria.
While the fine print says “[h]istorically...euphoria levels generate a better than 80% probability of stock prices being lower one year later,” it has seen a mixed track since the start of 2024:
-It entered euphoria in late March 2024 (when the SPX was around 5200). We didn’t get to 5200 by late March of this year, but we got closer than I would have thought at 5500 (and we did fall under for one day in April).
-The next entry into Euphoria was in late October 2024 w/the SPX around 5800. The closest we’ve been since the start of October was 6550.
This most recent entry was in July w/SPX at 6200. We’ll see how it does this time (so would need to be under 6200 July 2026).
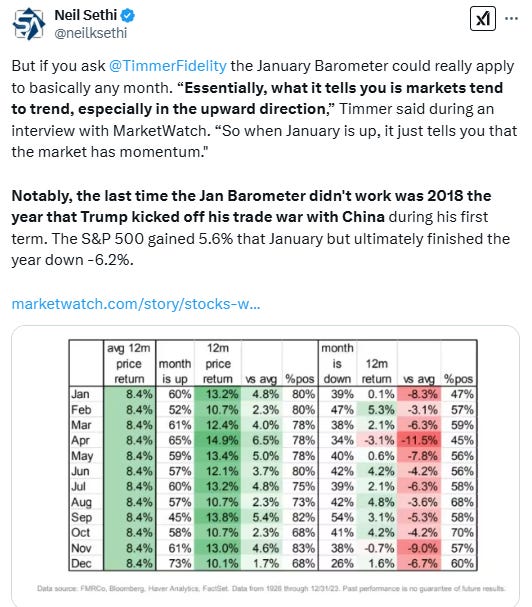
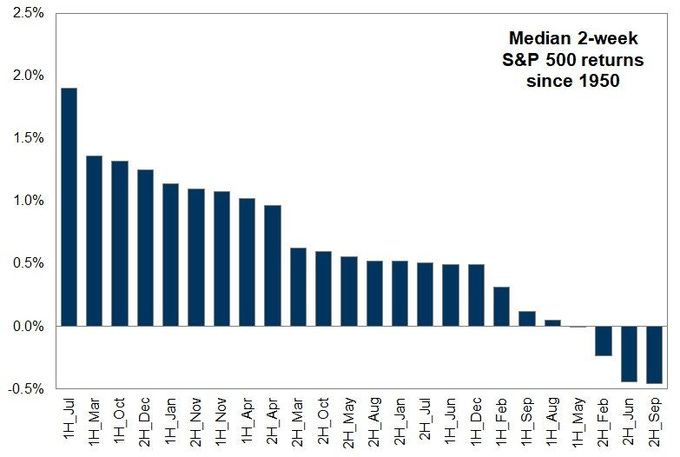
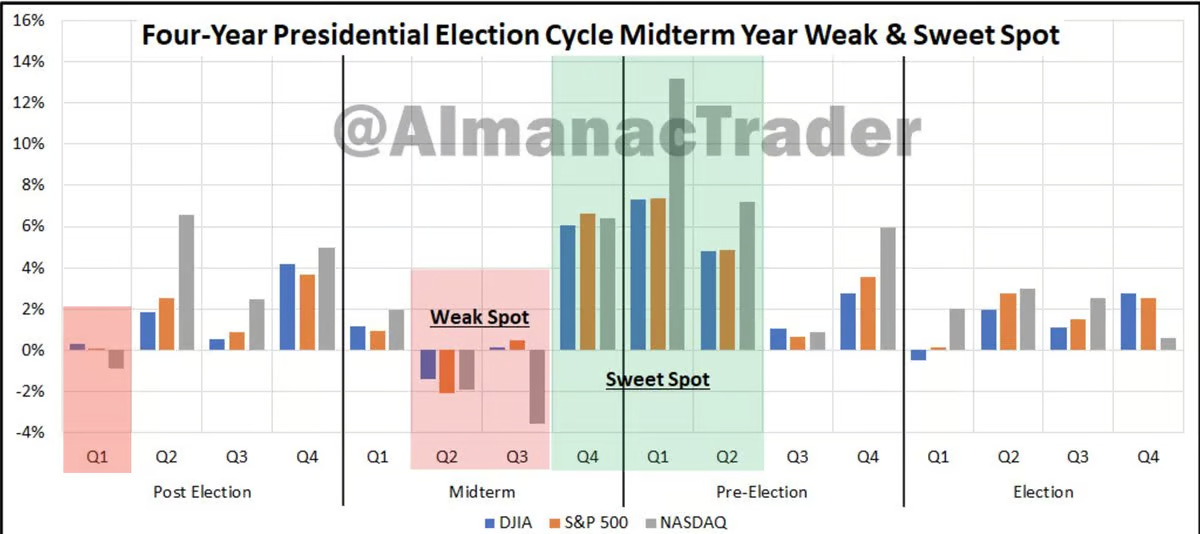
Seasonality
As we move into the first half of January seasonality is only slightly less strong in terms of the median return since 1950 at +1.2% down just a tenth from the second half of December, placing it 5th from the top.
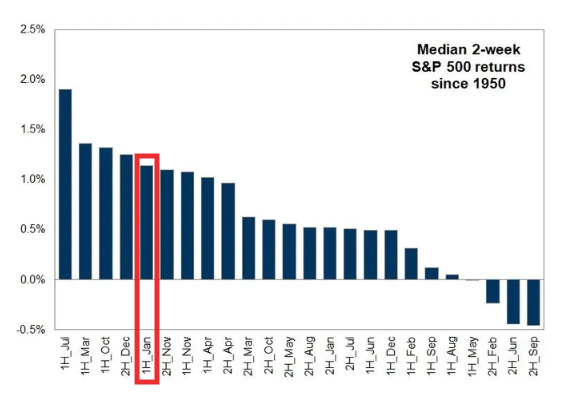
Looking since 1929 the first half of Jan is similarly relatively strong with an average gain +0.72%, the 5th best of all half-months and well above the all-halves average of +0.25%, and the median an even better +1.12% which is 3rd best also well above the all-halves median of +0.59%.
The first half of Jan has also been positive 62.9% of the time, tied for 4th best of all halves and vs the 56% average and 57% median for all halves, while the standard deviation (volatility of returns) is 3.52%, a touch above the all-halves avg/median of 3.5%.
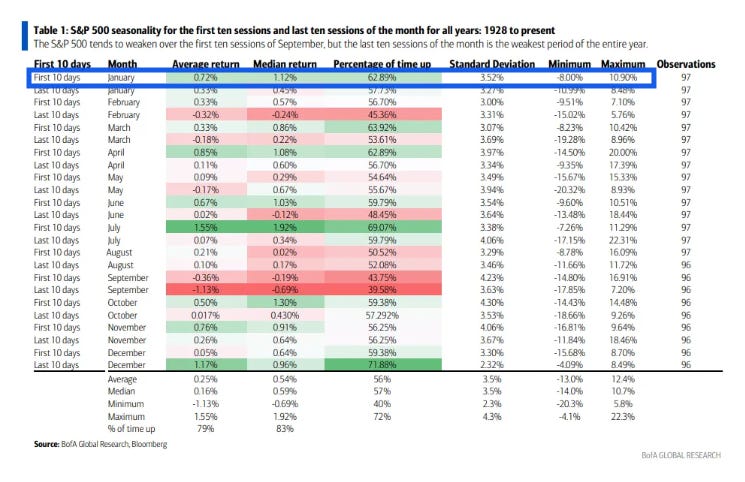
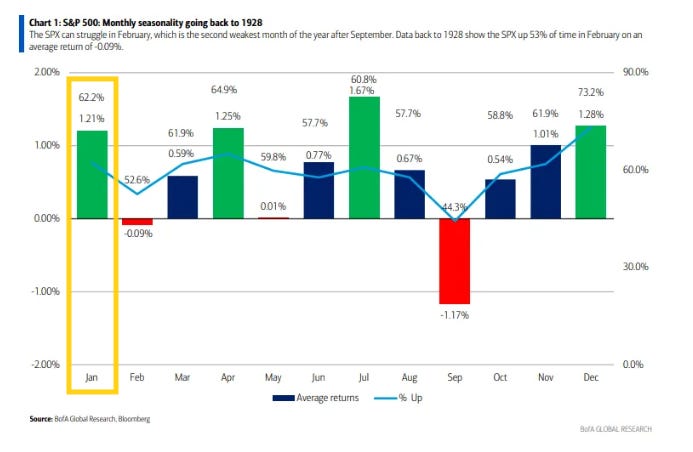
For the month as a whole, since 1928 January is the 3rd best month with an avg return of 1.21%, up 62.2% of the time.
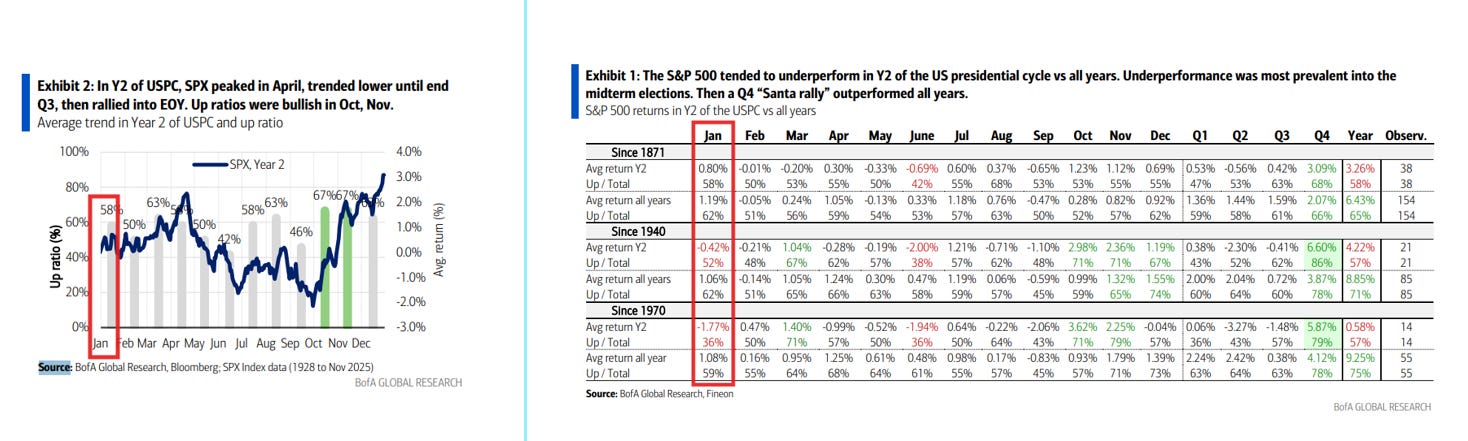
And looking specifically at Year 2 of the Presidential cycle, January has been up 58% of the time with an average gain of 0.80% (vs 62% and 1.19% for all year), but if we zoom in on since 1970, it’s up just 36% of the time with an average loss of -1.77% (vs 59% and 1.08% for all years).


Final Thoughts
As noted two weeks ago as we embark on a new year, I’ll be reworking this section. If you want the summary as to “how we got here” in 2025 you can see the Dec 21st Week Ahead in this section. I really didn’t get a chance to do much here this week for the reasons noted at the top.
The most recent part of that summary though remains relevant:
At the start of November it seemed that “concerns about the heavy AI spending, the Fed hawks [feeling] emboldened creating some concerns about rate cuts, rich valuations and very full equity positioning (especially systematic), etc.,” finally coalesced to the point of getting us our long delayed 5% pullback with the absence of any weekend headlines to provide a “stick save”. As I said then, the “good news is the pullback has skimmed off at least the top layer of froth,” meaning we entered the end of November “with valuations, positioning, sentiment, etc., all having moderated to levels that allow for renewed expansion.” And that’s exactly what we saw with one of the best Thanksgiving weeks ever (not that I was expecting that).
Since then things have been more challenging for the cap-weighted index (we’re currently just above the close on Oct 28th) with the AI trade remaining under scrutiny (which I believe is very healthy and will prevent the bubble many are worried about), but even beyond that, the “other 493” (represented by the equal-weighted SPX) are at those levels as well.
And as I said two weeks ago:
I mentioned five weeks ago things seem overall in favor of the bulls. Earnings expectations remain high (and increasing), seasonality doesn’t get much better (although that’s ending soon), buybacks are flowing (has already though started to slow with Q4 earnings season coming soon), the Fed while not a big tailwind is not a headwind (and there’s no question that the “Fed put” remains alive and well), Pres Trump is unlikely to be a negative catalyst (and likely to be a positive catalyst) through the midterm elections (and partly as a result volatility has receded to the lows of the year which fuels buying from systematic funds), the economy remains in decent shape even if the jobs market has cooled (that 3Q GDP print was something), etc. Sentiment indicators are mixed but the most frothy eased off last week, and the more important positioning indicators indicate a sufficient amount of caution with room for positioning to improve.
As I said several weeks ago, “I continue to believe as I have said for most of the year ‘for now it makes a lot of sense to be comfortably long stocks, with a plan in place for the inevitable 5-10% drawdown.’”
The one fly in the ointment is always something out of Washington (particularly if we get that Supreme Court ruling on the IEEPA tariffs which will definitely be market moving, although I’m thinking a negative ruling has been increasingly socialized so might not be as big of an event as I had thought earlier in the year).
And as I noted last week, despite the forced extradition of Maduro (which would be followed by a host of proclamations from Pres Trump on everything from defense industry buybacks to MBS purchases, not to mention a pile of economic data (which saw FOMC rate cut expectations pared back) markets have taken them mostly in stride with the SPX hitting a new high Friday (although futures are down modestly as I write this Sunday night as the Fed has been served grand jury subpoenas which as noted at the top could disrupt markets if it turns into a serious attack on Fed independence or credibility). So overall there’s not much that has changed especially with breadth getting back on track (as I noted last week “after a nearly 20% return, I am not reading much into the action to end the year”).
And as I’ve written since August:
The longer term story remains a positive one, and whatever happens between here and the start of November, I’ll likely turn more bullish to close out the year given its historically good track record. The Fed is embarking on a cutting cycle in what does not appear to be a recession (which has almost always resulted in market gains), earnings growth has been strong with revisions) the highest in years, we will continue to get more fiscal tailwinds from the OBBBA as we move into 2026 (as noted in the Economy section), the economy remains healthy with some evidence of acceleration (at least in Q3), corporate buybacks remain solid on pace for a record year (and we’ve exiting the discretionary buyback blackout), and retail continues to want to buy the dip. It’s when we start to see a majority of those flip that I’ll be more concerned.
And in the long term, as always, just remember pullbacks/corrections/bear markets are just part of the plan.


Portfolio Notes
Did not update this week.
Cash = 15% (held mostly in SGOV & BOXX (BOXX mimics SGOV but no dividend, all capital appreciation so get long term capital gains if you hold for a year)
Taxable Bonds/Fixed Income (mostly short duration like MINT, SHY, SCHO, ICSH, etc., but also 2% or so in longer term (TLH, TLT)) = 10%
Core equity positions (each 5% or more of portfolio (first 2 around 10% each, total around 25%) Note the core of my portfolio is energy infrastructure, specifically petroleum focused pipelines (weighted towards MLP’s due to the tax advantages). If you want to know more about reasons to own pipeline companies here are a couple of starter articles, but I’m happy to answer questions or steer you in the right direction. https://finance.yahoo.com/news/pipeline-stocks-101-investor-guide-000940473.html; https://www.globalxetfs.com/energy-mlp-insights-u-s-midstream-pipelines-are-still-attractive-and-can-benefit-from-global-catalysts/). That said, I should note that I would not necessary recommend such a large position in MLP’s at this time. I bought most of these positions a long time ago (many when oil briefly traded with a minus sign in front of it). At this point I have become “trapped” in them because of the way they are taxed as partnerships (selling them would trigger a very large tax bill). I don’t expect much out of them price-wise, but they will continue to kick off very good tax-advantaged yields and I will continue to sell out-of-the money puts and calls on them to generate additional income (hard to complain about 15% returns).
ET, EPD, BINC
Secondary core positions (each at least 1.5% of portfolio, less than 5%)
PAA, ENB, HYD
And the rest of the top 50 (all >0.5%, less than 1.5%):
GILD, XOM, VNOM, AM, AMZN, IBIT, BOND, URNM, ING, ARCC, TLH, MPLX, SLB, CRM, GSK, VICI, RRC, NVDA, TDG, GLD, CTRA, FXI, TLT, SCMB, MSFT, AR, DUOL, BIP, MRVL, OXY, OWL, BAYRY, CPER, VZ, DIS, PFE, DDOG, NKE, GTBIF, EWZ, O, BEP, ES, CHWY, CMCSA, BA, UNH, GIL, LULU, OBDC, INDA, MELI, PYPL, KKR, DVN, AXP, ARES, JPM, WDAY, FISV, YOU, ANET, TOST, ASML, ADBE, AVGO, COF, NOW, CI, UBER, GOOGL, AGNC, LVMUY, BRK/B, GDX
Note: EPD, ET, MPLX, PAA all issue K-1s (PAGP is the same as PAA but with a 1099).
Reminder: I am generally a long term investor (12+ month horizon) but about 20% of my portfolio is more short term oriented (just looking for a retracement of a big move for example). This is probably a little more given the current environment. I do like to get paid while I wait though so I am a sucker for a good well supported dividend. I also supplement that with selling calls and puts. When I sell a stock, I almost always use a 1-2% trailstop. If you don’t know what that is, you can look it up on investopedia. But that allows me to continue to participate in a move if it just keeps going. Sometimes those don’t sell for days. When I sell calls or puts I go out 30-60 days and look to buy back at half price. Rather than monitor them I just put in a GTC order at the half price mark.
To subscribe to these summaries, click below (it’s free).
To invite others to check it out,