


The Week Ahead - 2/16/25
A comprehensive look at the upcoming week for US economics, equities and fixed income

If you're a new reader or maybe one who doesn’t make it to the end feel free to take a second to subscribe now (although then you’re missing my hard hitting analysis!). It’s free!
Or please take a moment to invite others who might be interested to check it out.
Also please note that I do often add to or tweak items after first publishing, so it’s always safest to read it from the website where it will have any updates.
As a reminder, some things I leave in from prior weeks for reference purposes, because it’s in-between updates, it provides background information, etc.. Anything not updated this week is in italics. As always apologize for typos, errors, etc., as there’s a lot here, and I don’t really have time to do a real double-check (it’s a staff of 1).
The Week Ahead
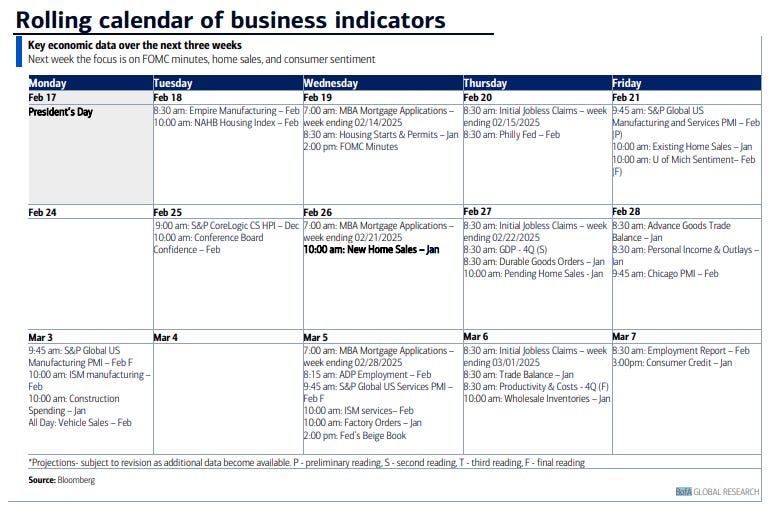
I noted following the unusually threadbare US economic data and Fed calendar the week of Jan 20th that you should take advantage of the “break” as the next few weeks would be full of a lot of that (economic data and Fed news) along with what was expected to be a stream of news announcements out of Washington plus the “meat” of the 4Q earnings season. And that proved to be the case. But now we’re on the other side of that, and things should in most respects slow through the end of the month (subject to a few items the last week of February in Nvidia earnings and the personal income & spending report).
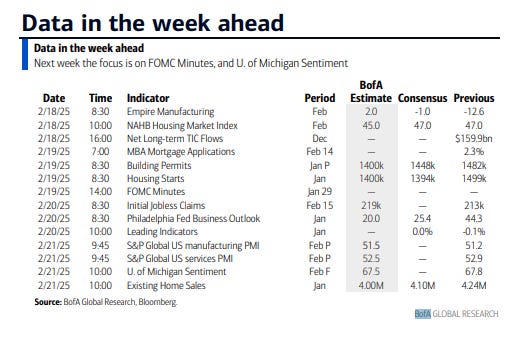
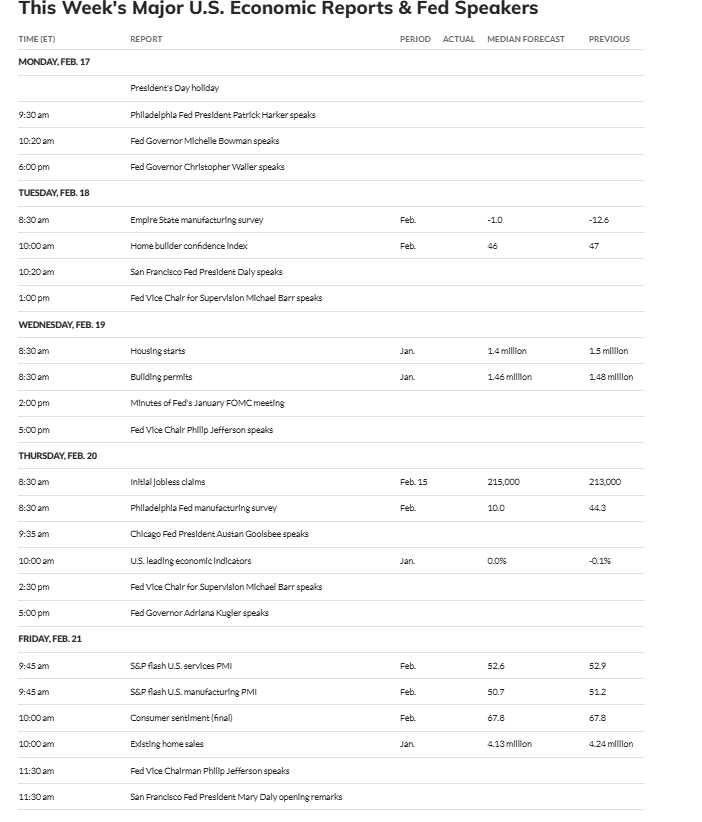
In terms of this week's economic data, there are no “top tier” reports, so we’ll have to make do with a number of reads on the housing market (Jan starts & permits and existing home sales, Feb NAHB sentiment, and weekly mortgage applications), as well as flash PMI’s (which in the US are important for less than two weeks (until we get the ISM’s at the start of the following month)), the final Feb U of Michigan consumer survey (does the jump in inflation expectations “stick”?), Jan LEI’s (nobody cares anymore after their recession signal failed), and weekly jobless claims.
We’ll also get some regional PMI’s but as you know I don’t care for those on an individual basis (far too much noise), but they do have some signal when put together at the end of the month (which Yardeni Research conveniently does (and which flagged the manufacturing PMI improvement we saw in ISM in Jan).
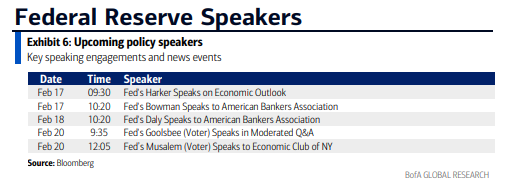
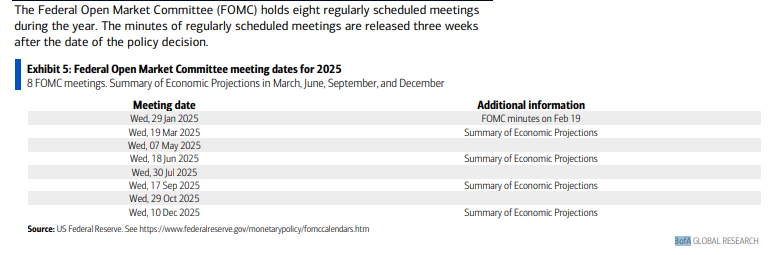
In terms of the Fed in the upcoming week, we won’t get Jerome Powell but we’ll get quite a few other speakers including Harker, Bowman, Waller (those three all Monday despite the holiday), Daly, Barr, Jefferson (the Vice-Chair so an important voice), Goolsbee, Musalem, Barr (again), Kugler, Jefferson (again), and Daly (again).
Perhaps more importantly, we’ll get the minutes from the January FOMC meeting on Wednesday afternoon. Those are “scrubbed” to provide a coherent “message” from the Committee so they’re always worth paying attention to and perhaps will give us some indication as to how many members now require a softening in growth versus just slower inflation before considering rate cuts.
Treasury auctions are light this week with just the 20-yr bond (which is not an in-demand duration so it’s hard to take much signal from it) and 30-yr TIPS (I won’t even cover it unless something extremely unusual happens) in addition to the normal cadence of T-Bills (<1yr in duration, we'll get $278bn this week).
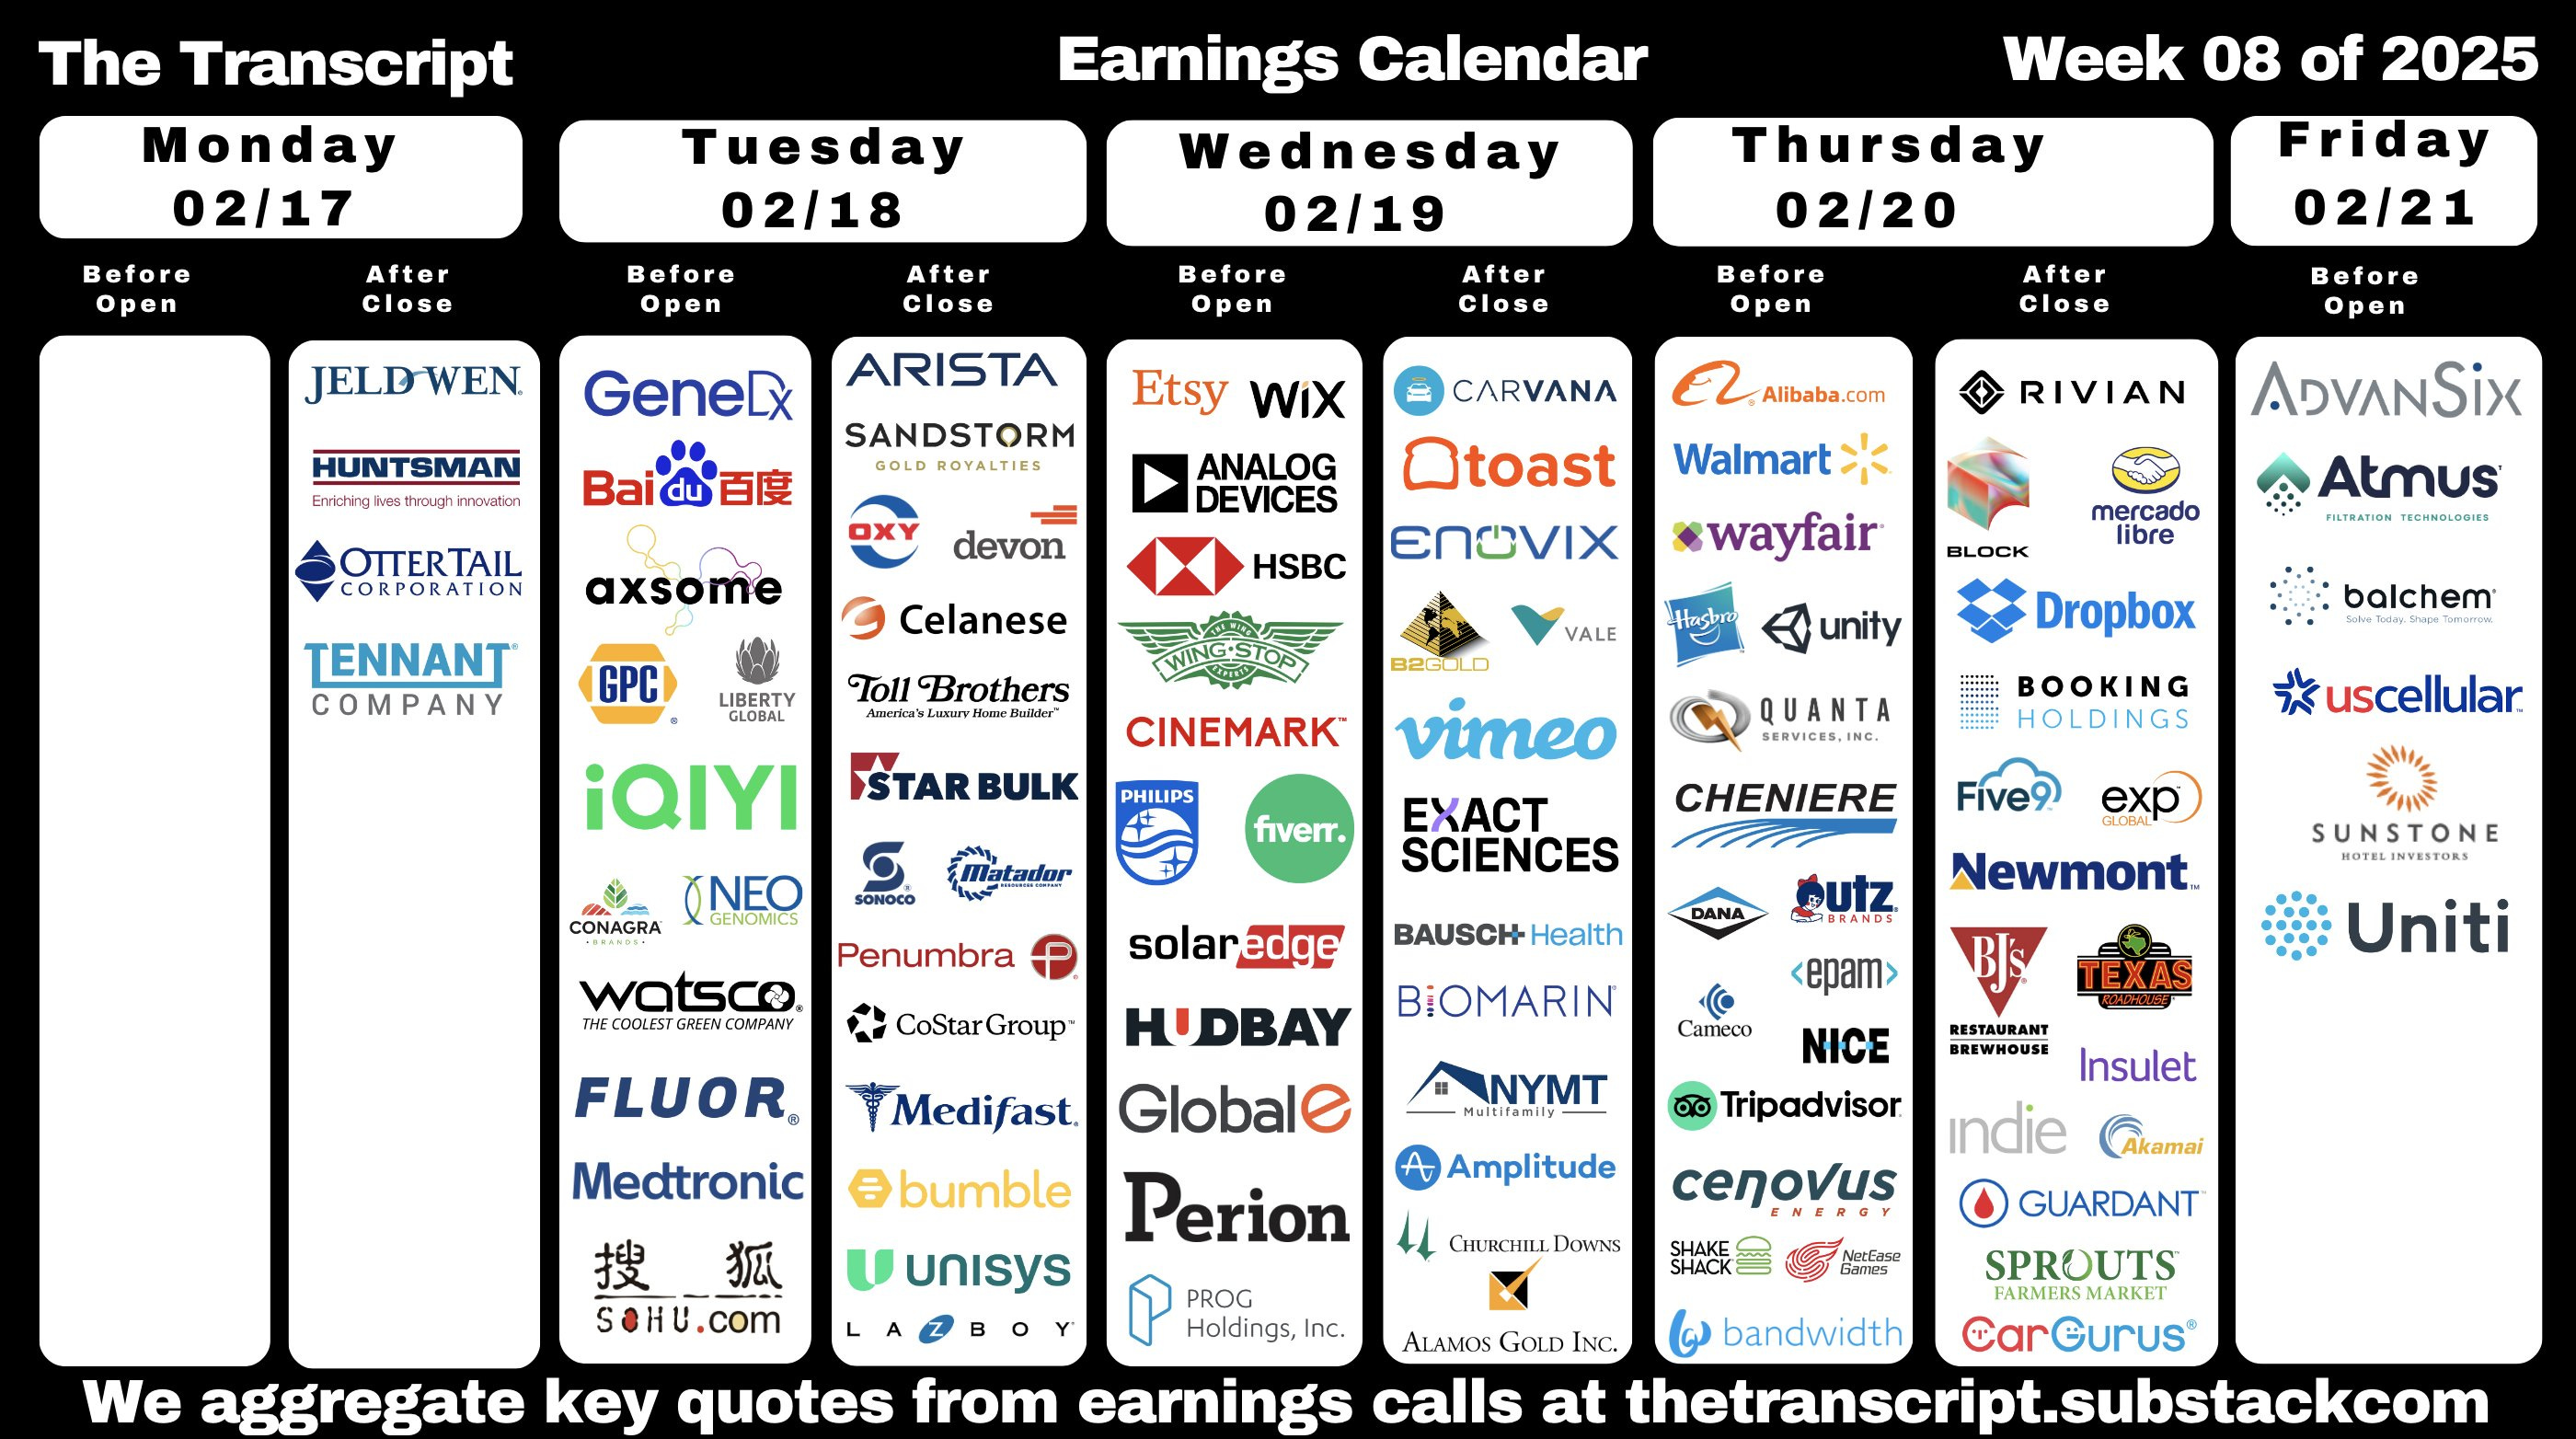
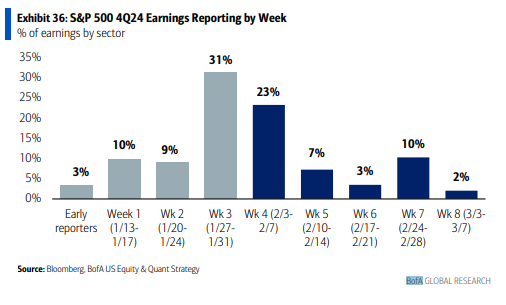
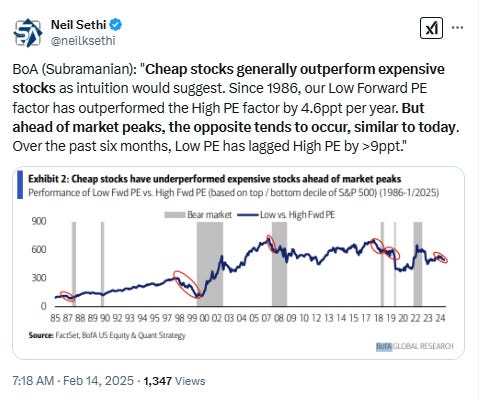
4Q earnings will also continue to decelerate sharply at least in terms of SPX earnings weight with just 3% reporting in the upcoming week (down from 7% last week, 23% the week before that, and 31% the week before that, although note we have Nvidia coming up on the 26th). Still though 46 SPX components reporting (according to Factset) with 1 Dow component and five >$100bn in market cap (down from 19 last week & 31 the week before) in ANET, MDT, ADI, WMT, and BKNG, in addition to a number of others not in the SPX (foreign domiciled) like BABA, BHP, HSBC, Airbus (EADSY), and Schneider Electric (SBGSY).
From Seeking Alpha (links are to their website, see the full earnings calendar):
Earnings spotlight: Monday, February 17 - UFP Industries (UFPI), Noble (NE), and Transocean (RIG).
Earnings spotlight: Tuesday, February 18 - Arista Networks (ANET), Medtronic, Cadence Design Systems (CDNS), Occidental Petroleum, and Vulcan Materials (VMC).
Earnings spotlight: Wednesday, February 19 - HSBC Holdings (HSBC), Analog Devices, Carvana (CVNA), and Garmin (GRMN).
Earnings spotlight: Thursday, February 20 - Walmart, Alibaba Group Holding, Booking Holdings (BKNG), Copart (CPRT), MercadoLibre (MELI), and Southern (SO).

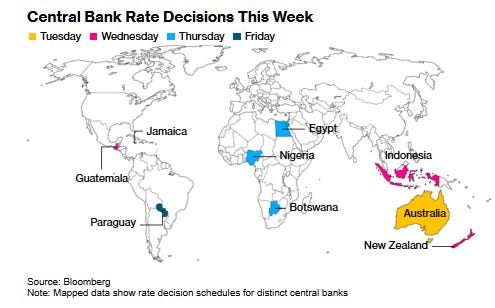
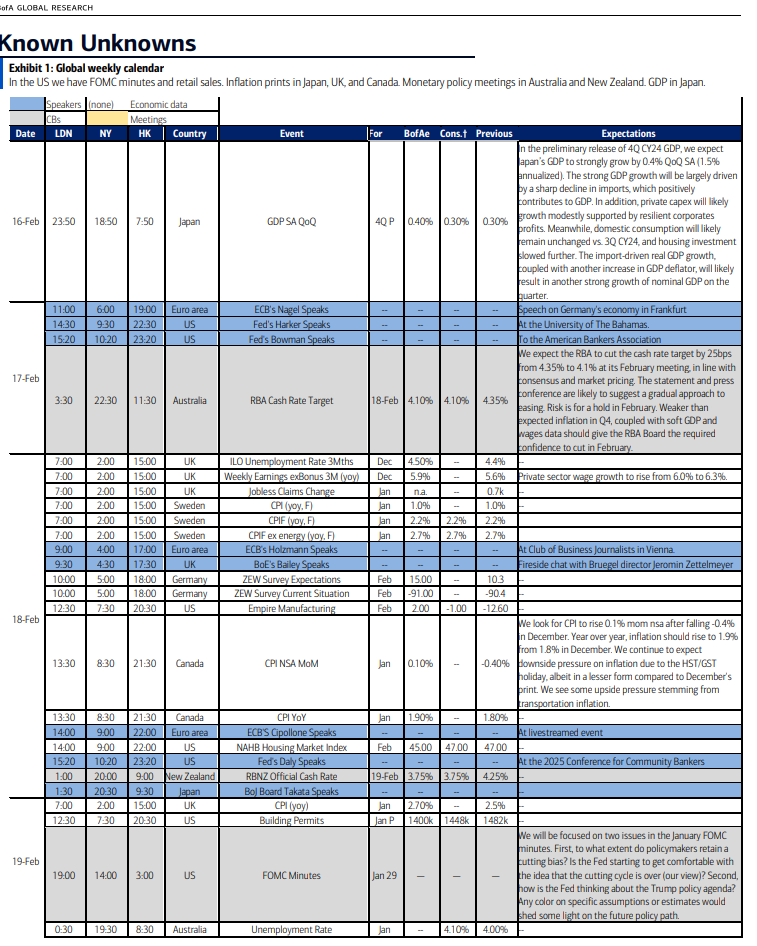
Ex-US, we’ll get global flash PMIs, inflation data from UK, Canada, and Japan among others, policy decisions from Australia (a cut is expected (its first since 2020 although it also did not raise rates as much as most other G-20 countries)), New Zealand (also expecting a cut), Indonesia (hold is expected), plus reports on Japan, Columbia, Mexico, and Brazil GDP as well as trade data from a number of countries including the EU which will indicate the size of their trade surplus with the US.
In Canada, inflation data for January is expected to show the headline rate ticked up to 1.9%, with core measures also accelerating slightly, according to the median estimates in a Bloomberg survey of economists. Momentum in underlying price pressures may boost bets on a pause in the Bank of Canada’s easing cycle, but uncertainty about US President Donald Trump’s tariff threats complicate its next moves. Governor Tiff Macklem will deliver a speech on “trade, structural change and monetary policy,” offering insight into a possible response in the event of a trade war.
In its first meeting of the year, the Reserve Bank of Australia is expected to finally join the global monetary easing campaign with a cut to its cash rate target to 4.1% on Tuesday after core inflation slowed more abruptly than expected in the fourth quarter. Neighboring New Zealand is seen continuing its easing cycle a day later with another 50 basis-point reduction in its benchmark that would take the rate to 3.75%. Bloomberg Economics predicts the RBNZ will signal a lower terminal rate for this cycle. Bank Indonesia is forecast to stand pat on Wednesday, while lenders in China, with a nod from the central bank, are expected to hold the 1-year and 5-year loan prime rates steady on Thursday. Japan’s economic growth may have moderated a tad at the end of 2024 as private demand sagged, while consumer inflation statistics due Friday will likely show prices rising at or above the central bank’s target for a 34th month, keeping rate hikes on the radar. Thailand’s economic growth may have accelerated to 3.4% in the last quarter of 2024. Trade data are due this week from New Zealand, Singapore, Malaysia, Japan, South Korea, India, Thailand and Indonesia, and India and Japan report preliminary purchasing manager index figures for February on Friday.
The EU will report its trade surplus with the US on Monday. Other key reports this week include gauges of confidence from German investors on Tuesday and euro-area consumers on Thursday, and the region’s purchasing manager indexes on Friday. All will illustrate sentiment and activity in the economy while facing that threat from the White House.
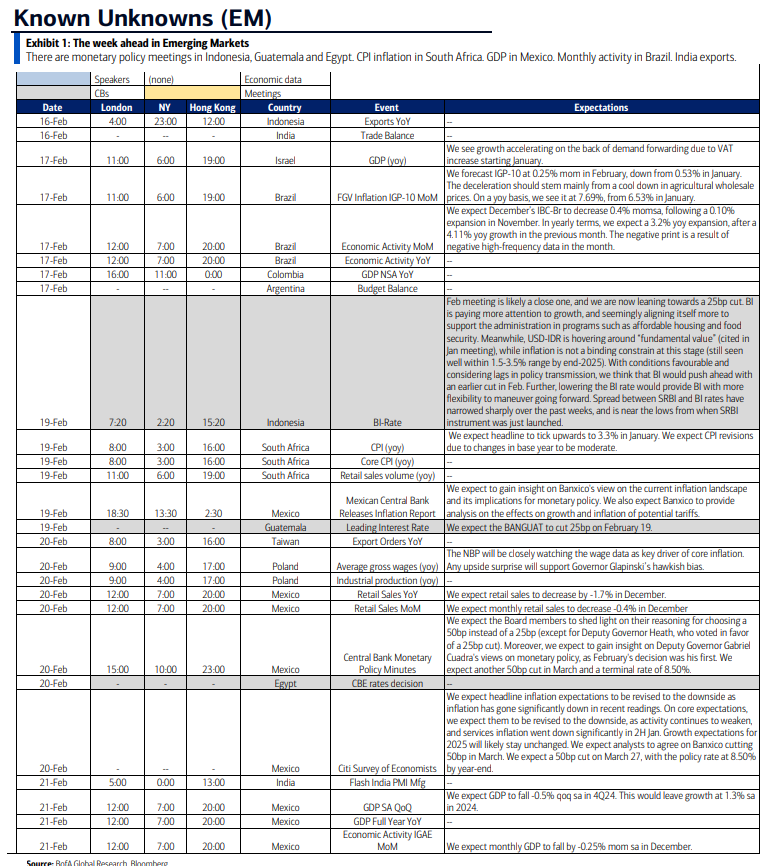
Africa will have three monetary policy decisions:
In Nigeria on Thursday, the central bank is predicted to leave its key rate at 27.5% as annual inflation likely peaked.
Botswana officials are also expected to stand pat, with inflation forecast to inch up as the economy recovers from a prolonged slump in diamond prices. The southern African nation is the world’s biggest producer of rough diamonds by value and the industry generates the bulk of its income.
Egypt’s monetary policymakers are also forecast to keep their rate unchanged at 27.25% as inflation isn’t slowing as fast as expected.
In Latin America, Colombia’s economy likely posted a modest rebound last year from 2023 and most analysts see somewhat faster growth in 2025 on easing financial conditions, an uptick in sentiment and and steady household consumption. The full year, fourth-quarter and December GDP-proxy data are due out Monday. In Brazil, inflation expectations in the central bank’s weekly market survey continue to run roughshod over an aggressive central bank tightening cycle. The 12-month estimate is now at 5.87% after rising for 18 straight weeks. Brazil will also report December GDP-proxy data, likely to betray gathering weakness at the margins as the monthly figure turns negative.
Argentina reports its January budget data along with the trade balance, exports and imports. South America’s No. 2 economy posted its first fiscal surplus in over a decade last year while recording a $18.9 billion trade surplus after 2023’s $6.9 billion deficit. Banxico will publish the minutes of its Feb. 6 decision to double the pace of easing with a half-point cut to 9.5%. The post-decision communique was surprisingly dovish given risk of US tariffs. Mexico also publishes its final fourth-quarter output report, a far more complete reading than the flash print posted last month, which showed that the economy shrank 0.6% from the previous three months. December GDP-proxy data and retail sales figures can be expected to underscore the slowdown.
And here’s BoA’s cheat sheets.
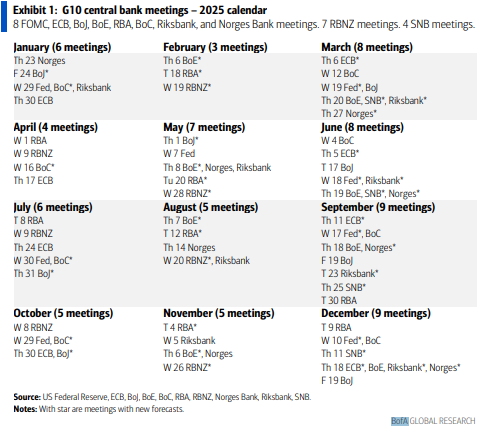
And here’s calendars of 2025 major central bank meetings.
Market Drivers
So let’s go through the list of items that I think are most important to the direction of equity markets:
Fed/Bonds
As noted previously this was one of the sections that had grown unwieldy, so I’ve really pared it down. Given I provide daily updates on Fed expectations, Fedspeak, and analyst thoughts on the Fed, it’s duplicative (and time consuming) to gather it all again so, again, I encourage you to look at those (the daily posts) for updates. I will just give more of a quick summary.
I noted in late December,
Markets have taken 2025 pricing down to less than two cuts with just around a 50/50 chance of a cut in the first half of the year. After 100bps of cuts so far, just a few cuts before a prolonged hold would be consistent with the 90’s “soft landing” experience (where there were 75bps of cuts), and it’s certainly not implausible that inflation gets “stuck” around current levels and growth and labor markets remain in good enough shape that the Fed does have just one or two (or even no) cuts in 2025, but I think it’s also not unlikely that we see continued softening in labor markets and the economy, and with just 18% of investors expecting a recession in 2025, it feels like a growth scare and a quicker path of Fed rate cuts is underpriced.
And since then, we’ve seen pricing ebb and flow along with the data and different appearances by Powell but remain in the one to two cut range. I noted last week,
A hot CPI print will officially take a March cut off the table absent a very unexpected turn in the labor market, although a cool print might not do that much for pricing given recent Fed commentary on wanting to wait until there’s greater clarity on the Trump administration’s policies. There’s also a cohort (Bowman, Logan, Musalem) that don’t think rate cuts are appropriate regardless of what happens with inflation as the strength in the economy demonstrates that rates are not restrictive. So risks are not evenly dispersed in my opinion. All of which means while yields may drift higher or lower I continue to expect they will be range bound this year until we get greater clarity on Trump policies and the first few months of inflation prints. Those will be key in determining whether we get another bout of residual seasonality which has seen 1Q inflation spike the past couple of years. If it doesn’t the y/y numbers will fall quickly, and might be enough to squeeze one or two more cuts out even if growth doesn’t fall back. So, as I wrote the last few weeks, “For the time being, all we can do is wait for now and see how things progress.”
And unfortunately we did see that residual seasonality rear its head in Jan’s CPI report which saw Fed cut expectations quickly wither to the least since after the January NFP (when they fell to no chance of a second 2025 cut), but as noted in the daily updates that was softened by a PPI report which saw very favorable read-through to the core PCE prices, the Fed’s favorite inflation metric, and then we got the much weaker than expected retail sales report which unwound all of the repricing that had followed CPI on Wednesday, leaving us basically where we started the week with around 1.5 cuts priced for the year, which is where as I noted earlier is where I think we’ll stay unless/until we get that “growth” scare (last week’s retail sales report doesn’t count given all of the distortions from tariff front-running, wildfires, and winter storms) or a continued series of hotter than expected inflation prints. There’s not much on the calendar that’s market moving for Fed Futures in the upcoming week, so I would expect I won’t have much more to add a week from now.
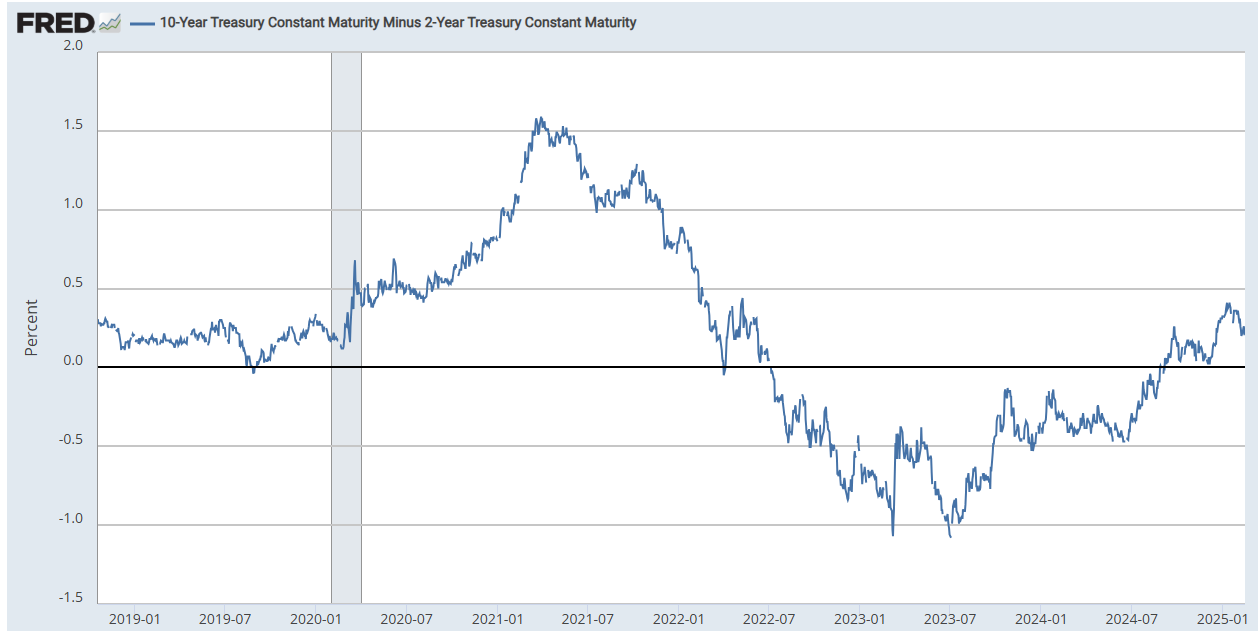
The 2/10 curve remained little changed last week +1bps to +0.21% still down -20bps from Jan 14th when it hit the steepest since May ‘22. It started the year at +0.33%, so it is down -12bps from there.
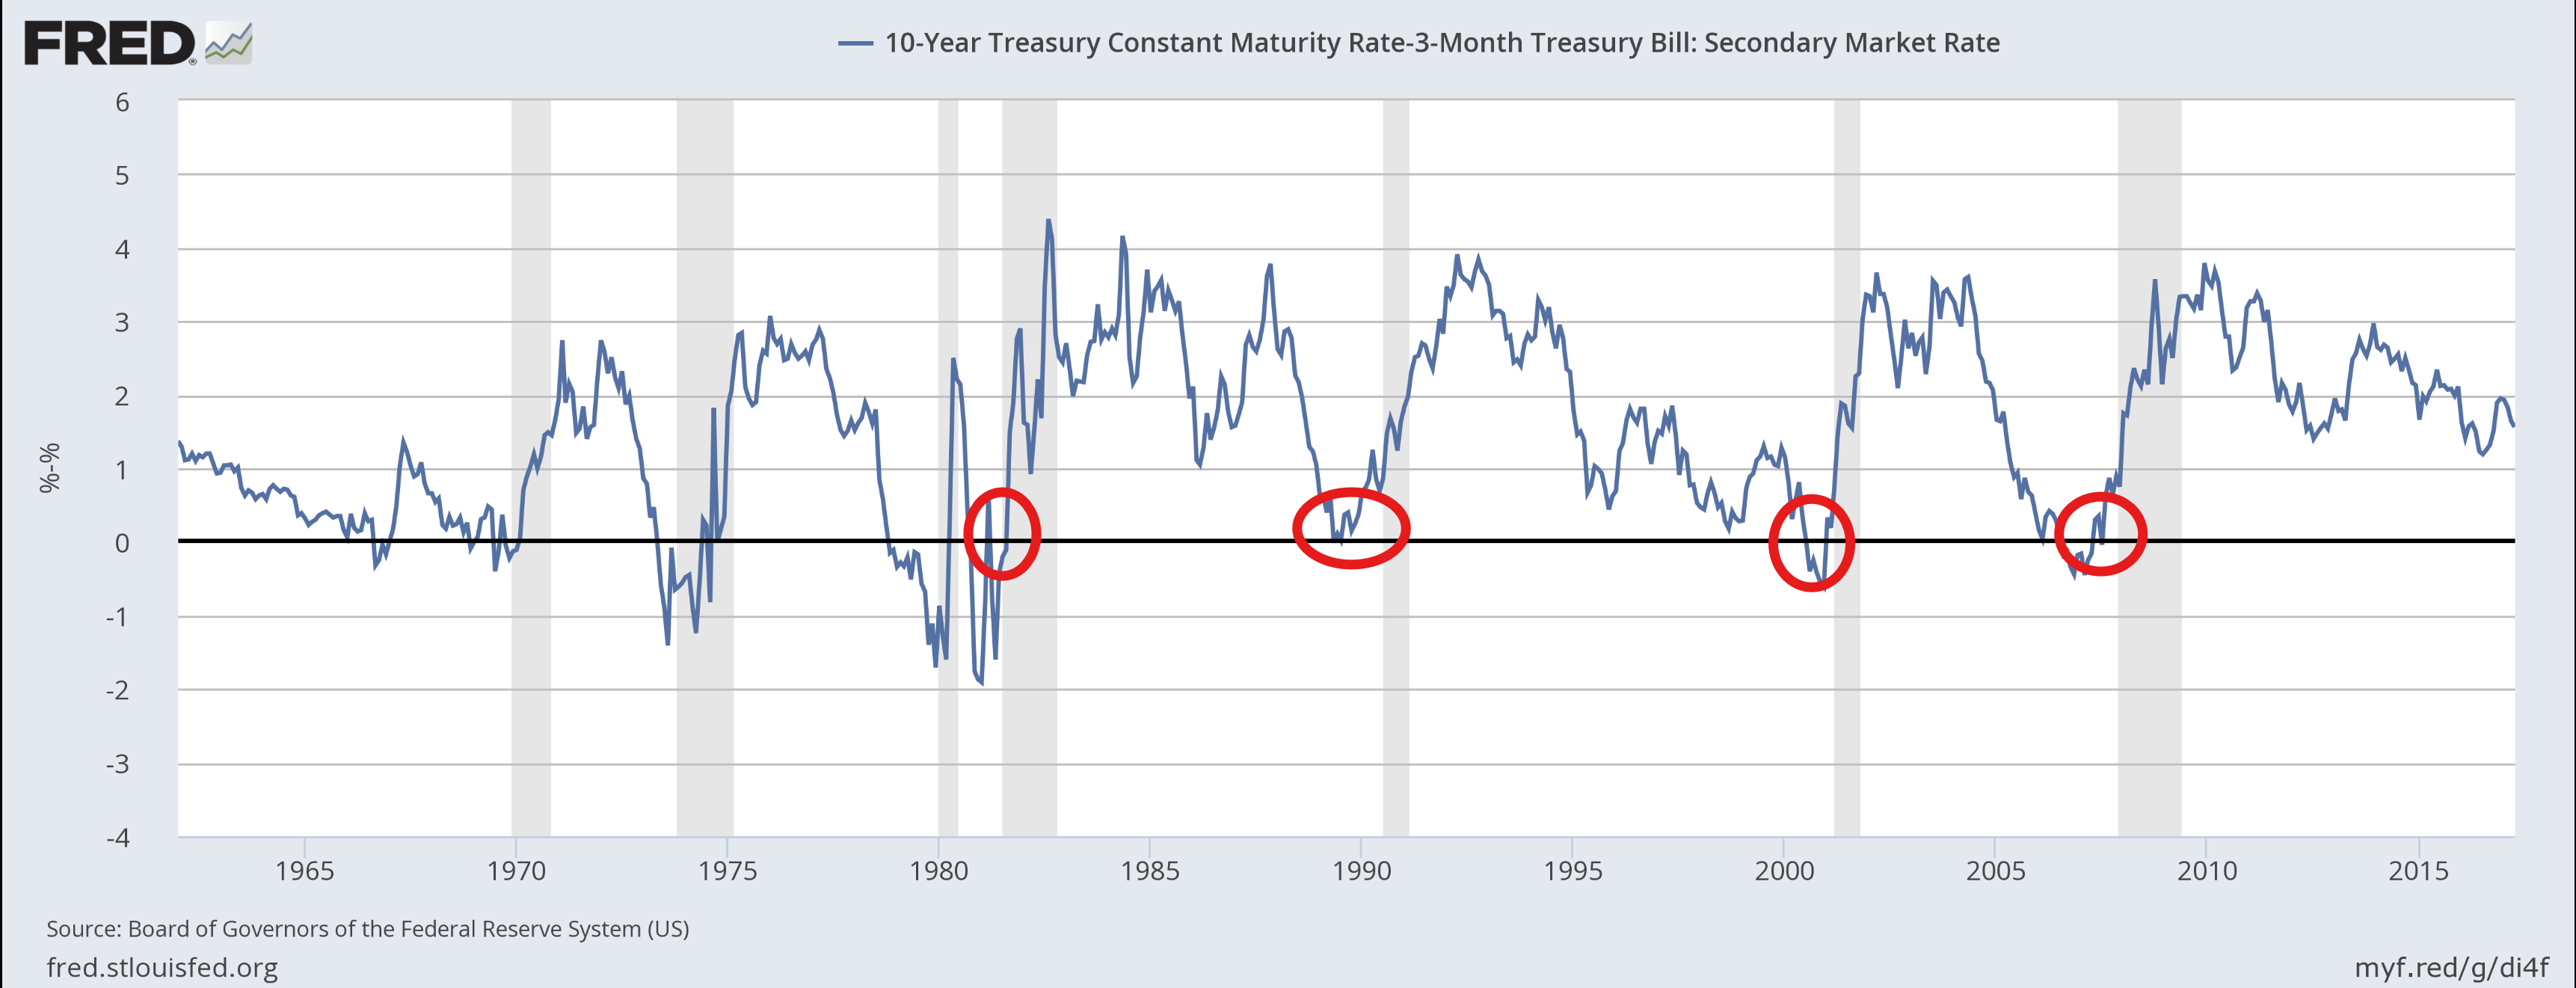
As a reminder, historically when the 2/10 curve uninverts following a long period of inversion the economy is either in a recession or within a few months of one. It uninverted in Sept, so this looks officially like a "this time is different" situation.
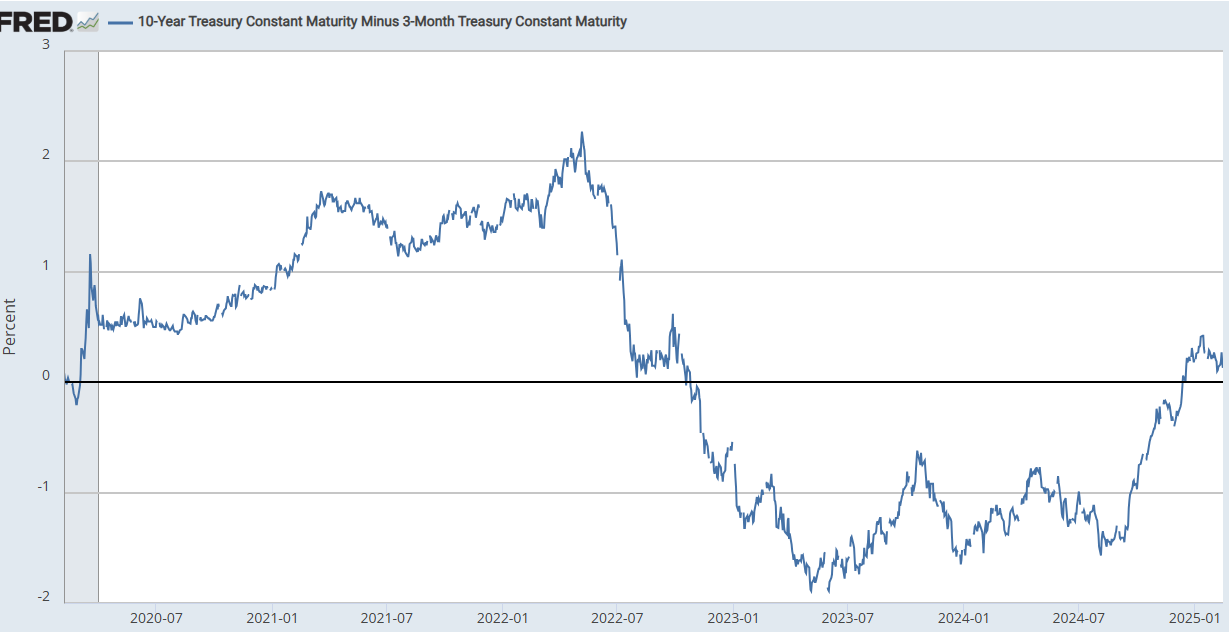
The 3mos/10yr yield curve (considered a better recession signal than 2/10’s w/the last four recessions on average coming a few months after the curve uninverted (prior to that it generally uninverted after a recession had already started)) also little changed w/w -1bps to +0.13% now down -29bps from the steepest since Oct ‘22 hit Jan 14th (but still up +1.58% since Sept 11th). It uninverted Dec 12th, so the clock is ticking on this being a useful recession indicator.
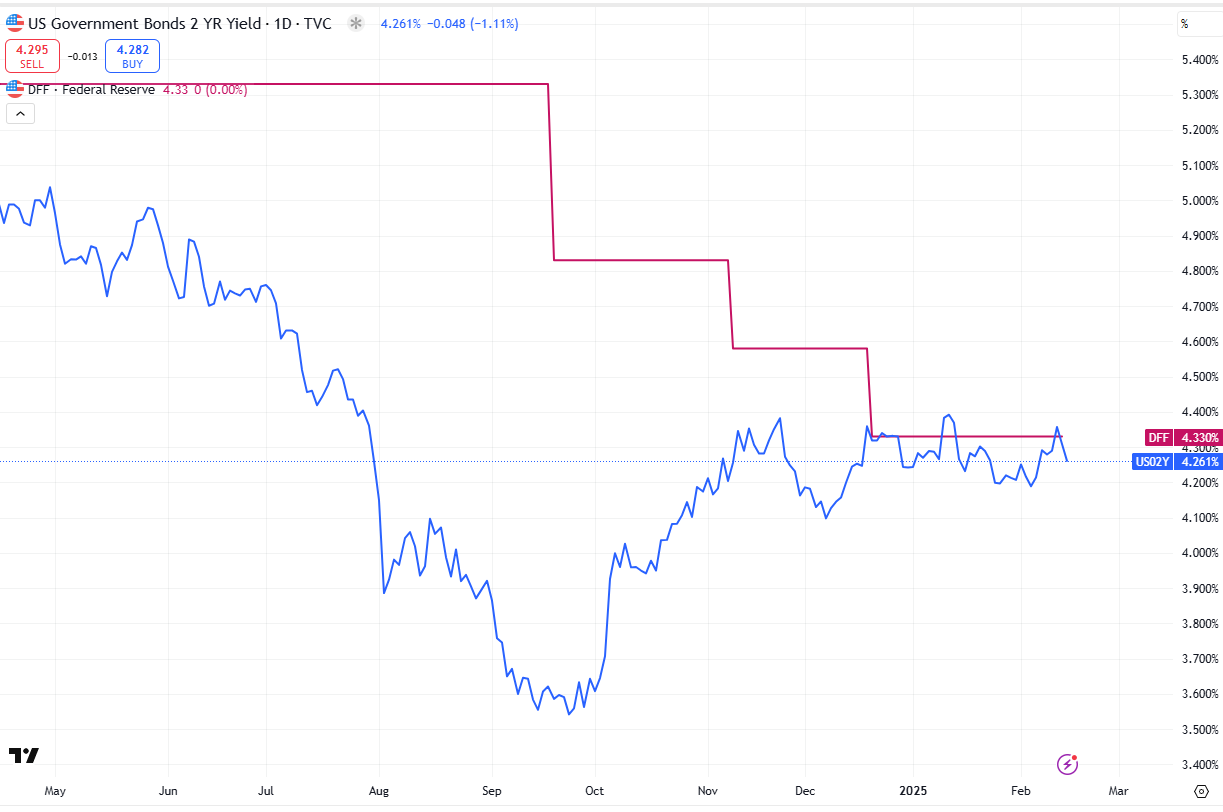
I have been a broken record that I thought the 2yr #UST yield was too high, trading above the current Fed Funds effective rate (meaning the 2yr was pricing a higher chance for net rate hikes than cuts over the next 2 years). Since then it has softened so that it’s now below, but at -7bps (-5bps w/w), not by much, so I think there’s probably more to go unless the Fed is truly done with rate cuts for this cycle.
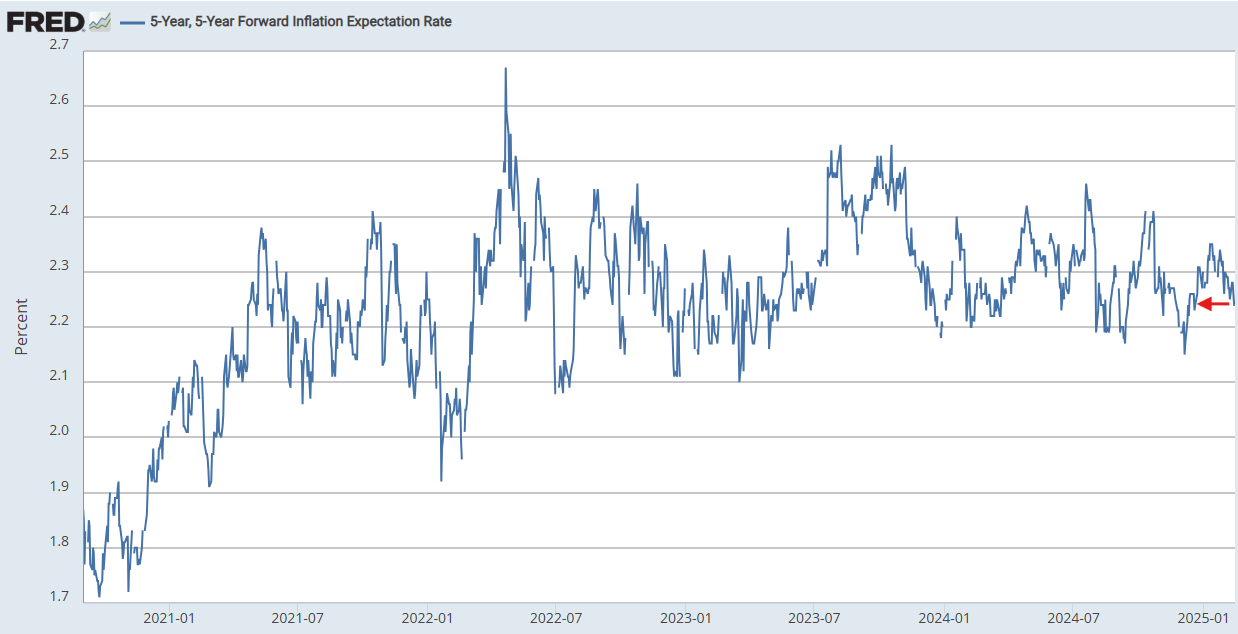
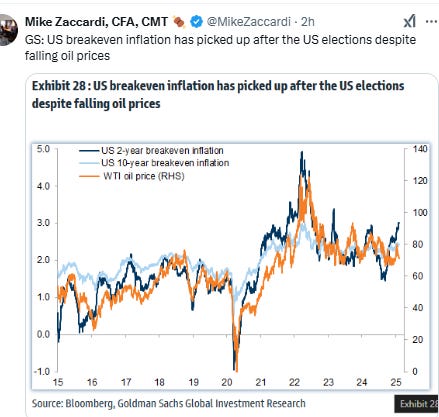
Long term inflation expectations as measured by the 5-yr, 5-yr forward rate (exp'd inflation starting in 5 yrs over the following 5 yrs), specifically mentioned by Powell at the Nov FOMC press conference (he said the metric was “right where it’s been, consistent with 2% PCE inflation”), edged lower this week, -1bps w/w to 2.24%, the least since Dec 20th. They are now -5bps since the Nov FOMC.
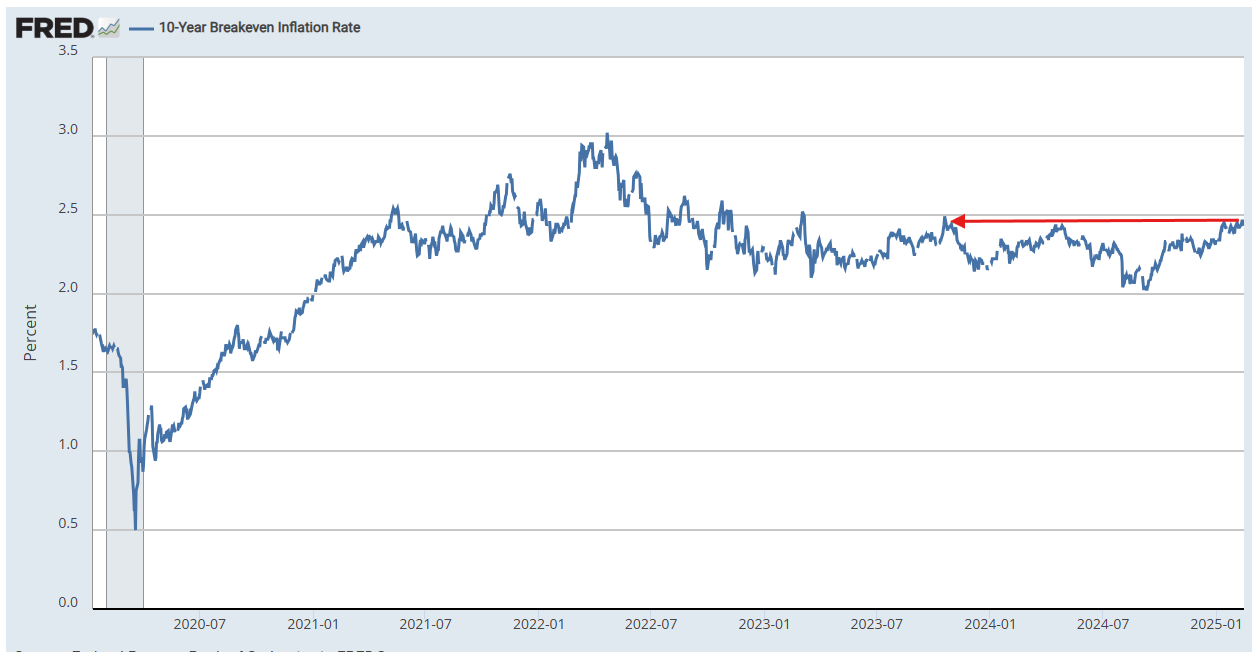
10-yr breakevens though hit 2.44% on Tuesday, the highest since Oct ‘23 before softening a touch following retail sales on Friday.
Note this data is through Thursday, so doesn’t reflect the action on Friday, which saw real yields drop:
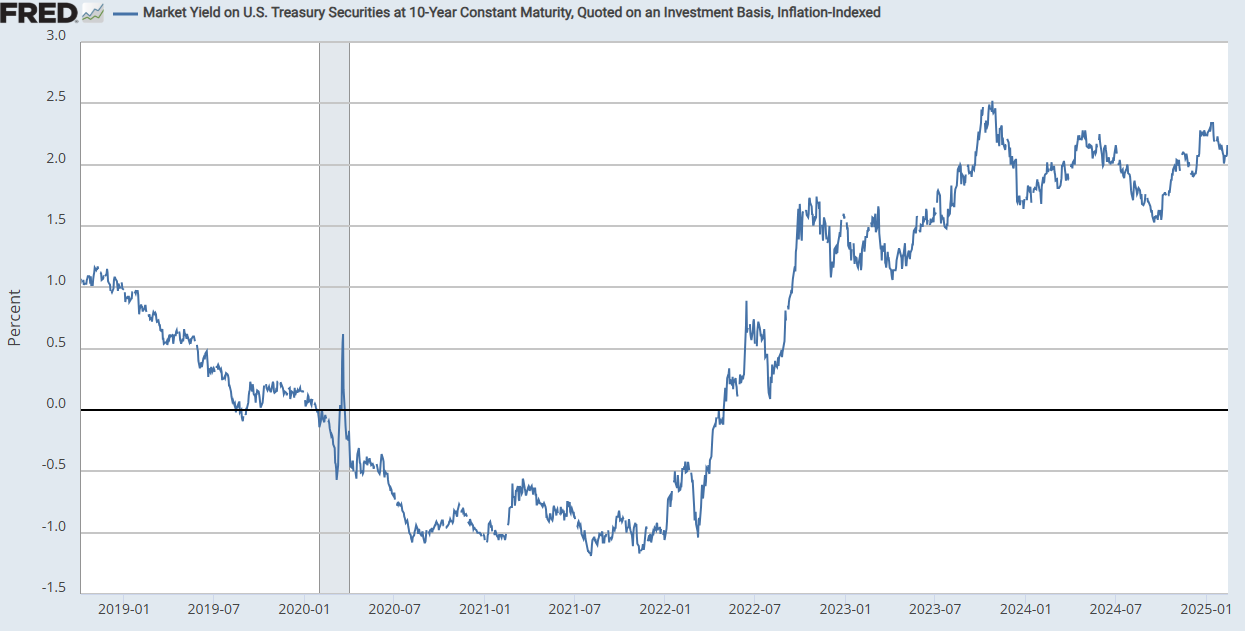
With nominal 10yr Treasury yields falling a little less than inflation expectations last week, 10yr real rates, edged up 4bps to +2.08%, still though down -26bps from the +2.34% on Jan 13th which was the highest since Oct ‘23 (and before that 2007), though still well above the 2010-2020 peak of 1% (but down from the post-pandemic peak Oct ‘23 of 2.5%).
Note this data is through Thursday, so doesn’t reflect the action on Friday, which saw real yields drop:
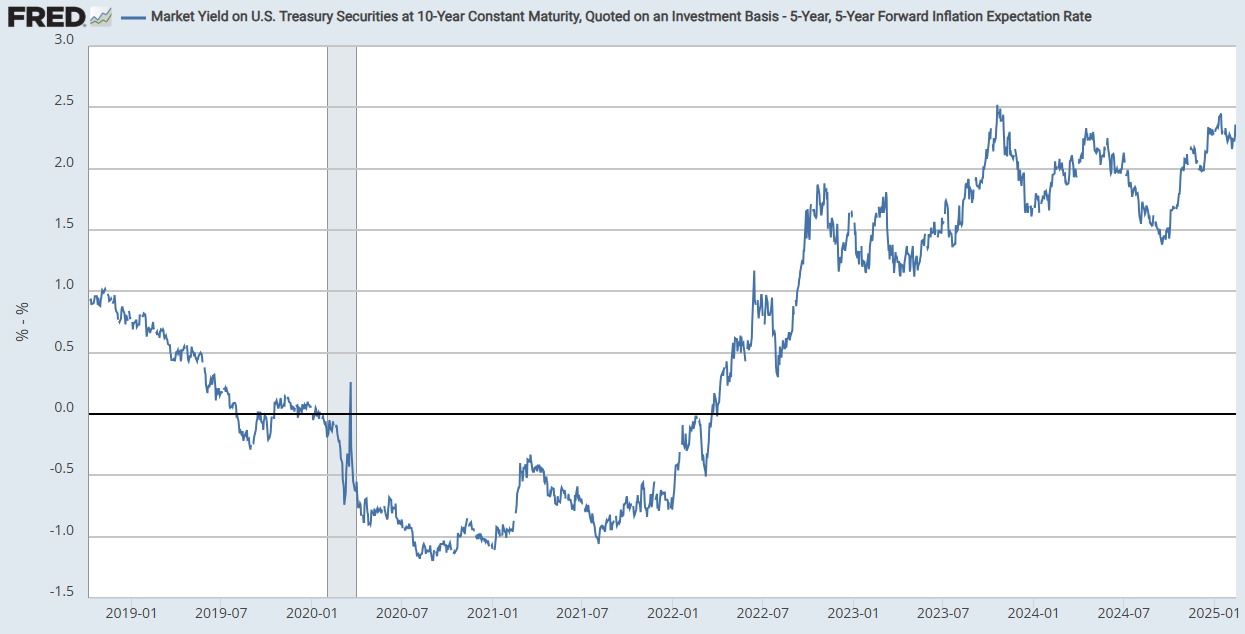
10yr real rates using 5-yr, 5-yr forward inflation expectations (subtracted from the 10yr nominal yield) similarly fell back again this week -8bps to 2.18% as of Thursday now down -27bps from 2.45% on Jan 13th which was the highest since Oct ‘23 (and before that 2007)), still though well above the 2013-2020 average of around 0.5% (but down slightly from the post-pandemic peak of 2.5% in October '23).
And as a reminder according to BoA the importance of real rates on equity returns has seen the largest increase in the factors they track over the past 5 yrs and explains a larger proportion of stock returns (83% correlation) in their data (to 2006), with the dollar close behind the most correlated (76%) since 2015.
Shorter-term real yields (Fed Funds - core PCE) now down to 1.68%, the least since Sep ‘23. While still the highest since 2007 before that, it’s down from 2.70% in June. (this won’t get updated until the end of the month)
And the real prime rate (using core PCE) continues to edge lower from the 5.9% in June, which was the highest since Sep 2007. Now down -1% at 4.9%, the least since Aug ‘23, still though more than double the 10yr pre-pandemic avg. (this won’t get updated until the end of the month)
And looking out longer term, one thing to note is the FOMC’s long run projection for the endpoint of the Fed Funds rate (the “neutral rate”) is now the highest since Sep 2018 at 3.0% (and not unlikely to go higher as I said earlier this yr). [This won’t get updated again until March].
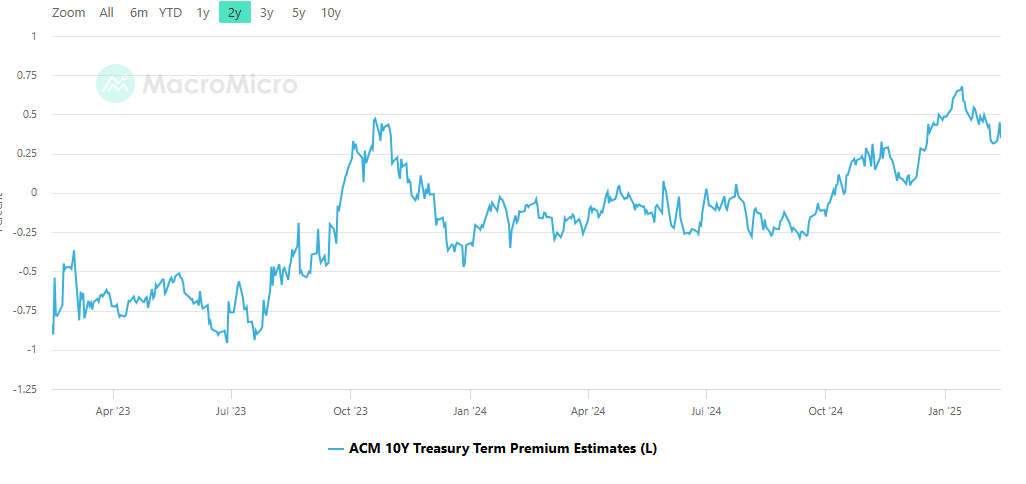
The ACM model of the 10yr term premium (which is solely based on interest rates) was little changed w/w but the model is through Thursday so it likely fell on Friday to below the +0.34% last week, remaining well off the +0.66% it hit Jan 13th (which was the highest on this model since May 2015), still though the highest since 2023 prior to December, up ~+48bps since the FOMC did the 50bps cut in Sept, but as noted down -32bps in less than a month.
https://en.macromicro.me/charts/45452/us-10-treasury-term-premium
FWIW the the St. Louis Fed 10yr term premium estimate (which runs a week behind and is based off the Kim and Wright (2005) model (which differs from other models in that it incorporates non-yield curve factors such as inflation & GDP) continues to show a higher term premium than the ACM model at +0.64% as of Feb 7th but down from +0.80% Jan 10th which was the highest since Apr 2011. It is up +62bps since the Sept FOMC.
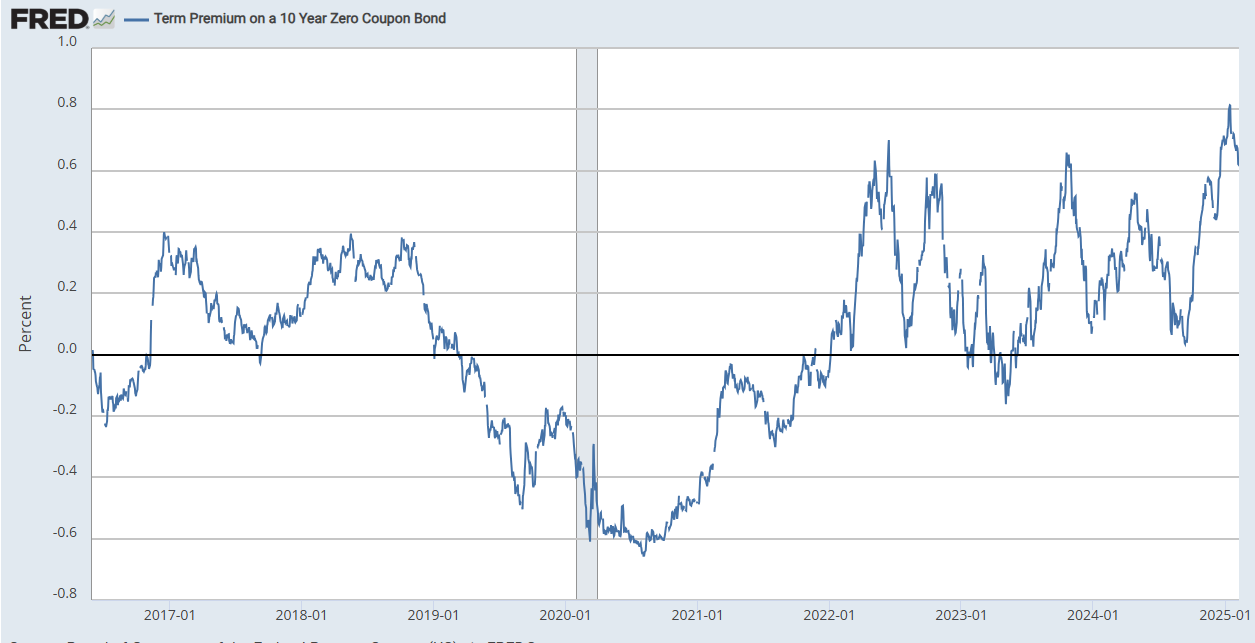
The extended discussion on term premium (what it is, why it’s important, etc.), can be found in this section in the Feb 4th Week Ahead.
As the MOVE index of expected 30-day bond volatility fell to the lows of the year, not far from the lows of 2024 hit in December (which were the lowest since 2022).
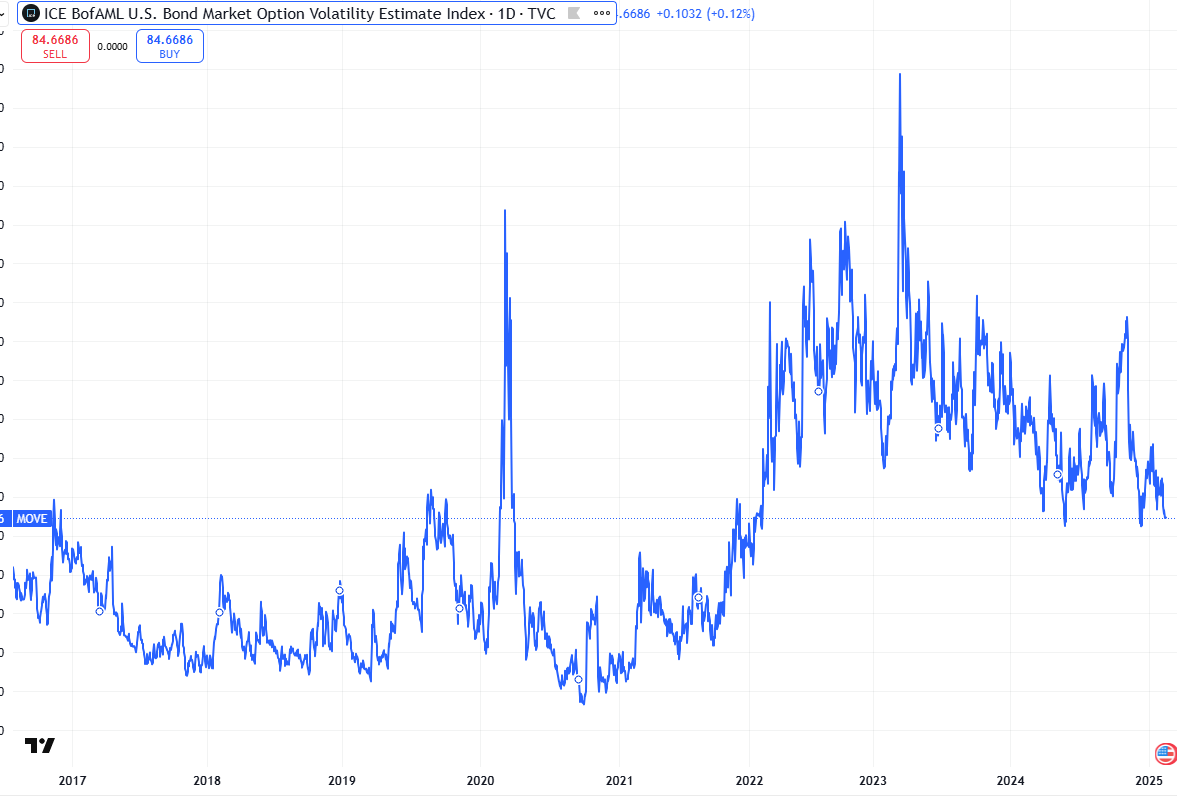
With bond volatility falling (at least according to the MOVE index), 30yr mortgage spreads fell as well -5bps w/w to 2.34%, remaining near the lowest since June ‘22 (2.27%) hit Dec 19th and well off the 3.1% peak in June ‘23. But they are around +62 bps above the 2010-2020 avg level.
Lower spreads (compared to mid-2023) is what has kept 30yr mortgage rates from moving much over 7% like they did in Oct ‘23 (when they peaked at 7.8% according to Freddie Mac), so hopefully they will remain contained.

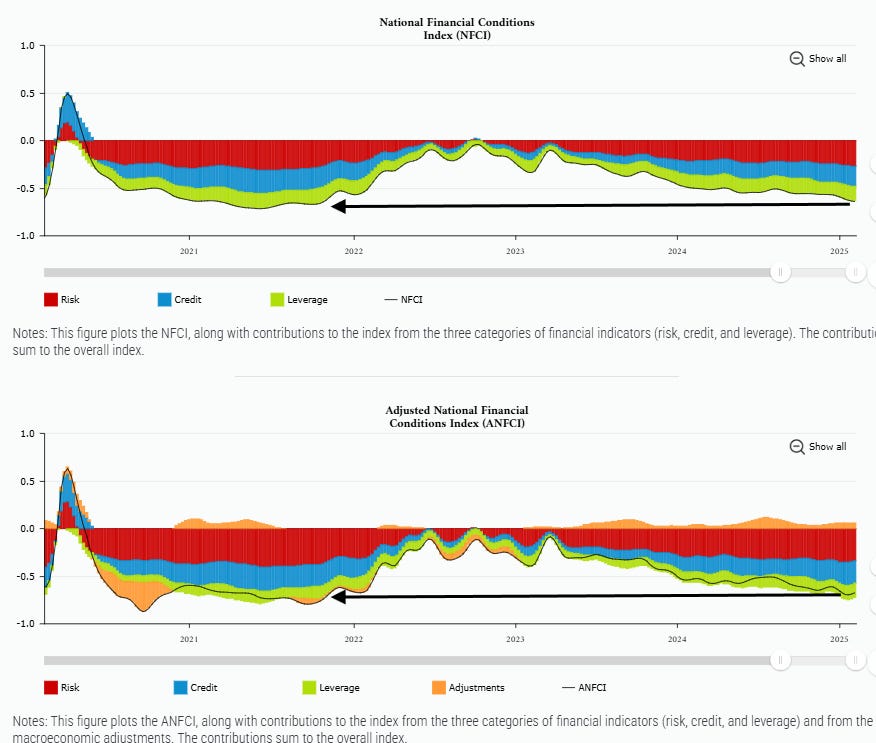
Chicago Fed National Financial Conditions Index and its adjusted counterpart (the latter attempts to remove the correlation between the various indicators due to broad changes in economic conditions), both of which are very comprehensive each w/105 indicators, in the week through Feb 7th saw the former remain unchanged at the least tight since Nov 2021 while the latter tightened for a second week but remained a tenth off the least tight since then as well.
https://www.chicagofed.org/research/data/nfci/current-data
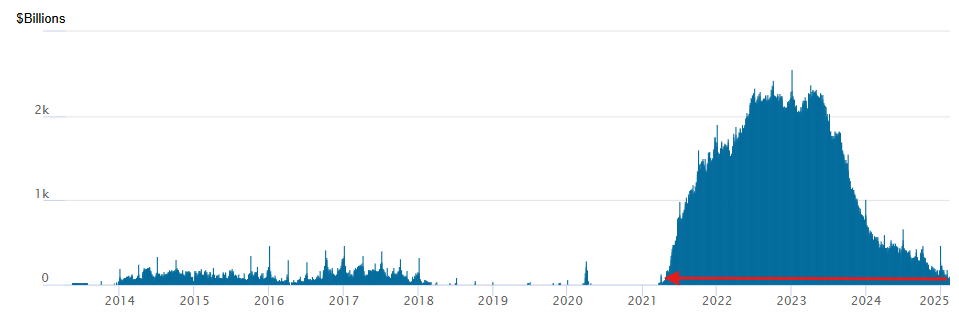
As the Fed continues to drain liquidity from the system via QT, I think it’s important to watch for stresses which give an early warning signal that they are perhaps going to far as they did in 2018 which led to a near bear market. One area I am monitoring is reverse repos (which is an overnight secured place institutions (mostly money markets and banks) can park excess funds to accrue some interest designed by the Fed originally to keep excess liquidity from pulling down rates too much in other short term markets). RRP grew rapidly in 2021 & 2022 as money was pumped into the system but since May ‘23 has been steadily drained down by the Fed’s QT program and higher bond issuance with banks discouraged by regulatory rules from taking up the increased Treasury supply.
In particular, the continued sizeable issuance of T-bills (<1 yr duration) of around $800bn/month (accentuated by the $60bn in balance sheet runoff (meaning the Fed has reduced its buying of maturing Treasuries by that amount which the private market has to fill)) drained ~$1.75 trillion from RRP in the year through March 1st. From then until early July RRP levels had remained relatively stable in the $375-$500bn range, but since early July they resumed their decline (in fits and starts), hitting new lows on Dec 20th at $98bn, the least since Apr ‘21 on the back of the Fed cutting RRP rates to the low end of the Fed Funds band which made parking funds there (versus lending overnight to other institutions or buying T-Bills) less attractive in line with their desire to sop up most of this “excess liquidity” (as they have described it).
RRP on Friday hit the lowest since Apr ‘21 at just $59bn, down notably from $95bn the prior week.
So for now, I’m not changing my overall take from December which is that “I expect this to continue its decline given the Fed has made parking funds in RRP less favorable (or at least until the Treasury hits the debt limit and can no longer issue new bonds (just refinance maturing ones)).” I continue to think we may start to see funding stresses emerge as it approaches zero.
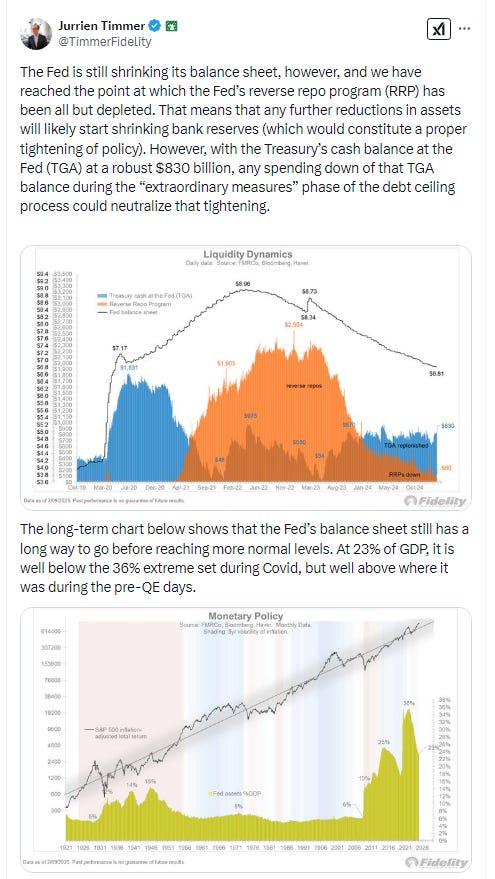
In that regard, as noted previously, despite the drawdown in RRP Dallas Fed Pres Laurie Logan (who is an important voice given her extensive experience in the NY Fed's markets group) has said she believes current liquidity is “more than ample” (and the current NY Fed Pres Williams said something similar last year) and said she's looking for RRP to fall to "negligible" levels. As I said then “she's the expert so I'll defer to her, but I continue to be on the lookout for funding stresses now that RRP has crossed below $100bn, and I still think at zero RRP the Fed may need to stop QT to avoid another liquidity shortage as they did in late 2018.”
Also, we’ll have to see how the debt ceiling impacts things. With the Treasury likely to soon start drawing down its General Account (TGA) (Janet Yellen said last week that “extraordinary measures” would start in January), until the debt ceiling is raised the likely consequence is a build in RRP as money markets, etc., need another home for their short-term lending (the Treasury will only be able to roll over expiring debt, not issue new debt to keep up with spending). This was what BoA predicted back in Sept (more below). Their analysis has been pretty accurate (they saw RRP falling to $185bn by YE (about where it is now).
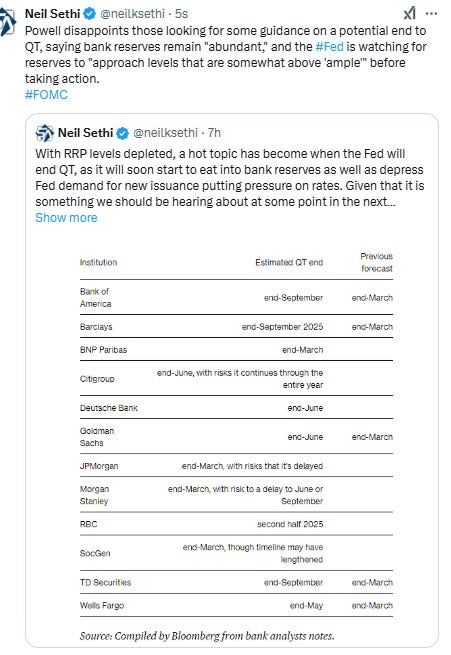
And I noted previously that BoA had pushed pushing back their est for the end of QT to Mar ‘25 (which the noted “could create a funding blind spot for the Fed” in the event the debt limit remains unresolved (you can follow this link and look in this section for more details on that). In summary their thinking was that, similar to 2023, the Treasury’s depletion of its General Account (TGA) when it cannot issue new debt (just refinance existing debt) will offset what would otherwise be a continued drawdown of liquidity. That will keep liquidity stable but will rapidly reverse once the debt limit is ultimately raised (which BoA est’s will again be in July as they assume Congress will take it to the very last second as is their habit), which could lead to a funding squeeze when auctions restart they will need to be resized to “catch up”. That didn’t really cause any issues when it happened May 2023 (the last late debt ceiling extension), but we also had a lot more liquidity in the system (RRP levels were at record highs above $2tn (arrow) but they fell sharply from there, down around -$1.7tn over the next 10 months). We have nothing like that amount of “free liquidity” this time around.
In January BoA pushed the end of QT out again to Sep ‘25 due to “(1) limited volatility in funding markets (2) minimal discussion around balance sheet policy in recent Fed communications, [and] (3) lack of concern around debt limit related dynamics.” Similar to the above discussion, they “think the timing of QT end largely depends on the timing of debt limit resolution and the speed / size of TGA rebuild… We see a summer deal ahead of the August X-date as our base case… Using debt limit assumption of an end-July DL resolution, we assume a QT end date in Sept 2025. It is possible QT ends in July prior to TGA rebuild… We expect the debt limit resolution to trigger a rapid rebuild of the TGA via bill issuance, which will quickly drain ON RRP and eventually reserve balances.”
In terms of their specific forecasts they think once the debt limit is raised we’ll see “$468b in bills issued and $470b in TGA rebuild liquidity drain, over 6x the pace of monthly QT in only 2 months. At this point funding pressure and volatility in funding rates will likely lead the Fed to end QT. The pace and magnitude of the TGA rebuild will be important for funding markets. A slow TGA rebuild & lower terminal TGA value will mean a more gradual liquidity drain and more limited funding pressures. A faster rebuild & higher TGA value will mean more acute funding pressure post debt limit resolution.”
They think that “most of the TGA rebuild will initially pull cash out of ON RRP [which they think will have rebuilt to $350bn] since TGA rebuild will likely see higher bill supply at cheaper front-end rates. Cheaper bill rates will draw MMFs cash out of RRP. Once the RRP reaches $0 the remaining drain will come out of reserves. Once QT ends for USTs, we expect the Fed to continue to roll off prepaid and maturing MBS but reinvest MBS into UST bills”.
BoA FWIW believes “the Fed should have ended QT by end ’24 to prevent an unintended over-draining of sysstem liquidity. We believe a Fed that continues QT into Q3 will see money market volatility + potential bank liquidity concern as TGA is rebuilt. The Fed’s justification for continued QT seems to be a belief that (1) banks demand fewer reserves than we expect ($3-3.25tn) (2) their liquidity adding repo tools are sufficient to keep money market pressures contained. We are skeptical on both. Longer QT risks over-draining & cheaper front-end USTs in Q3 ’25.”
So, in summary, until the debt ceiling is raised, BoA sees liquidity stresses being forestalled, but once it is they think we will quickly see RRP drain to zero necessitating an end to QT.

The reason monitoring RRP is important is that once it’s gone, it’s expected to begin to pressure bank reserves (absent some other buyer shall as stablecoins which have been a buyer of T-Bills) to absorb any extra debt issuance, etc., that is not sold to foreign and domestic buyers, and we’re rapidly approaching that point. However, banks have been loathe to part with reserves beyond the $3tn level. For now, at least, they remain comfortably above that (Jerome Powell noted two weeks ago that the Fed is watching for reserves to "approach levels that are somewhat above ample," meaning they see them as more than sufficient at current levels) of $3.26bn, up +$30bn w/w.
I’ve noted previously that it seems that as long as reserves remain above the $3tn level (which is where we saw indigestion in the credit markets in March ‘23 (which contributed to the banking issues (SVB, etc.)), it seems they indicate more than sufficient liquidity in the system.
Overall, bank reserves are just -$110bn below June 1, 2022 levels ($3.36tn), when the Fed started QT, a better result than even the most optimistic estimates at the time.
For background on various estimates of when reserves will be “too low” see the Feb 4th Week Ahead.
Getting back to rates, I said 10 months ago 2-year Treasuries were a good buy at 5%, and as I noted once the Fed started its cutting cycle the ship has likely sailed on seeing those yields anytime soon (meaning years). In terms of 10-yr’s I had advised then grabbing some at 4.7% which I had thought seemed like something we wouldn’t see anytime soon, but as I noted seven weeks ago with the Fed saying the ‘recalibration phase has ended’ along with concerns about sticky inflation cropping back up and now questions about the inflationary impact of some of Donald Trump’s policies, if inflation concerns resurface, we could get back there. And those did in fact occur, and I think we were well on our way until a more constructive Powell and comments from Treas Sec Bessent about his focus on keeping the 10yr yield low and sticking to the auction schedule set up by Sec Yellen, has kept yields from running higher, likely confirming that we’re in a trading range between 4.1 and 4.8% on the 10yr for now. As noted previously, the 2yr will likely not see a lot of movement unless we get some big movement in Fed rate cut (hike?) expectations.
But in terms of much lower yields, as I said four months ago, we have probably seen the lows until we get a recession:
“while we didn’t quite see 3.5%, I think 3.6% is close enough, and I think we might have been at or near the lows at this point, particularly as the Fed has been raising their neutral rate estimate. If the endpoint for Fed Funds is around 3% (or higher) then it’s hard to see the 10yr trading much lower absent a recession. Similarly 2yrs at 3.6% seem to be very rich and almost certainly too low absent a recession consistent with my statement last week.” In short I’d expect to see 4% on these before we see 3.2%:
At around 3.6% on both the 2 & 10yrs absent a recession I think there’s not much value in either (I’d rather park my cash in short term Treasuries (0-3mths) or safe dividend paying stocks with a track record of growth (dividend aristocrats, etc.) at these levels.
For all the old “final hike” and “first cut” materials, you can reference the Feb 4th blog post.
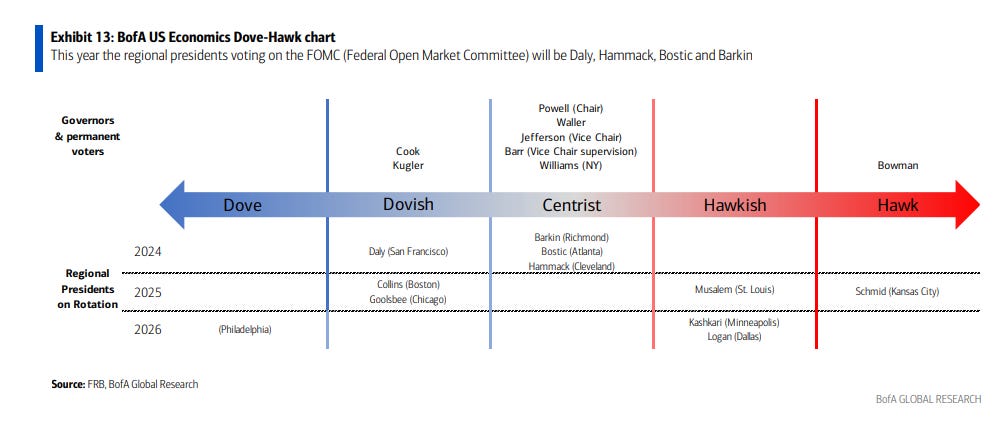
BoA updated their FOMC Dove-Hawk Chart. Note it’s missing Hammack in ‘26 (Cleveland and Chicago vote every 2 yrs), but otherwise looks right. Also note that Philadelphia Fed Pres' Harker’s term is up next year (which is why they don’t have a name for Philadelphia), something I didn't realize.
I think this now needs some dramatic changes with Hammack (who dissented voting for no cut in Dec) clearly one of the most hawkish members, Daly at best a Centrist as she sees only 2 cuts in 2025, and perhaps Collins as well. Goolsbee is clearly the most dovish of the members currently.
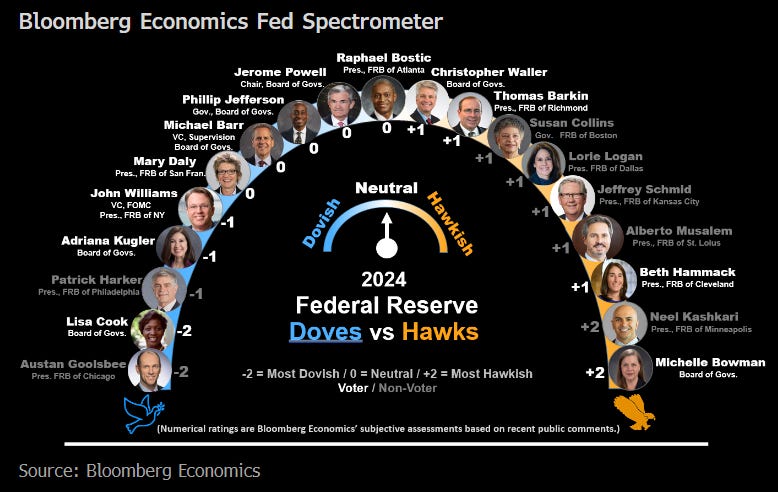
And I came across one from BBG. I think it’s pretty accurate except Kashkari is definitely not that hawkish (he was calling for a December cut in early November):
And here who is rotating off and on for 2025.
Earnings
As a reminder, I have removed most of the background material, which you can get in the Feb 4th blog post. As you know I’ve moved on to 4Q and beyond. You can reference this post from 12/1/24 for stats on 3Q.
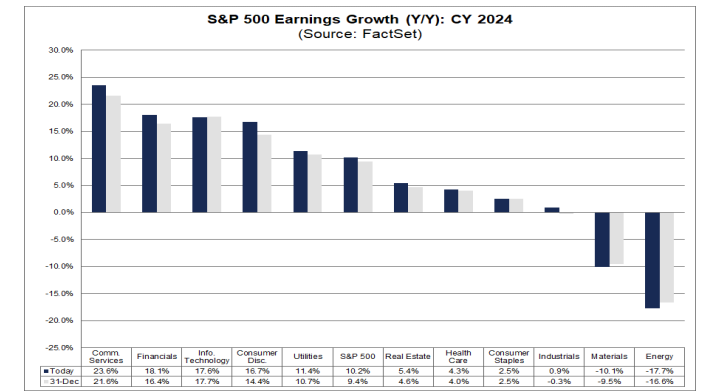
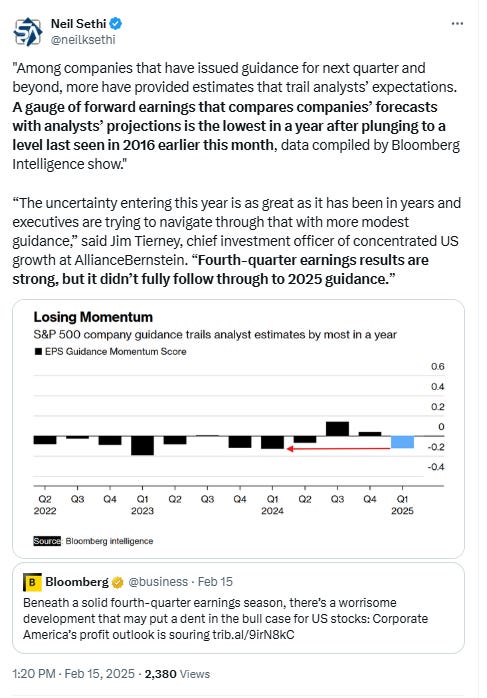
With 77% of SPX earnings in for Q4, Factset says 76% have beaten exp's (-1% w/w), below the 5-yr avg of 77% but above the 10-yr avg of 75%, and those beats edged down to +7.3% above exp’s (from +7.5% the prior week but +5.0% the week before that) below the 5-yr avg of +8.5% but above the 10-yr avg of +6.7%. Despite the lower beat amount, earnings estimates continue to push higher up another +0.5% w/w to +16.9% (up +5.2% the past five weeks), and up from +11.8% at the end of the 4th quarter. This would be the most growth in three years and would mark the 6th consec quarter of earnings growth.
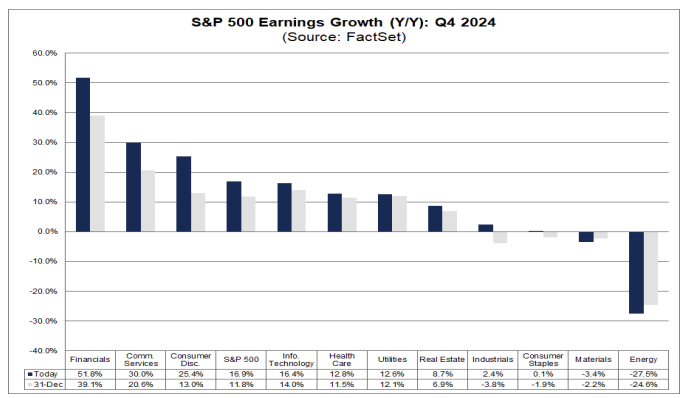
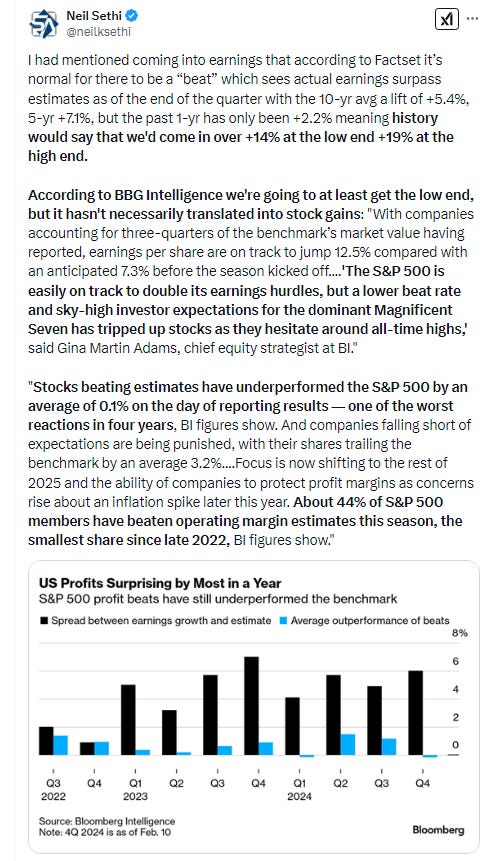
As we’re seeing, it’s normal for there to be a “beat” which sees actual earnings surpass estimates as of the end of the quarter (only 3 times in the past 40 quarters has that not happened (Q1 ‘20, Q3 ‘22, Q4 ‘22) according to Factset. The estimate at the start of the quarter was +11.9%. The 10-yr avg has seen a lift of +5.4%, 5-yr is better at +7.1%, but the past 1-yr has only been +2.2%. It seems at this point we’re going to clear we’re going to beat the lower bar.
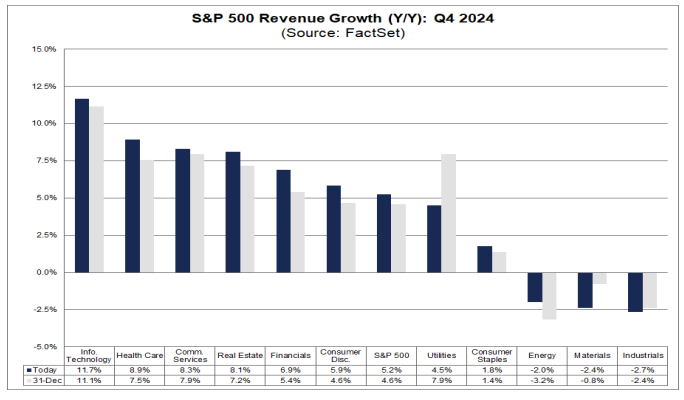
In terms of Q4 revenues, 62% of SPX reporters have beaten est's (down -1% w/w), below the 5-yr avg of 69% and 10yr avg of 64%, and they are just +0.8% above est’s (-0.1% w/w) well below the 5-yr avg of +2.1% and 10yr avg of +1.4%. Still, Factset says SPX co’s are expected to see revenue growth of 5.2% y/y (+0.2% w/w), equal to the +5.2% on Sept 30 but up from +4.6% at the end of the 4th quarter. It would mark the 17th consecutive quarter of revenue growth for the index.
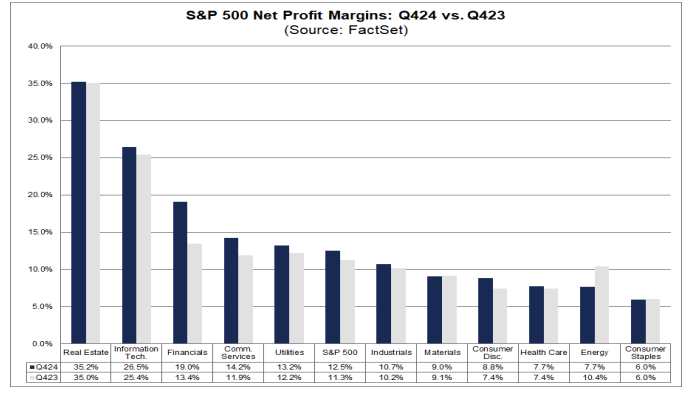
In terms of profit margins, Factset says SPX co’s are expected to report net profit margin of 12.5% for Q4 (+0.4% w/w), now above the previous quarter’s net profit margin of 12.2%, the year-ago net profit margin of 11.3% and the 5-year average of 11.6%.
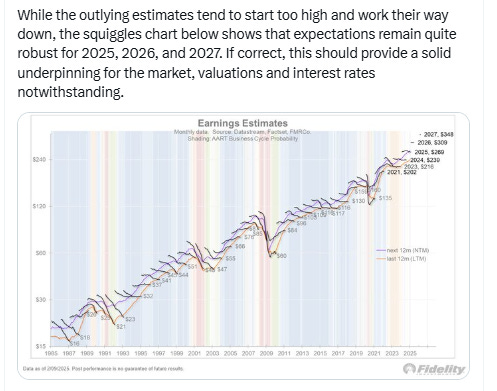
While Q4 earnings expectations continue to increase, 2025 quarter-by-quarter earnings continue to fall according to Factset particularly for Q1 & Q4.
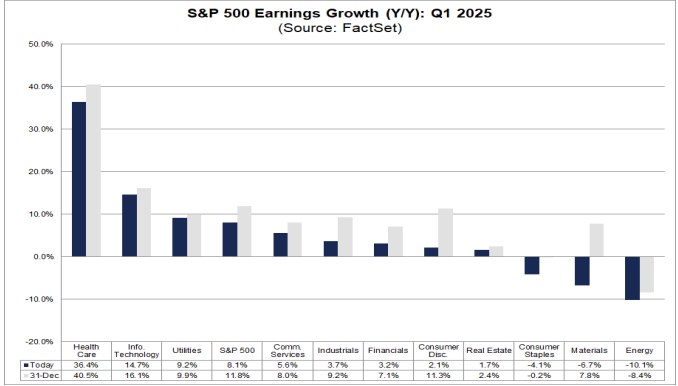
Q1 ‘25 fell -0.6% to +8.1% (-6.0% last 15 wks), Q2 ‘25 down three tenths to +9.9% (-3.2% last 15 wks), Q3 down a tenth to +14.5%, and Q4 down -0.4% to +12.9% (-3.7% the past 3 wks).
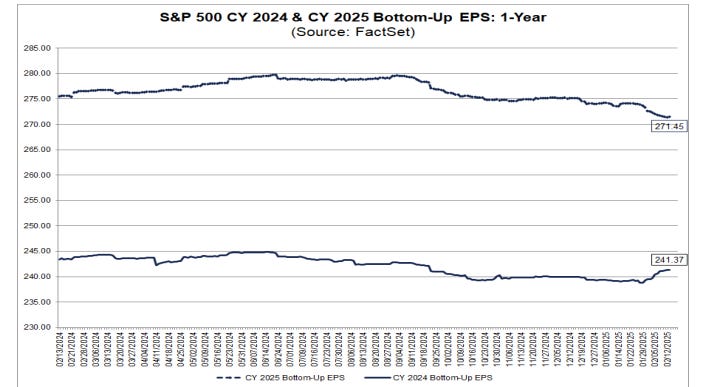
With Q4 earnings expectations increasing, FY ‘24 exp's according to Factset rose another $0.73 to $241.37 (up ~$2 the past two weeks), representing +10.2% growth (up +0.1% w/w). Looking further back, it remains down just around -1.7% from July 1, 2023, much better than the typical -6% or so drop we historically see.
2025 earnings expectations though with the quarter-by-quarter numbers deteriorating, fell to the least in 2 yrs at $272.10 (-$0.65 w/w, down ~-$3 the past three weeks, although weirdly the y/y growth rate improved to +12.7% growth (+0.7% w/w but still down ~-4.1% since Sept 1st (which is in line with the historic average excluding "outlier" years (2001, 2008, 2009 & 2020 (see below)))).
In terms of the earnings growth exp’d for 2025 Factset notes it will be a record, although also notes that there is on average over the past 25 yrs a -6.3% deterioration from where it starts the year ($275.05) w/analysts overestimating in 17 of those yrs (which would equate to $257.72 based on the average deterioration). But it should be noted that average includes 4 outlier years (2001, 2008, 2009 & 2020) where the overestimation was b/w 27-43% due to recessions. Excluding those, the difference is just -1.1% (which would equate to $272.02 (a little below where we are now)).
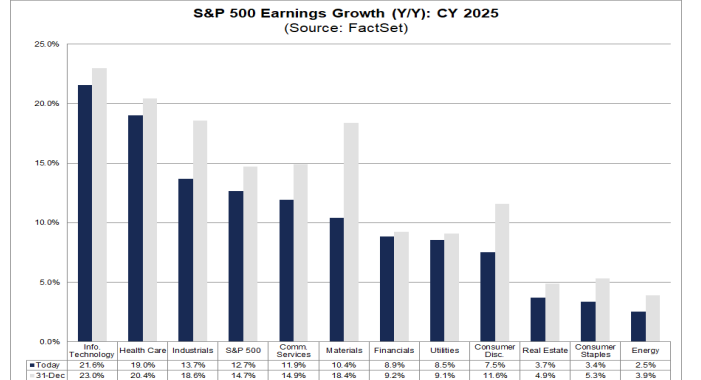
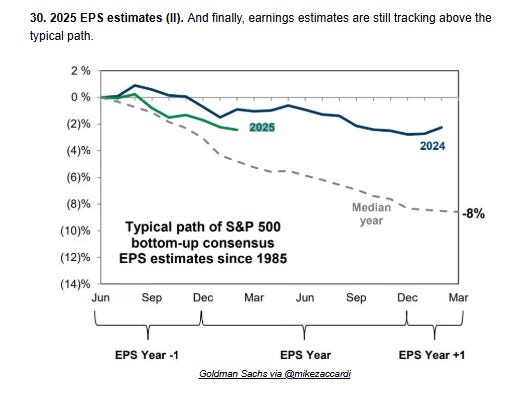
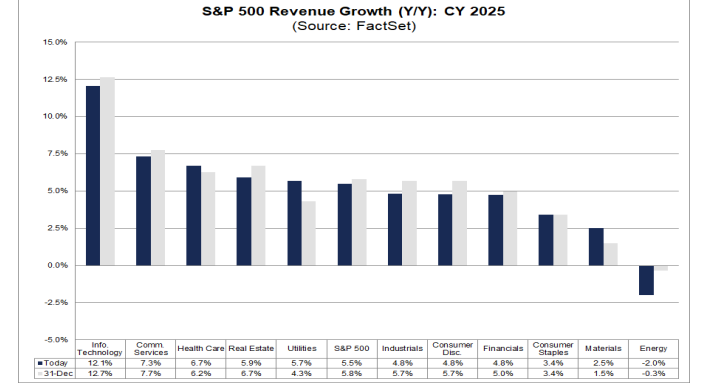
2025 revenues are expected to grow +5.5% down -0.2% since Dec 31st.
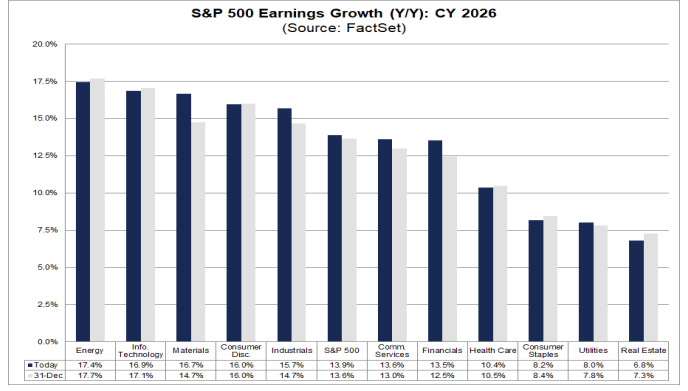
FWIW 2026 earnings are exp’d to grow 13.9% (up +0.3% w/w & +0.6% since Dec 31st).
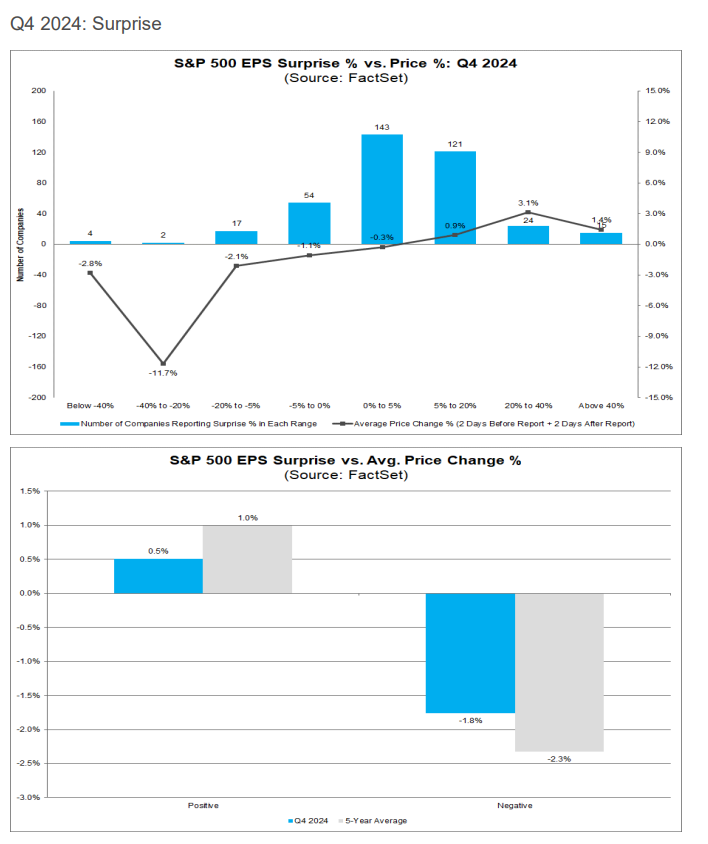
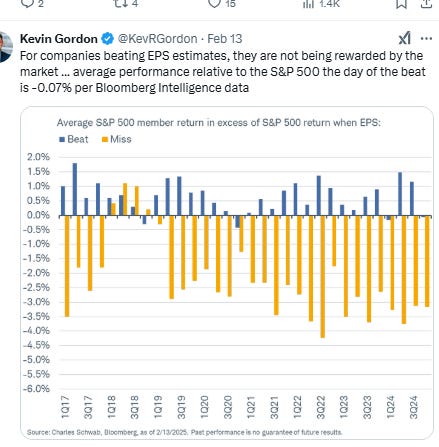
In terms of how markets are handled earnings beats & misses for 4Q, looking 2 days before to 2 days after an earnings release, Factset continues to see beats getting just half the normal reward at +0.5% up +0.2% w/w but well below the 5yr avg of +1%, but misses are now punished slightly less than average at -1.8% (from -2.4% the prior wk & vs 5yr avg of -2.3%).
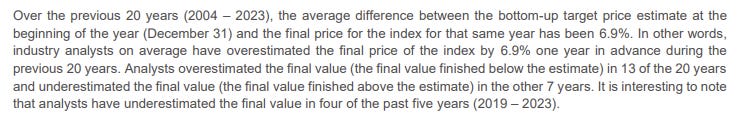
Factset’s analysis of analyst bottom-up SPX price targets for the next 12 months as of Thursday was up +32pts w/w to 6,920 (which would be +13.2% from Thursday's close), now up ~1,887 points over the past 46 weeks.
Energy (+16.7%, down from +18.1% the prior week) replaced Tech (second at +15.9% down from +18.3%) as the sector with the largest upside seen by analysts, while Consumer Staples remains as the sector expected to see the smallest price increase (+6.3% down from +7.2%) followed by Financials (+8.8% up from +7.6%).
As a reminder the last 20 yrs they have been on avg +6.3% too high, but note they underestimated it five of the past six years (including 2024).

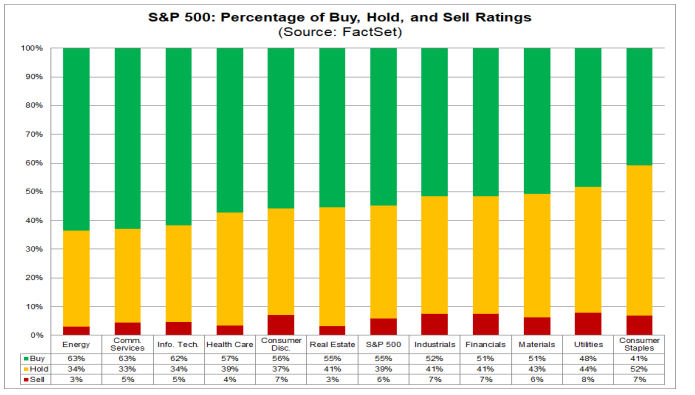
In terms of analyst ratings, buy and hold ratings continue to dominate at 54.8% & 39.4% (from 54.6% & 39.6% respectively last wk (sell ratings remained at 5.8%)). That 54.8% in buy ratings though is down somewhat from 57.5% in Feb ‘22.
Energy (63%), Communication Services (63%), and Information Technology (62%) sectors have the highest percentages of Buy ratings, while Consumer Staples (41%) has the lowest percentage of Buy ratings. Utilities has the most sell ratings (8%), Energy & RE the least (3%).
And some other earnings stuff:


Economy
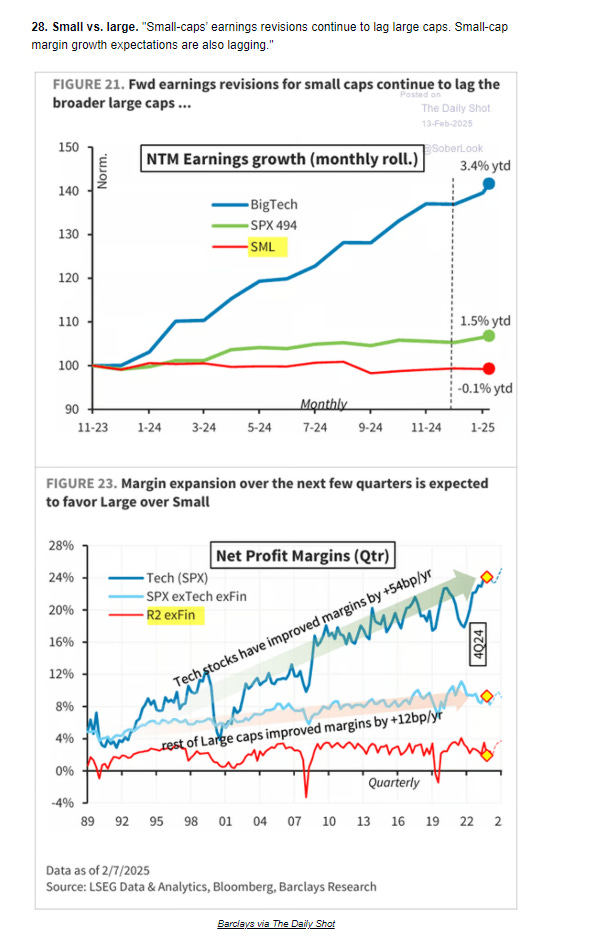
Over the past 2+ years part of my earnings optimism has been due to the economy holding up better than expected. While earnings only track the economy loosely (and markets look forward 6-12 months), there is a clear positive correlation between the economy and earnings (particularly a weak economy and weak earnings), and there is a very strong correlation between earnings and stock prices (although stock prices (being as noted forward looking) generally fall in advance of a recession and bottom 6-9 months before the end of one). So if you can see a recession coming it is quite helpful, although very difficult (especially ahead of the market). You can reference this Week Ahead (see the Economy section) for a lot of material on how every recession is preceded by talk of a “soft landing” as close as a month before the start. That report also has the notes about how small caps have shorter debt maturity profiles and more of it (debt).
As I’ve been stating since I switched to the Week Ahead format in mid-2022, the indicators to me are consistent with solid (which at times has been robust) economic growth, and I have been a broken record that I “certainly do not think we’re on the verge of a recession (although as noted above every recession starts out looking like just some economic softening).”
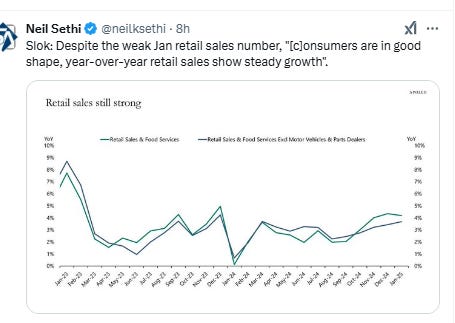
After several weeks of stronger growth following the more mixed performance we’d seen in late November/December, this week was described as many as less so, but really other than retail sales (which as I noted in Friday’s summary was a very messy report (to the point that BoA predicted a very weak outcome despite their overall constructive outlook on the US consumer), things were on balance evidence of a strong economy with prices remaining firm, jobless claims remaining low, and industrial production solid (although much was due to a jump in utilities with manufacturing seeing a slight decline).
So for now I don’t see any changes to my overall takeaway on the economy from the start of October that “the situation continues to seem like manufacturing is subdued but trying to bottom, housing perhaps has inflected off the bottom, labor markets (and the services sector and construction in particular) are solid with very healthy wage growth, and productivity appears to be robust (this can be a game changer in allowing the economy to expand without triggering inflation)…. I continue to feel that any softening does not appear to be morphing into a recession.”
And as I said 24 weeks ago:
without question, the evidence is building that the days of >3% real GDP growth are behind us (although we got there in Q3), and we should be happy to settle into something more around trend (1-3% real (infl adjusted) growth). That though is far from a disaster. The important thing will be to see the softening level out (L-shape) rather than continue to fall turning the “soft landing” into a recession.
So far that’s what we’ve seen.
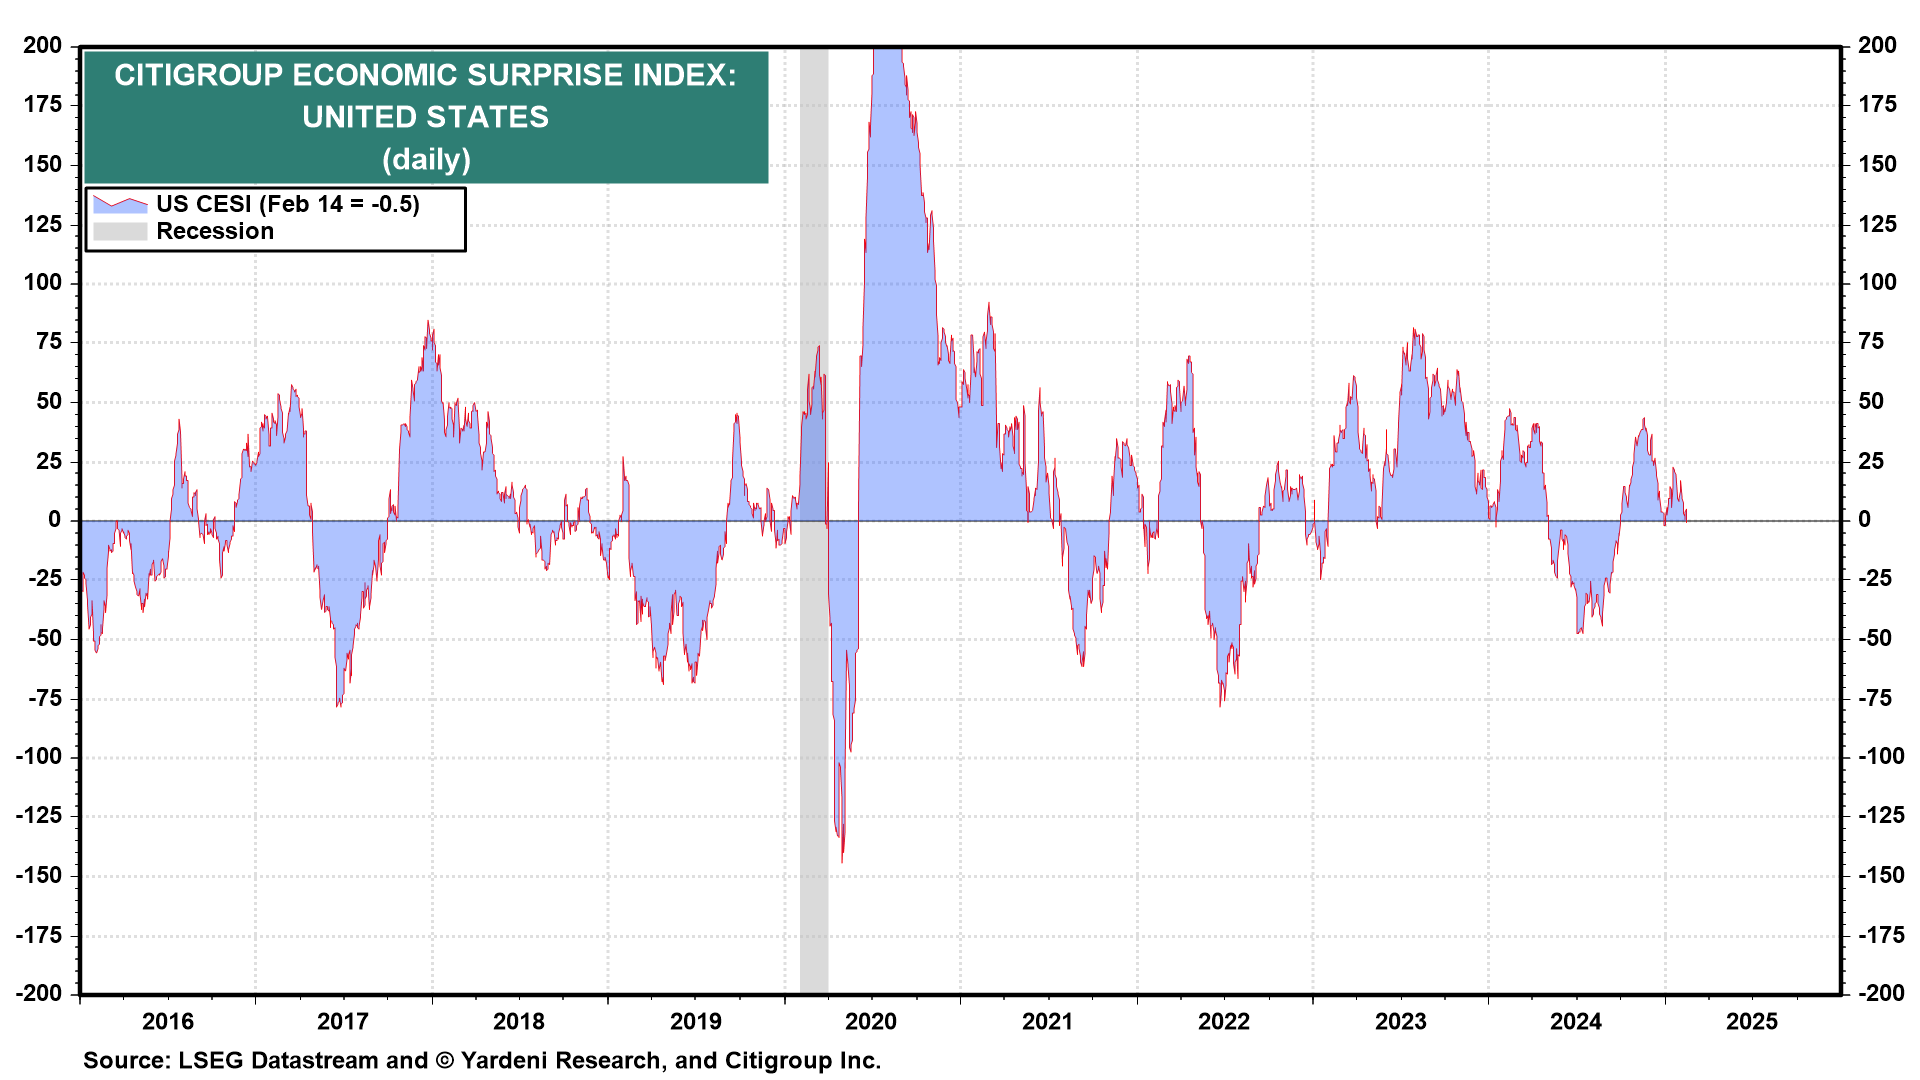
The Citi Economic Surprise Index fell back -8.2 pts w/w, now in negative territory for the first time since the start of the year, at -0.5, down now -23.0 pts from the highs of the year (22.5) four weeks ago (and further (-43.8pts) from the December highs (43.3)), now just +1.2 pts above the least since Sept (-1.7 on Dec 31st).
The 2024 high was 47.2 (in Feb) and the low -47.5 (in July).
https://yardeni.com/charts/citigroup-economic-surprise/
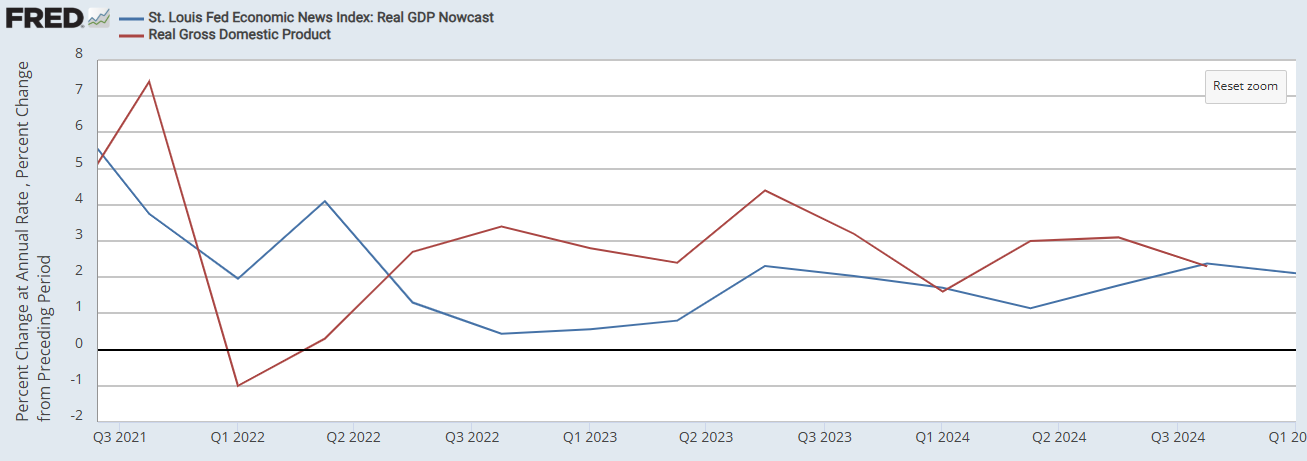
And GDP estimates are for now consistent with a no recession call (again though remembering GDP going into recessions generally doesn’t look like one is coming (it was up around 2% in Q2 & Q3 2008 well after the recession had started)). After Q3 was revised up to 3.1%, Q4 decelerated but still above trend at 2.3%, and the trackers that have initiated Q1 tracking are currently looking for around that in Q1 (although it’s very early).
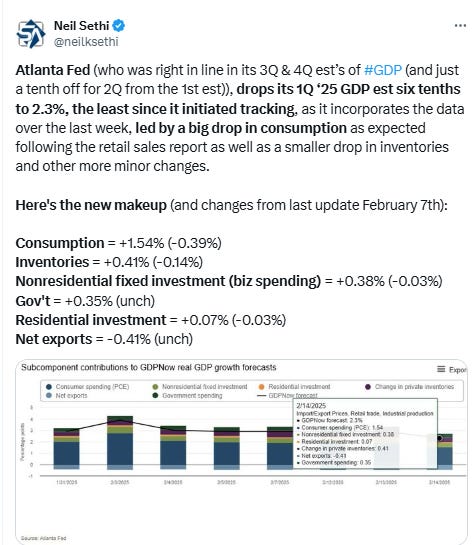
Atlanta Fed (who was right in line in its 3Q & 4Q est’s of GDP (and just a tenth off for 2Q from the 1st est)), drops its 1Q ‘25 GDP est six tenths to 2.3%, the least since it initiated tracking, as it incorporates the data over the last week, led by a big drop in consumption as expected following the retail sales report as well as a smaller drop in inventories and other more minor changes.
BoA (who as a reminder was right on for 4Q GDP vs the 1st estimate and two tenths high for 3Q), still hasn’t released their 1Q tracking.
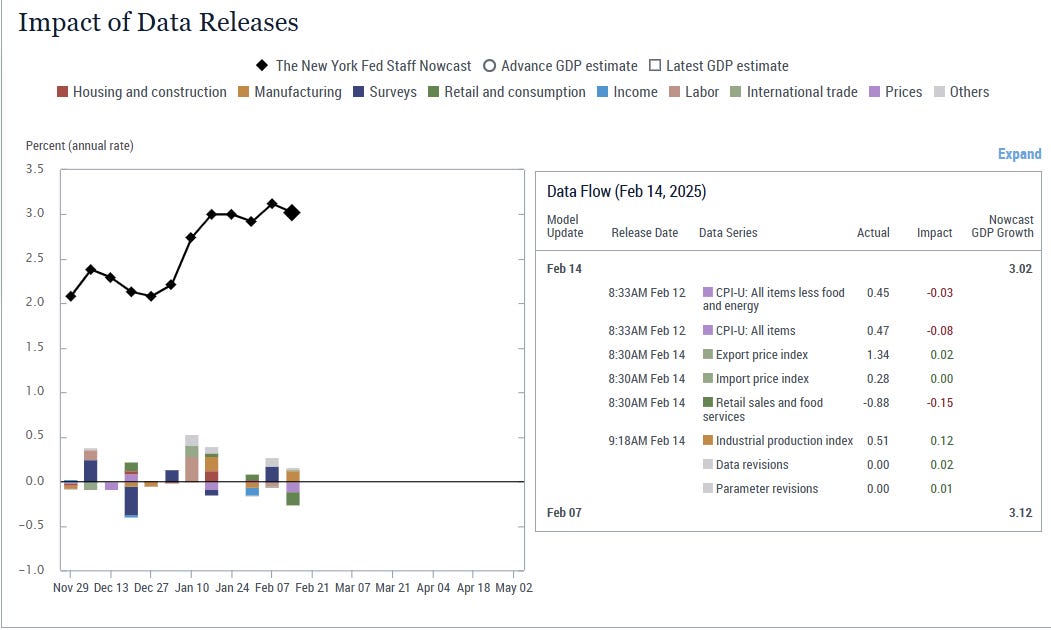
NY Fed’s 1Q #GDP Nowcast (as a reminder, they had 2.56% for 4Q vs 2.3% 1st est (they were off a similar amount for 3Q)) fell back much less than the Atlanta Fed’s forecast down just one tenth to 3.02% (with just a -0.15% subtraction from retail sales, almost fully offset by a +0.12% boost from industrial production; CPI though subtracted -0.11% (as it’s an inflation adjusted number)."
As a reminder, the NY Fed’s model is dynamic and so adjusts in real time as data evolves, and “parameter revisions” added +0.01%.
And the St. Louis Fed GDP tracker, which has often undershot actual real GDP since Q2 ‘22, but which was right on in Q1 & Q4 2024, initiates its tracking at 2.11%, the lowest of the Fed trackers.
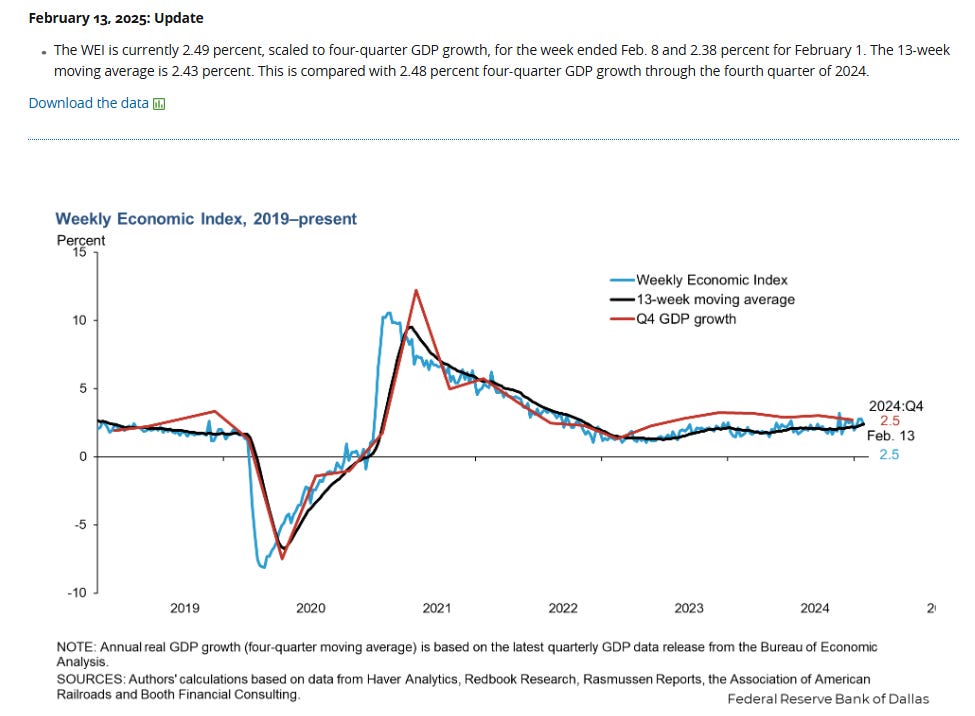
Weekly Econ Index from the @DallasFed (scaled as y/y rise for #GDP), which runs a week behind other GDP trackers, in the week through Feb 8th (so did not include retail sales) improved to 2.49% from 2.38% in the prior week (rev’d from 2.49%) remaining in the top of the 2024 range (1.49 - 2.66%) that it left only twice during 2024 but which it had been above again the last two weeks in January.
The 13-wk avg continued its steady improvement now up to 2.43%, the best since early 2022, evidencing overall economic momentum that is accelerating above trend.
https://www.dallasfed.org/research/wei
Other economy stuff:
Valuations
Like the other sections, I’ll just post current week items regarding the multiple. For the historical stuff, see the Feb 4th blog post.
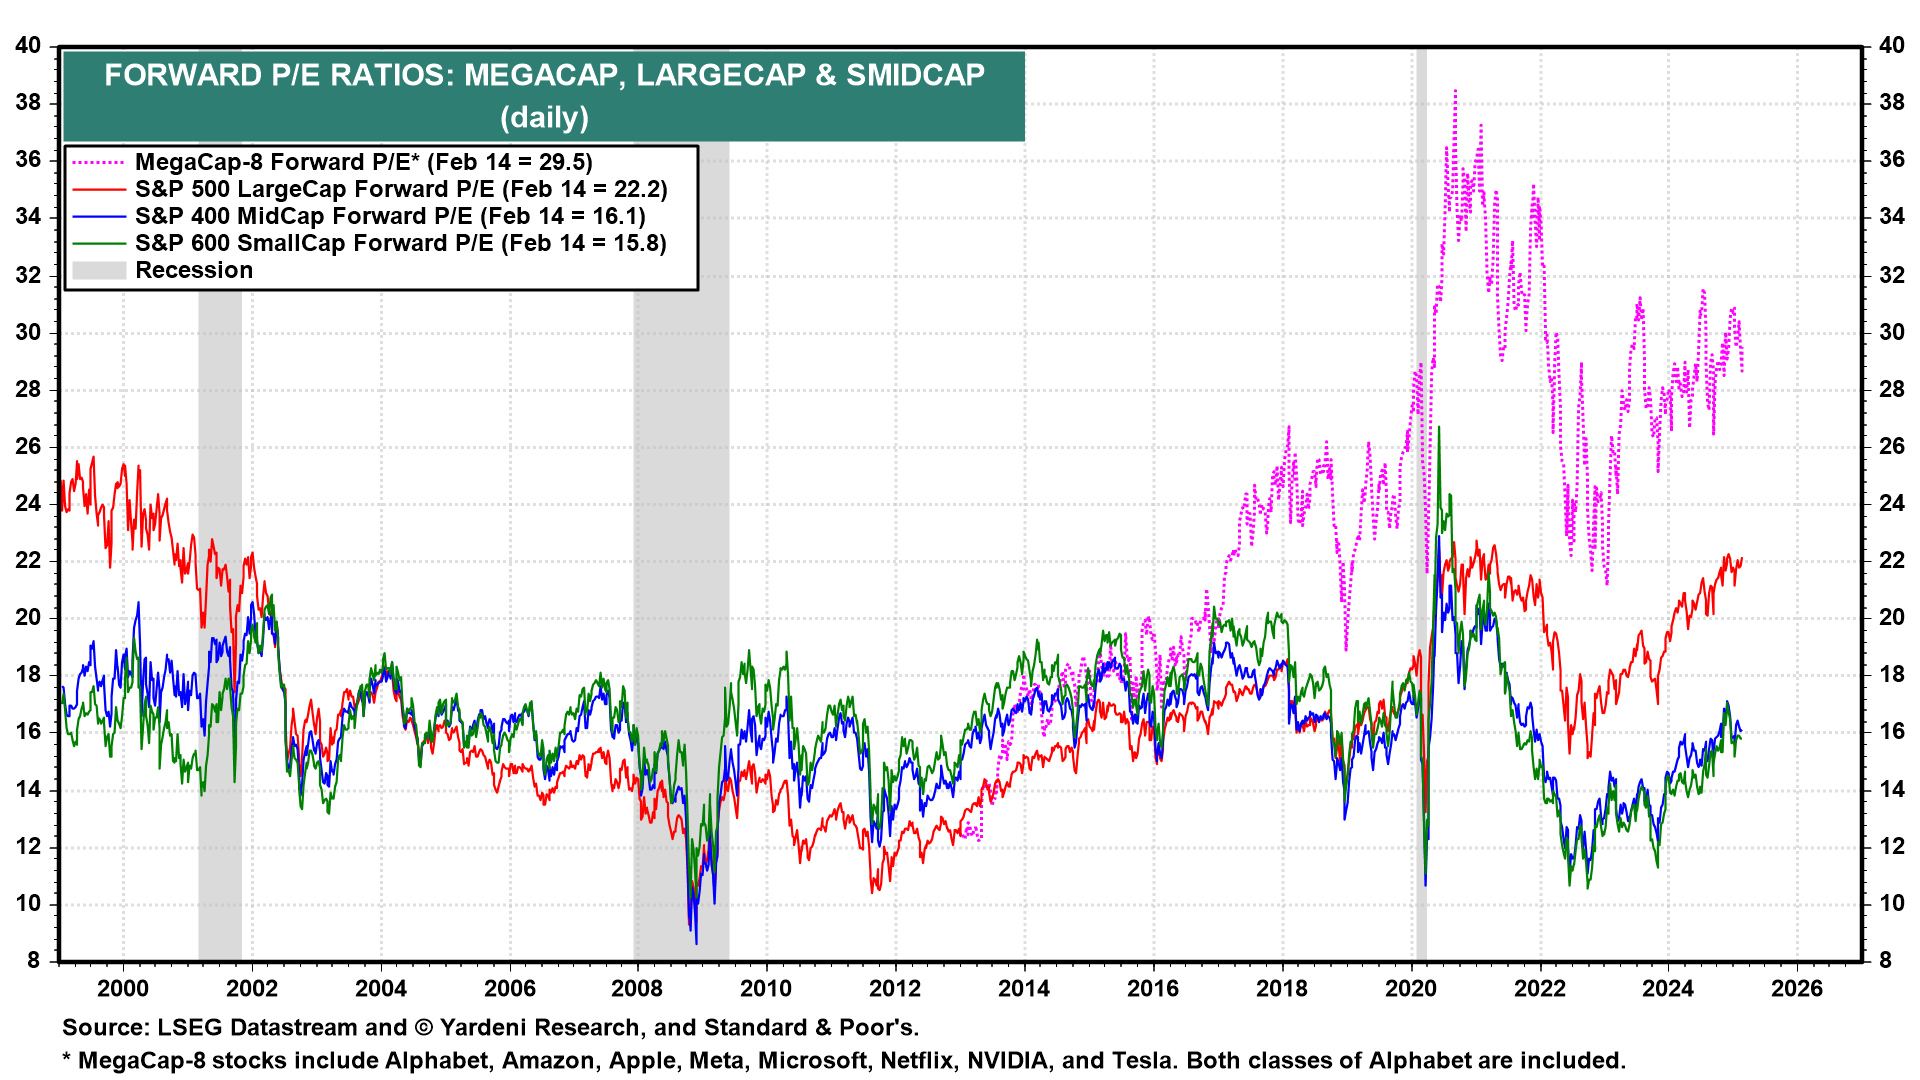
With equities edging higher and earnings estimates edging lower (both for large caps), forward P/Es did as well for that group while remaining unchanged for small and mid-caps:
-The SPX forward P/E up four tenths to 22.2 after remaining unchanged for three weeks, now just -0.1pt from the highest since mid-'21.
-Mid-caps (S&P 400) remained at 16.1 (down -1.0pt from the highest since early-’21 (17.1)).
-Small caps (S&P 600) also unchanged at 15.8 (down -1.3pts from the highest since early-’21 (17.1)).
-Yardeni's “Megacap-8” (adds NFLX) P/E up for the first time in four weeks +0.8pts to 29.5, +3.1pts from the 26.4 it hit in early Oct which was the least of 2024 (31.5 was the 2024 high from July (which was the highest since Jan ‘22)).
https://yardeni.com/charts/stock-market-p-e-ratios/
Other valuation stuff:
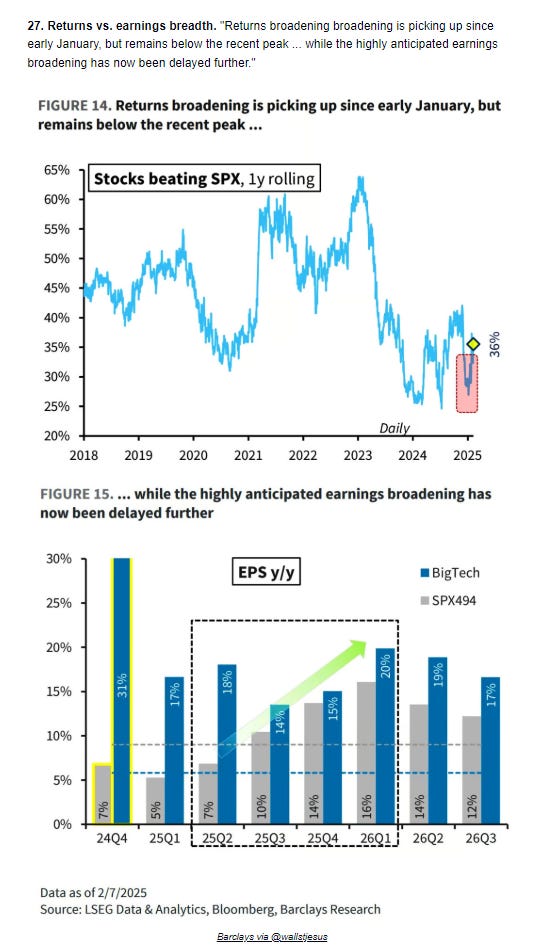
Breadth
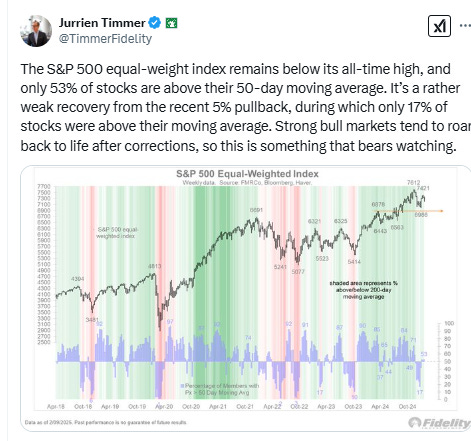
Breadth which was looking great three weeks ago, was mixed with some very minor improvement in some metrics, but overall far away from where we were entering December.
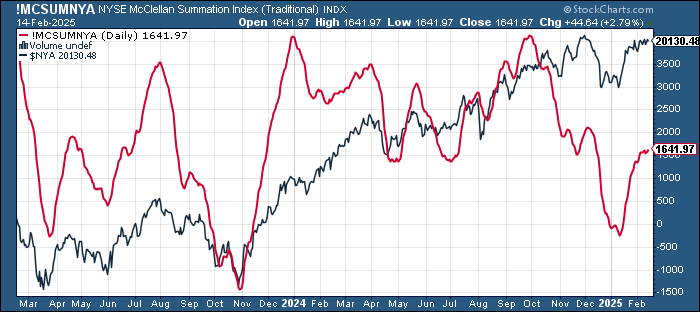
The McClellan Summation Index ("what the avg stock is doing") edged higher this week hitting a 2-mth high (after hitting the least since Nov ‘23 six weeks ago), but the momentum has clearly slowed, and it is close to rolling over.
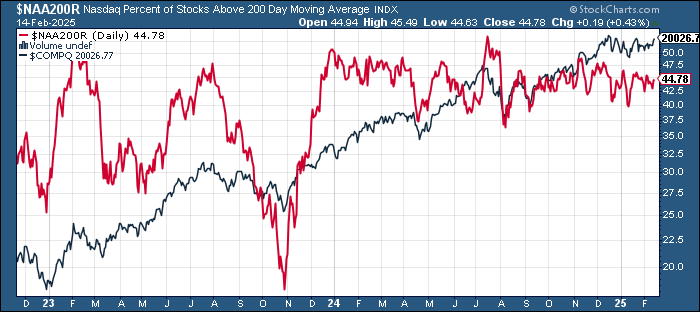
% of stocks over 200-DMAs edged higher last week but remains in the middle of its range since December.

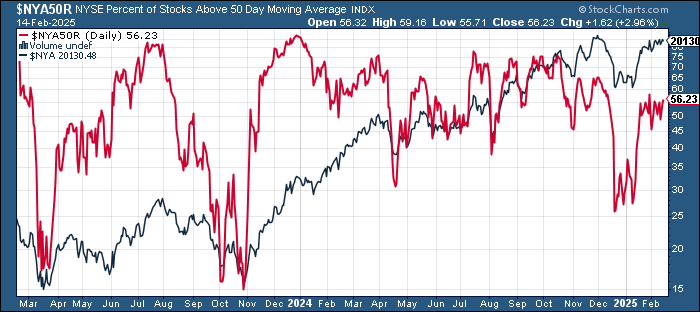
% of stocks above 50-DMAs, like those over 200-DMAs, also edged higher also in the middle of the range from the start of December.

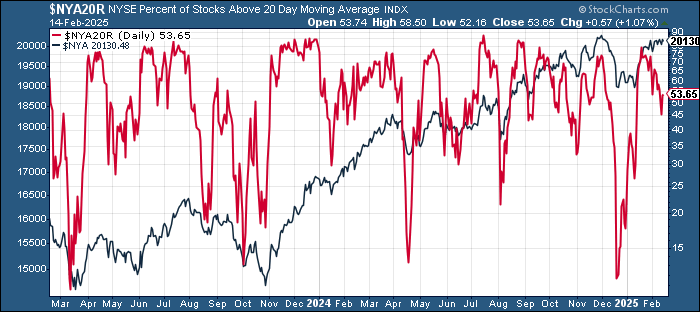
% of stocks above 20-DMAs also edged higher but well off the best levels of the year.
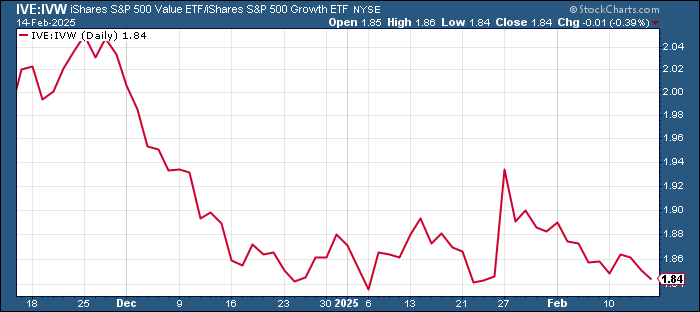
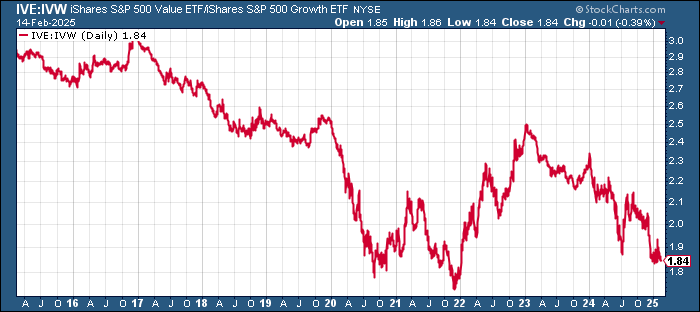
Value/Growth continued to fall back from the 6-wk high three weeks ago, now just above the lows of the year which were the least since Jan ‘22.
The equal-weighted SPX vs cap weighted ratio like value/growth hit a 6-wk high three weeks ago but since then has fallen back towards the all-time lows hit in July although remaining (so far) just off the lows of the year.
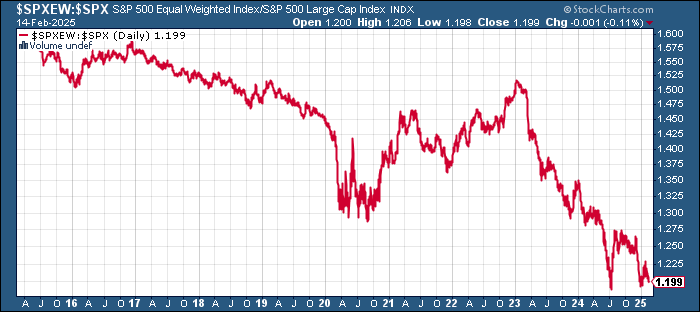
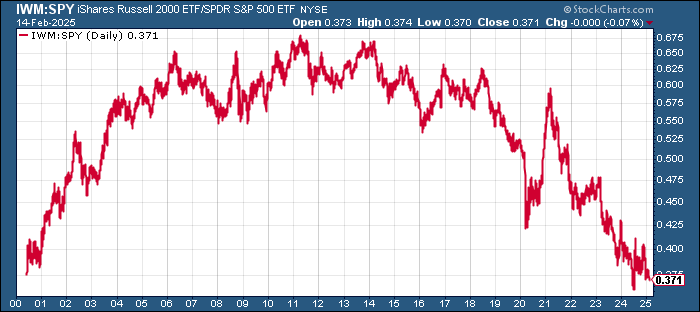
Unlike value/growth or the equal-weight/cap weight ratios, IWM:SPY (small caps to large caps), didn’t spike three weeks ago (DeepSeek day) and is now at the lowest since July (which was the least since 2000).
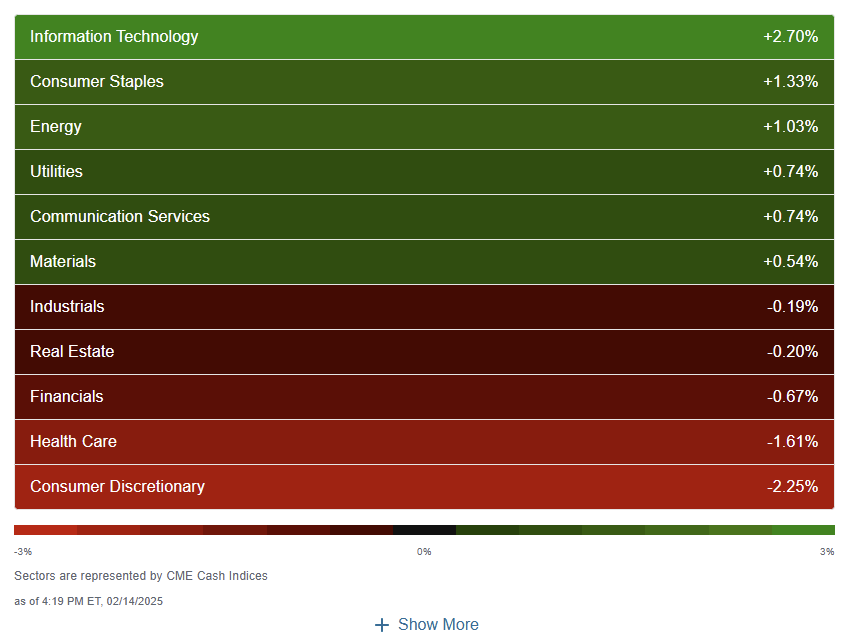
Equity sector breadth based on CME Cash Indices improved last week with 6 of 11 sectors green, up from 3 the prior week and from 5 the week before that, (but down from 9 the week before that), with five sectors up more than +0.7% (vs five down that much prior week), and three up over 1% (up from one the prior week (but down from four the week before that)).
Two sectors were though down over -1%, health care which dropped sharply this week after Pres Trump signed an order eliminating federal funding for schools with Covid vaccine mandates (even though no schools have Covid vaccine mandates but it was the messaging for vaccine makers I guess) and Cons Discr which finished in last place for a 2nd week (on weakness in TSLA, Marriott, and Lululemon (although there were strong performances from Nike, McDonalds, and Airbnb).
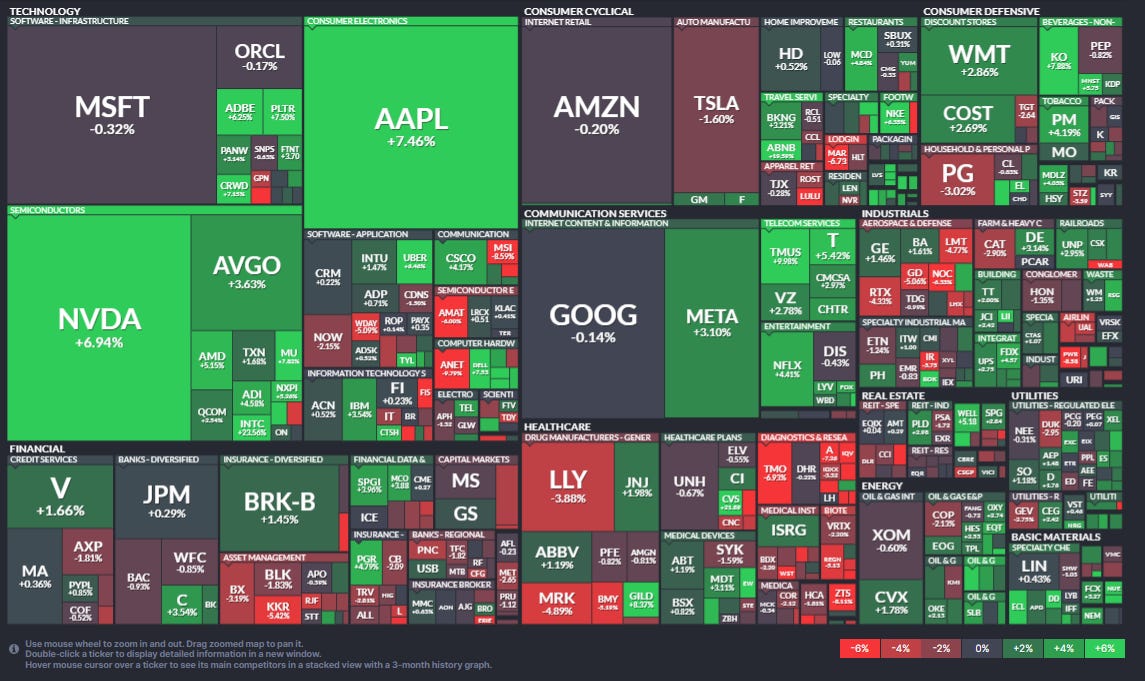
SPX sector flag showing the details. Another strong week from NVDA (+7% after +8% the prior week), while AAPL saw a big rebound +7.5%. META was up just +3.1% in comparison despite gaining every day. Quite a few stocks down over -5% including ANET, AMAT, WDAY, MSI, KKR, MAR, NOC, GD, MAR, LULU, BMY, and a number of diagnostics companies such as TMO.
Other breadth stuff:

Flows/Positioning
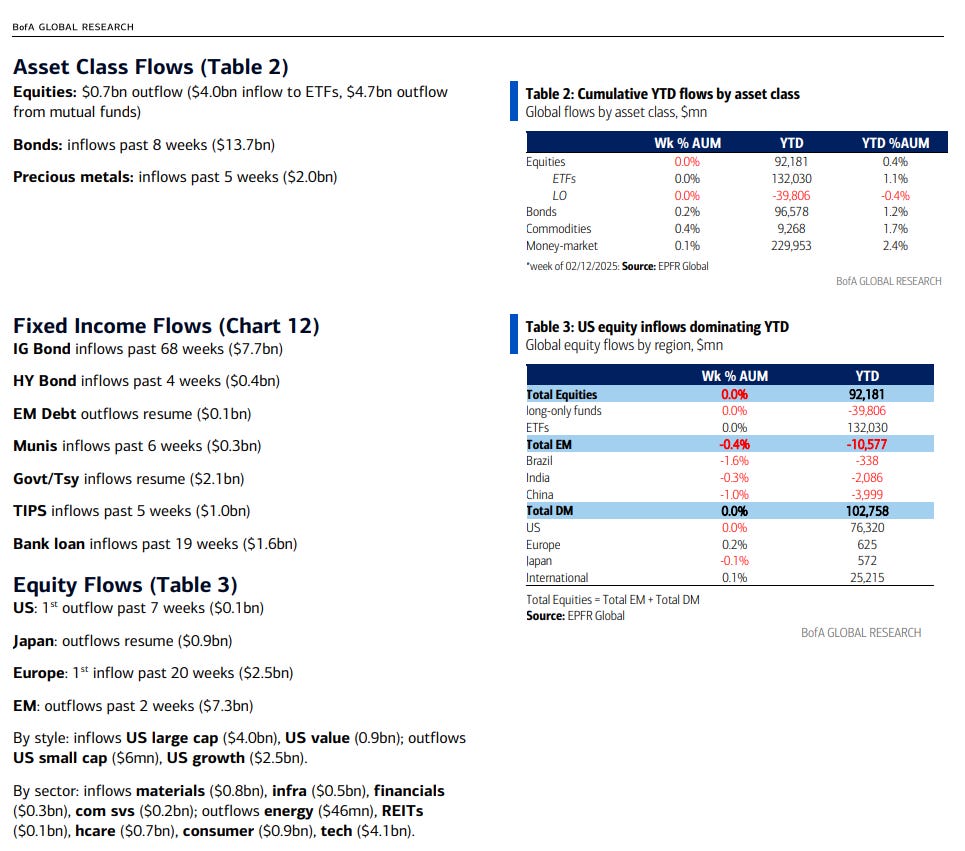
Overall global flows from BoA (EPFR data): $13.7bn to bonds, $9.0bn to cash, $2.0bn to gold, $0.1bn from crypto, $0.7bn from stocks.
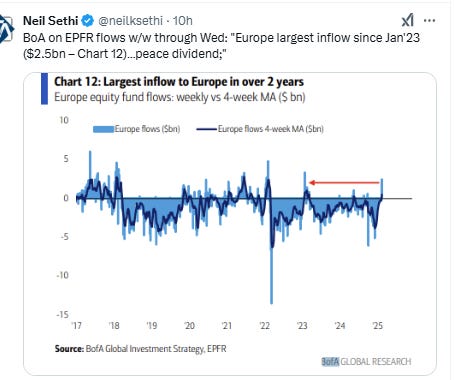
Here were some notables. It was the first back-to-back outflow for equities in 10 months with tech 2nd largest outflow on record and China 3rd largest, but Europe largest inflow since Jan ‘23, and we saw the largest inflow to infrastructure equities since June ‘22 (and US large caps still saw +4.0bn in inflows).
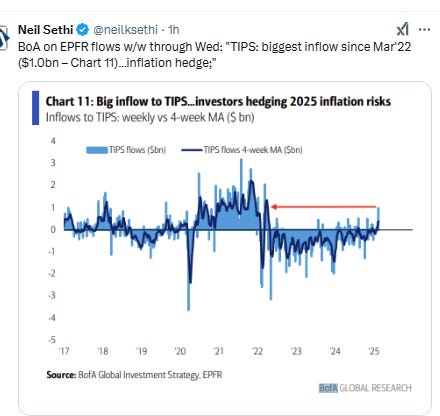
It was also the largest inflow to TIPS since Mar ‘22, and 6th largest inflow to gold in the last 4 yrs. IG bonds saw a 68th consecutive week of inflows.
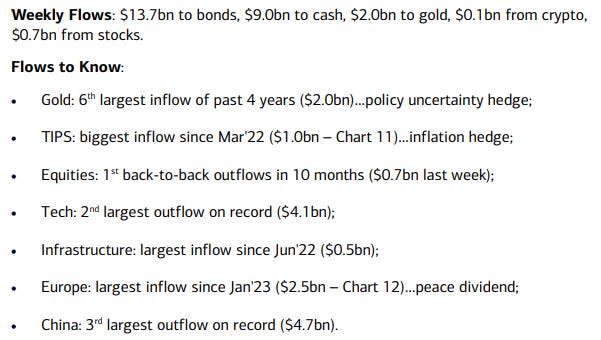
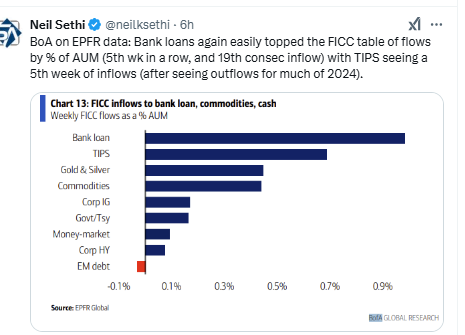
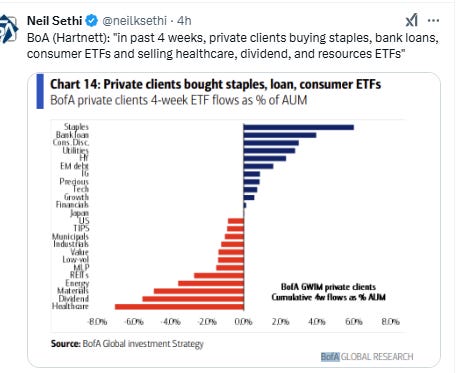
Bank loans again easily topped the FICC table of flows by % of AUM (5th wk in a row, and 19th consec inflow) with TIPS seeing a 5th week of inflows (after seeing outflows for much of 2024).

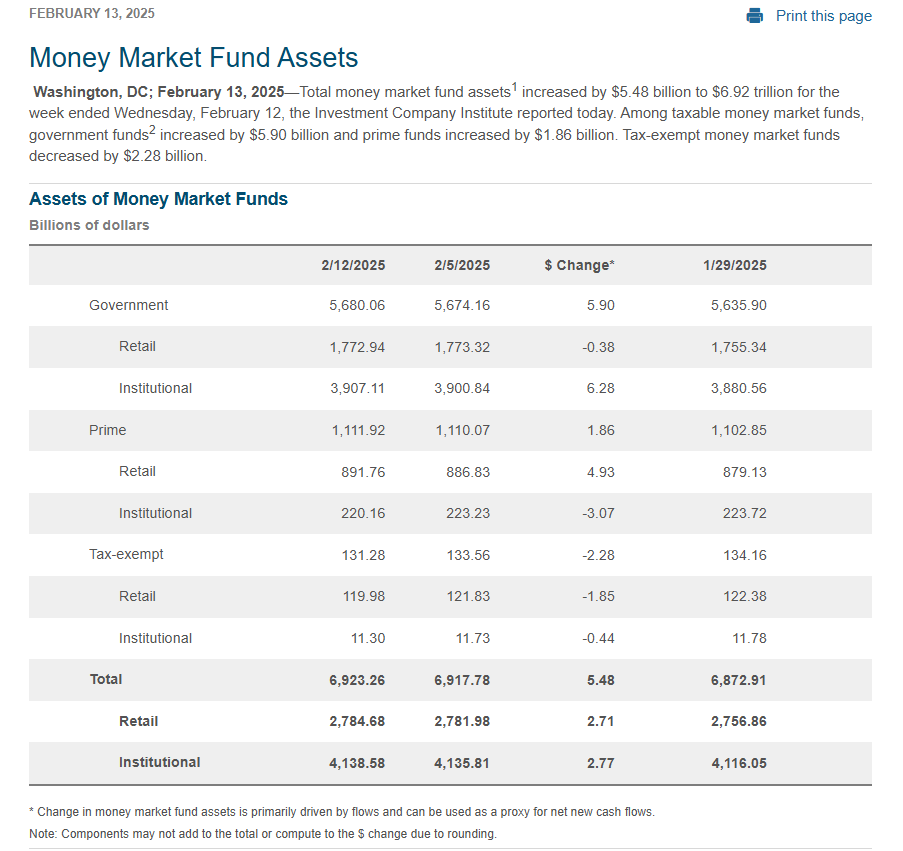
ICI data on money market flows saw a +$5.5bn inflow in the week through Feb 13th, in line with the +$9bn EPFR saw.
ICI data saw ~+$962bn in MMF inflows in 2024 and +$1.15tn in 2023. Total MMF assets are at a record $6.92tn. Institutional gained +$2.8bn, retail +$2.7bn. In terms of totals, 60% of MMF’s are held by institutions, 40% retail.
https://www.ici.org/research/stats/mmf
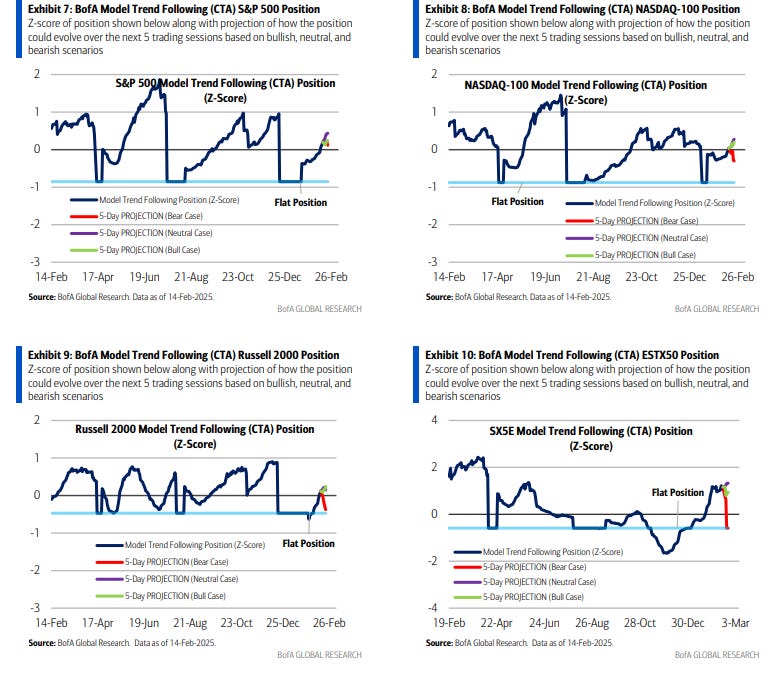
Looking at CTA (trend follower) US equity positioning, BoA didn’t have a lot again this week just noting that “US equity trend is still at moderate levels and CTAs could add to longs next week if upside persists.”
So, after modest buying the last two weeks in SPX & RUT and last week also in the NDX taking net length to the highest of the year for all three, BoA’s model sees that likely continuing in the upcoming week, but unlike last week where there was minimal selling in the “bear case,” this week that selling is more notable for the NDX & RUT if prices decline there.
Price trend remains the strongest for the $SPX at 59% up from 44% last week while #NDX is up to 54% (from 44% (but still down from 61% five weeks ago), while the $RUT lags at 29% but that’s up from -2% two weeks ago and -19% four weeks ago). #Japan’s #Nikkei225 edged up to 13% (from 11% but down from 31% two weeks ago) while the Euro #Stoxx50 is at 95%.
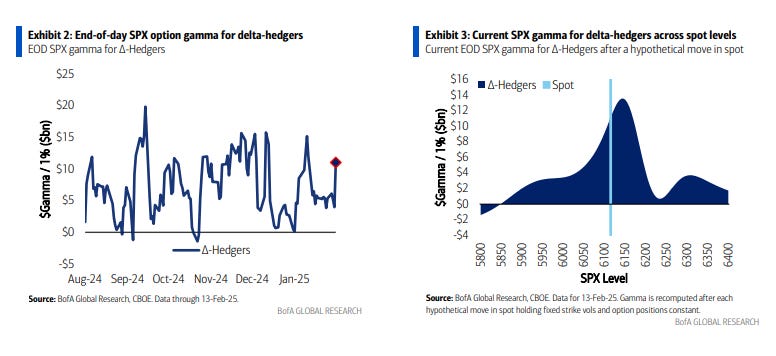
In terms of gamma positioning, BoA says “[f]or most of [last] week SPX gamma [had] been relatively modest (+$4-6bn). However, on Thursday SPX gamma jumped higher to +$11bn (86th 1y %ile) [as they had predicted on any SPX gains the prior week]. Behind the scenes, the elevated gamma is primarily due to short-dated options. Consequently, all else equal, as these options expire gamma has the potential to gap lower to a less extreme level.”
So BoA sees us back to a situation of high gamma (which dampens volatility) in the short term, but as they note a lot is due to short dated options (due to the op ex on Friday), so we’ll likely see gamma drop notably at the end of the week which will leave next week much more subject to volatility. Also note that gamma drops of quite steeply on price declines, so if we do see a move of -100 pts or so on the SPX we can expect volatility to pick up a lot. Gamma remains positive though absent a sharp -3% or so move lower.
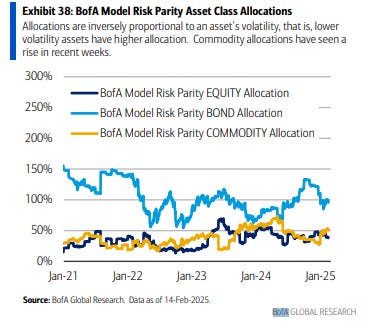
BoA est's that despite the up week in stocks and reduced volatility, risk parity left equity exposure at the lows of the year while bonds remain near the highs as do commodities (the latter just off 6-mth highs although they edged lower last week). Bonds continue to be heavily overweighted overall.
#oott
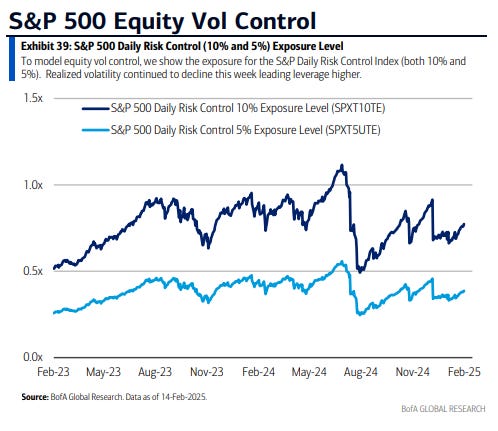
BoA est’s that while risk parity didn’t increase equity exposure much last week, volatility targeters (vol control) did, bringing their net length to the highest since the big selloff seven weeks ago. With equities remaining less volatile last week (the major indices were little changed), we could see them continue to rebuild long positions (although BoA sees little buying Tuesday).
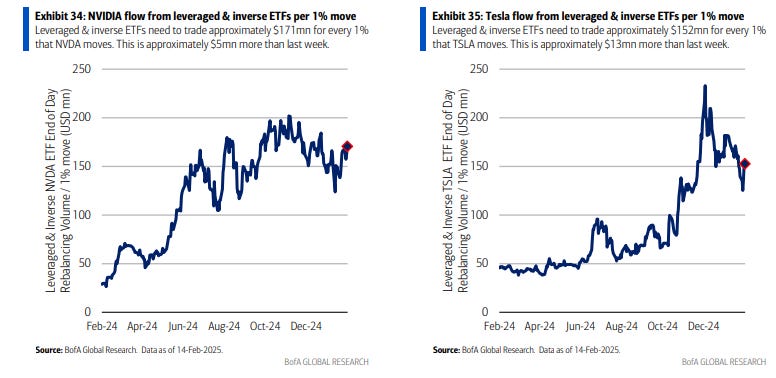
And I like to look at the notional value in leveraged ETF’s as a barometer of risk appetite. BoA says they’re rebounded from around the lows of the year “increasing with spot over the last week”.
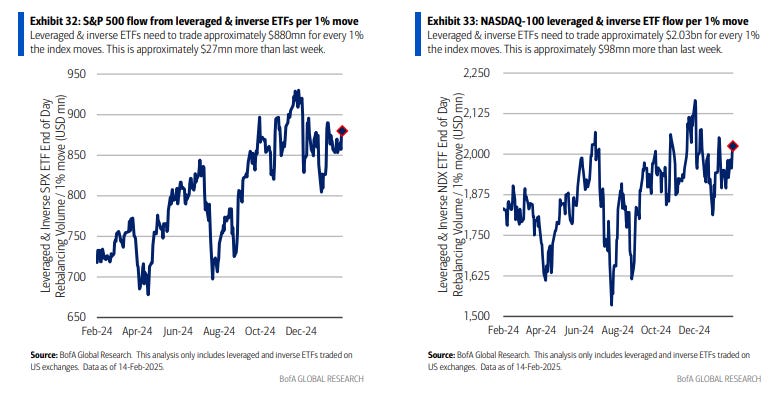
Leveraged ETF AUM in NVDA (the largest single-stock w/leveraged ETFs) now at the highest since early December. TSLA (the second largest) rebounded from the least since October.
And after buybacks ended 2024 at a record, BoA says they’ve started off the year strong.
But Goldman says announcements have been scarce with companies using the cash for capex and dividends.
And some other notes on positioning:
Sentiment
Sentiment (which I treat separately from positioning) is one of those things that is generally helpful when its above average (“it takes bulls to have a bull market”, etc.) and when it’s at extreme lows. Sentiment measures were mixed again this week with some improving and some deteriorating, but as with prior weeks most are not at extremes, so no clear picture here.
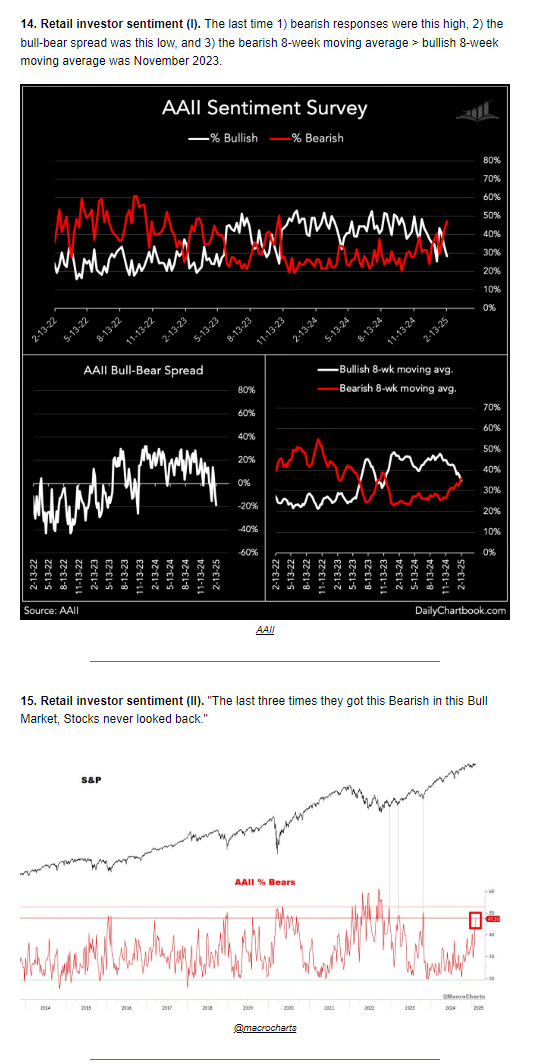
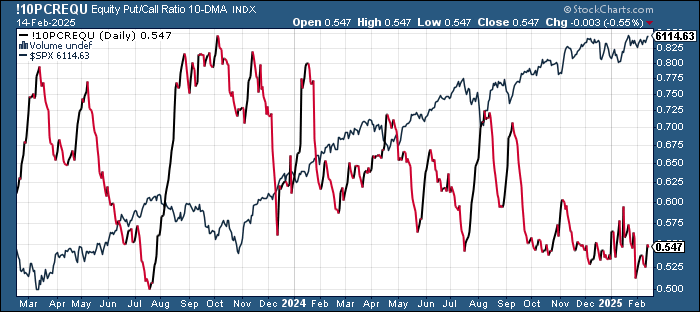
The 10-DMA of the equity put/call ratio (black/red line), after plummeting two weeks ago to the lowest since July (which was the least since Apr ‘22), continued its rebound now at the highs of the month, but remaining for now consistent with investors continuing to look for upside vs downside protection.
When it’s increasing it normally equates to a consolidation in equities and increase in volatility and vice versa.
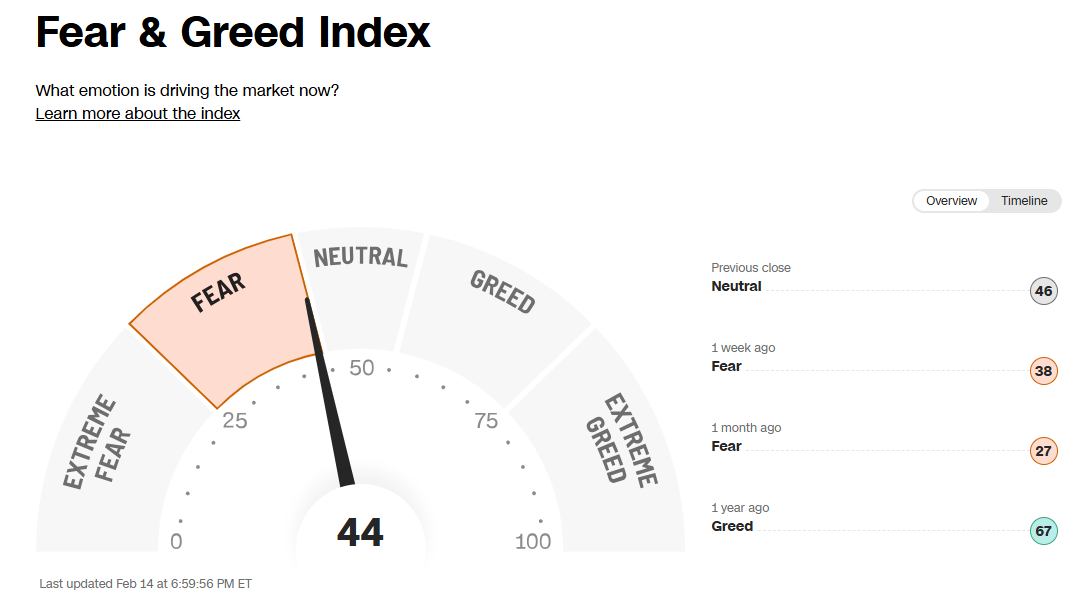
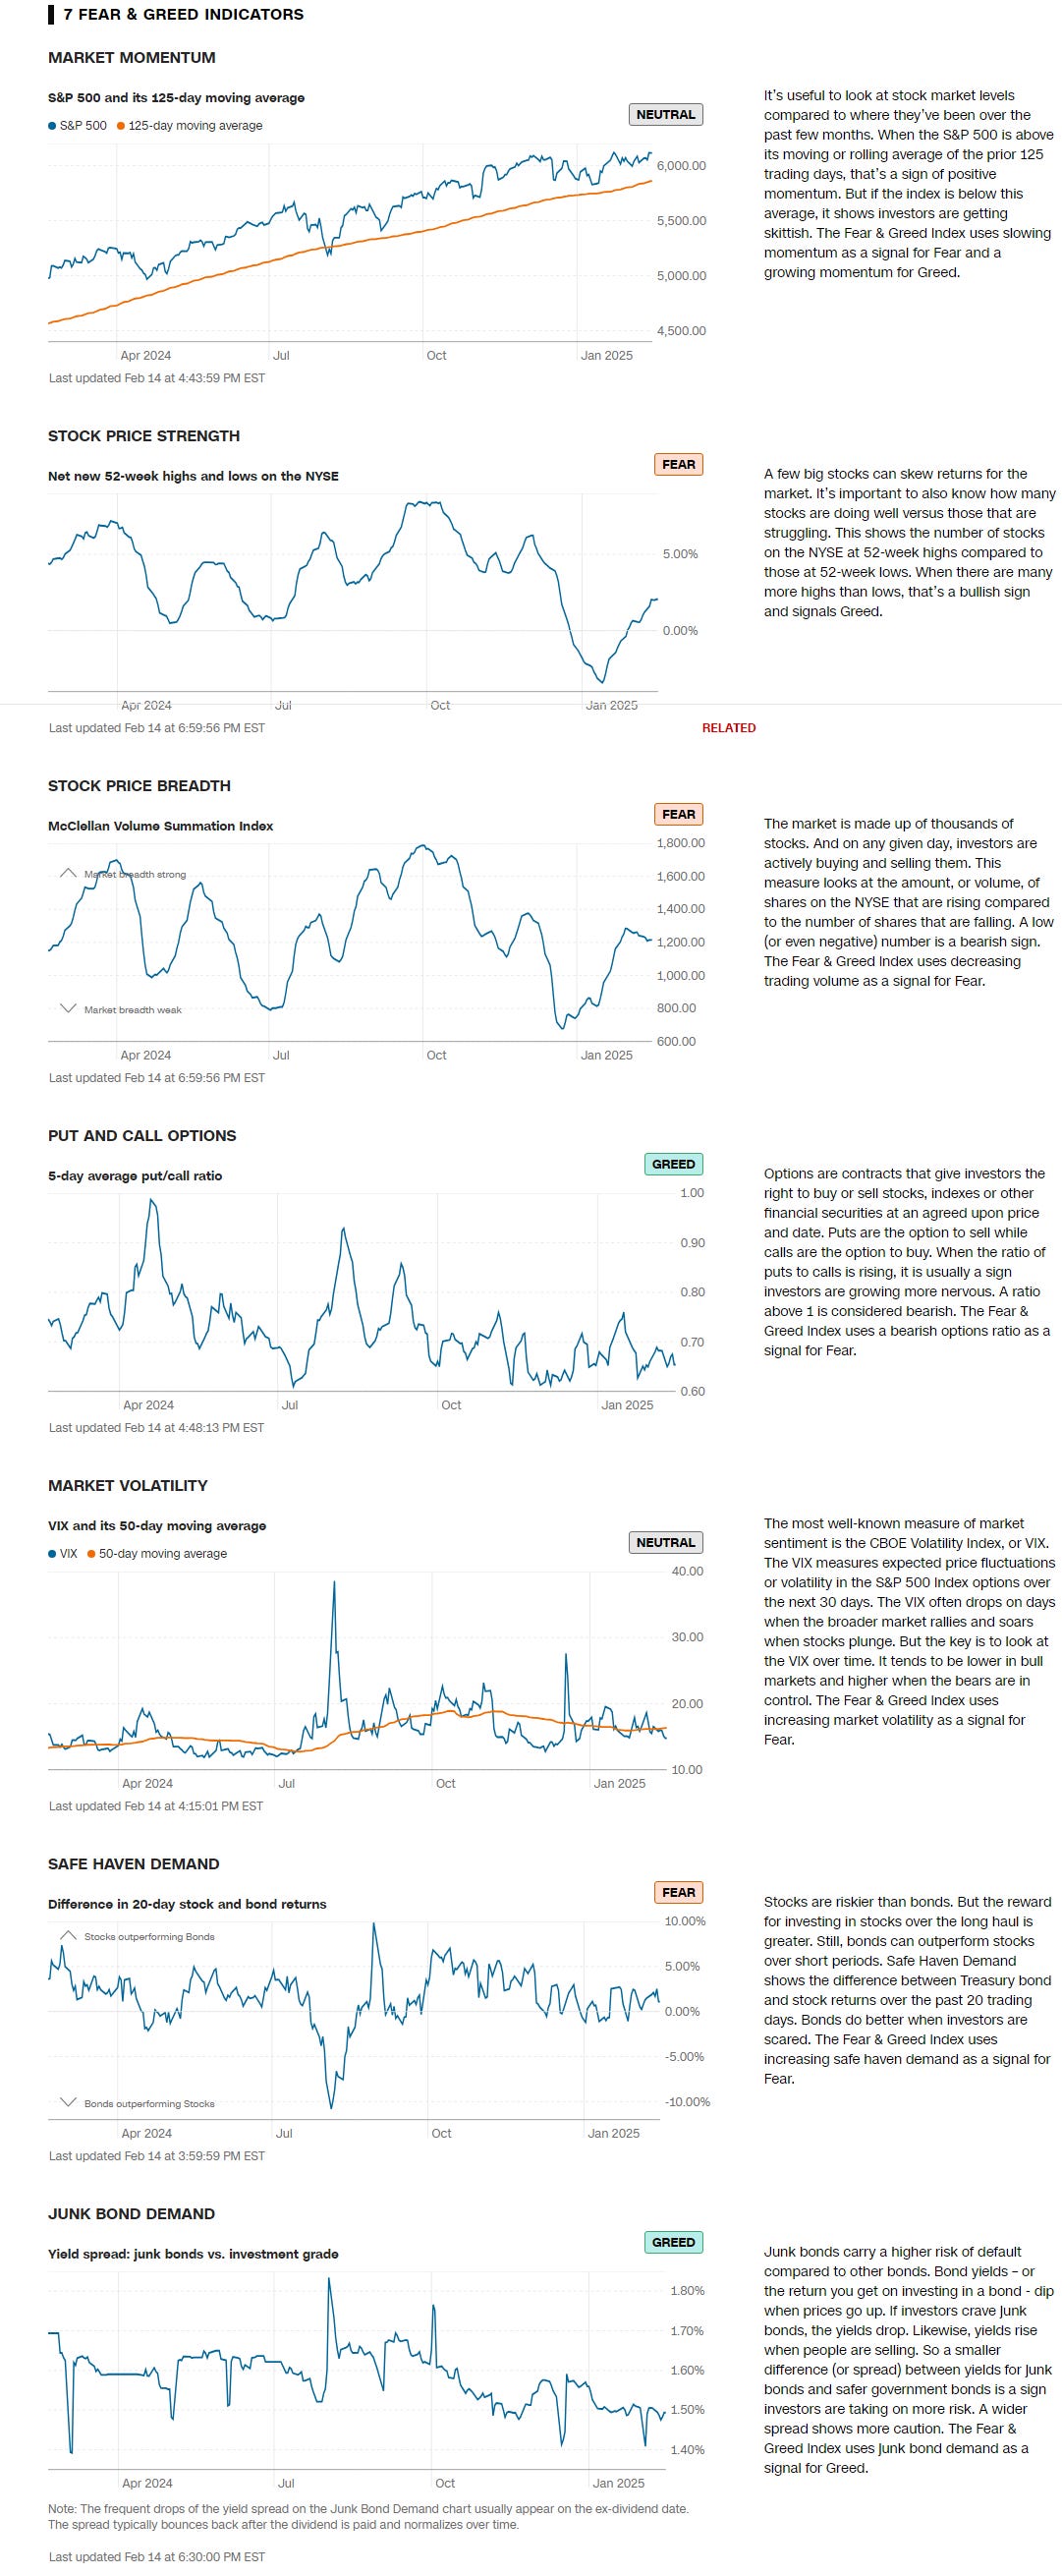
CNN Fear & Greed Index edged higher +5pts w/w to 44 (it hit 47 Mon, the highest of the month), still in “Fear” but on the edge of “Neutral”. It was at 67 (“Greed”) a year ago.
Looking at the components:
Extreme Greed = None
Greed = 5-day put/call options (from Neutral); junk bond demand (from Neutral);
Neutral = market volatility (VIX & its 50-DMA); market momentum (SPX >125-DMA) (from Fear)
Fear = safe haven demand (20-day difference in stock/bond returns); stock price breadth (McClellan Volume Summation Index); stock price strength (net new 52-week highs) (from Extreme Fear)
Extreme Fear = None
https://www.cnn.com/markets/fear-and-greed

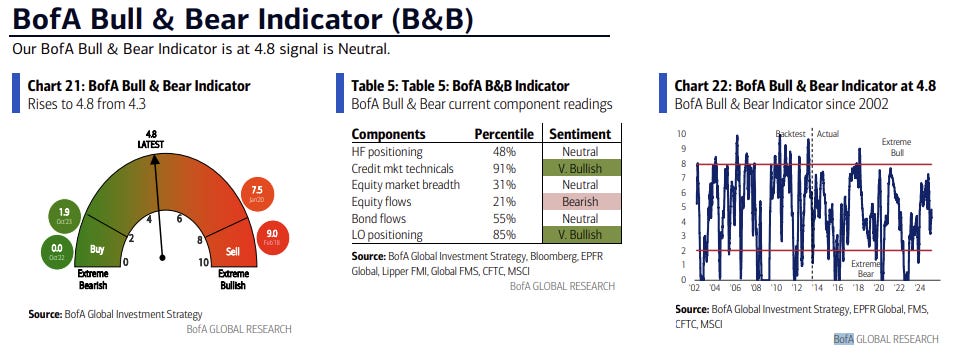
BofA’s Bull & Bear Indicator (a global metric), rose for a 6th wk (after falling for 12 straight), with the biggest jump in that time +0.5pts, now 4.8 ("Neutral"), up 1.6pts from 3.2 six weeks ago which was nearly a 1-yr low, “driven by improving global stock index breadth, inflows to HY bonds, low BofA Global FMS cash level, very bullish credit market technicals.”
Helene Meisler's followers broke their 3-wk bearish streak (which was the longest streak since June), with 61.4% voting next 100pts up from 42.1% the prior week. As with most sentiment polls, this one doesn’t tell you much in the middle, but an analysis done by @SPYSTSignals shows that <45% and >60% results have led to better than median returns in the SPX.
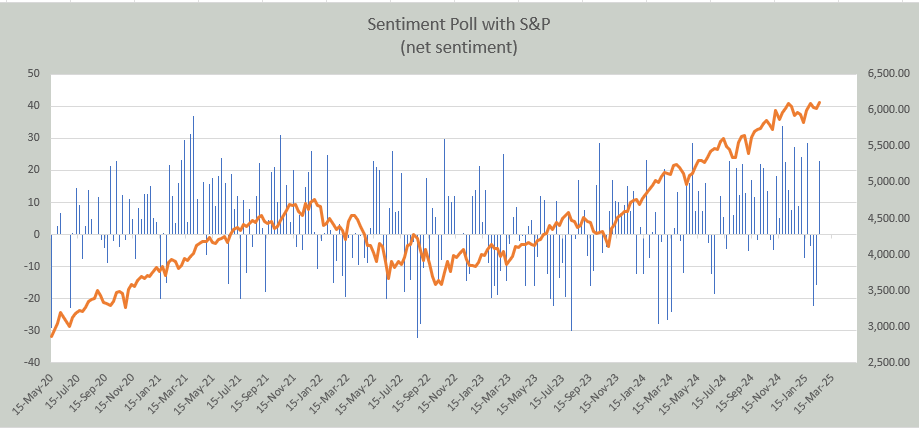

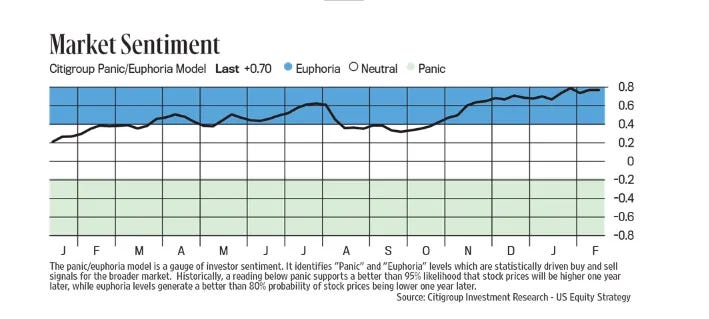
Link to Helene’s always insightful Saturday Chart Fest. Note it normally includes Citi’s Panic/Euphoria Index which after edging off the highest in the past year+ at the beginning of the month is right back up there remaining firmly in Euphoria.
As a reminder, “[h]istorically...euphoria levels generate a better than 80% of stock probabilities being lower one year later.” In that regard, it first entered euphoria in late March (when the SPX was around 5200) and then reentered in late October (around 5800).
5200 would be a drop of -15% by late March. Could happen I suppose.
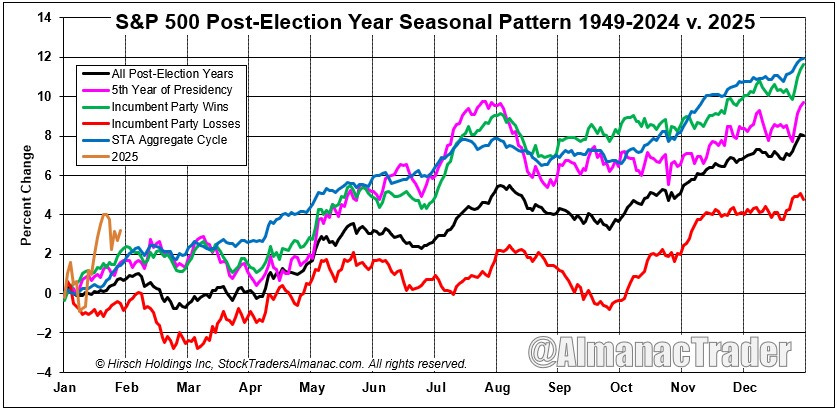
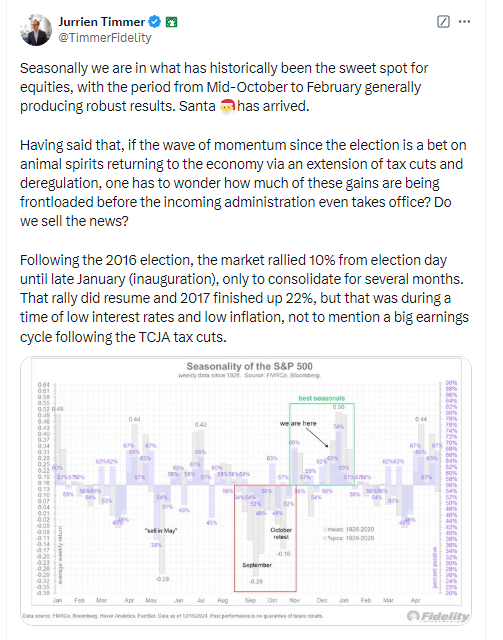
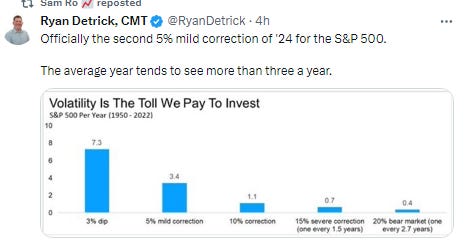
Seasonality
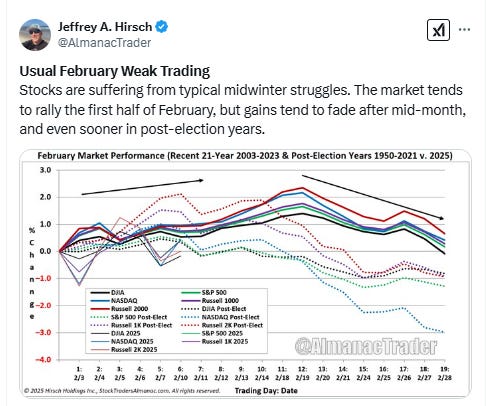
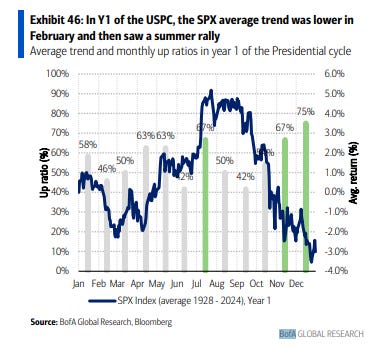
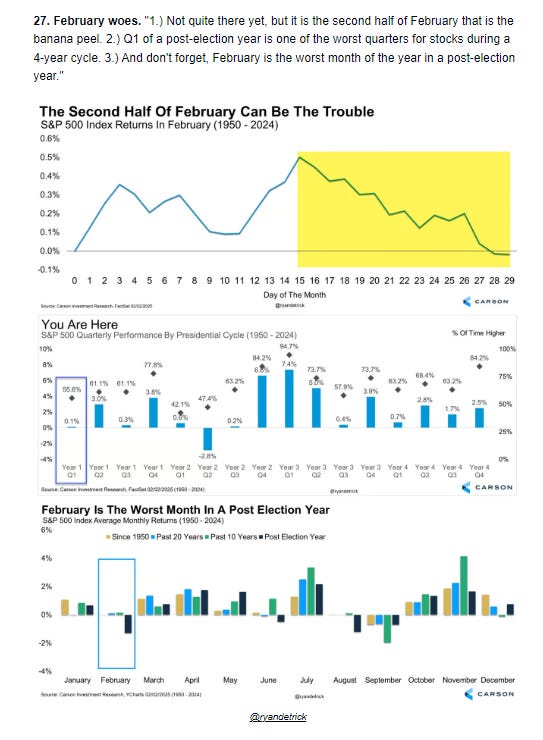
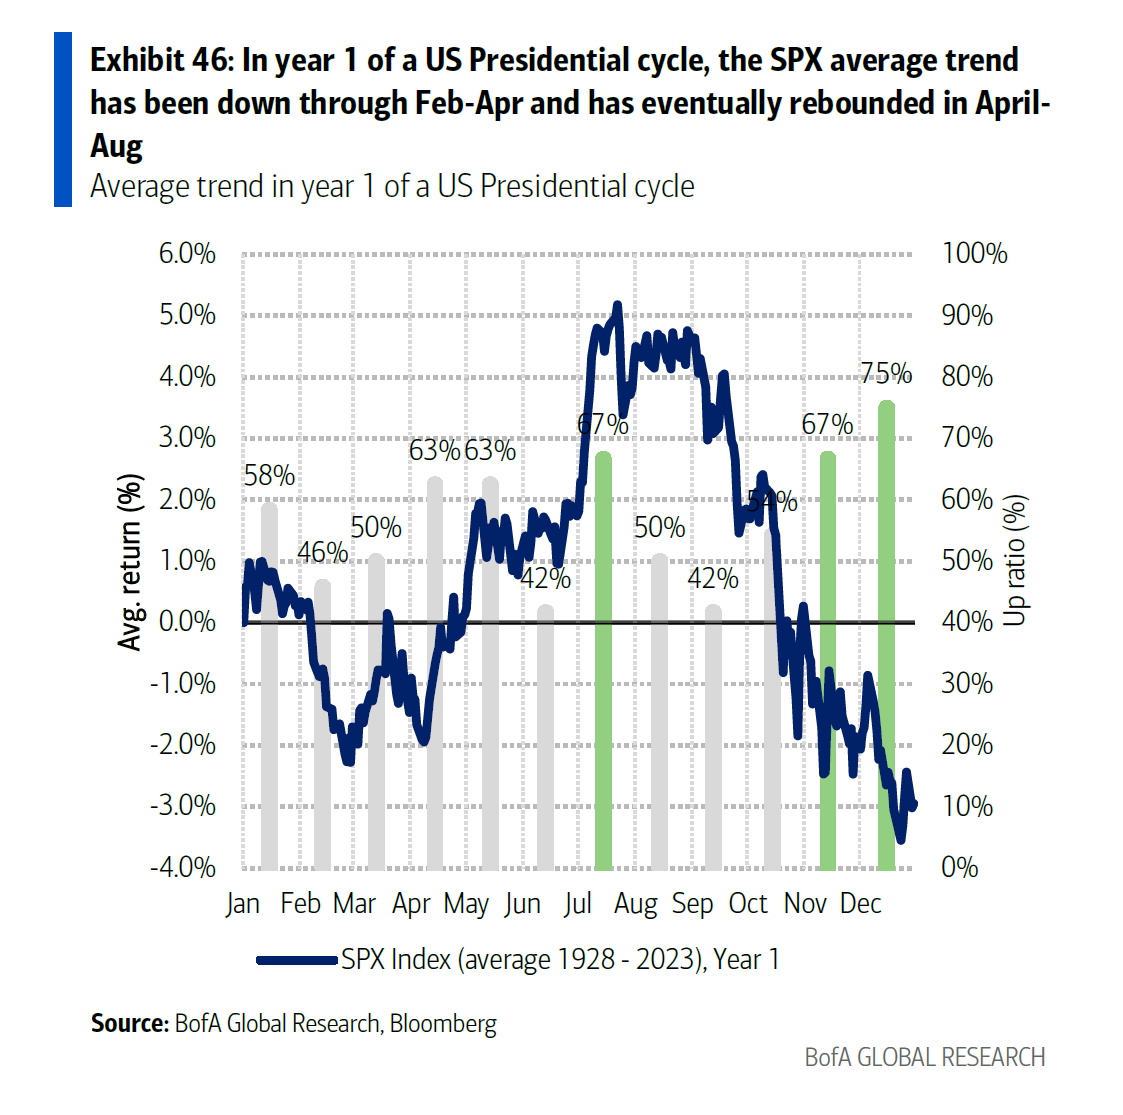
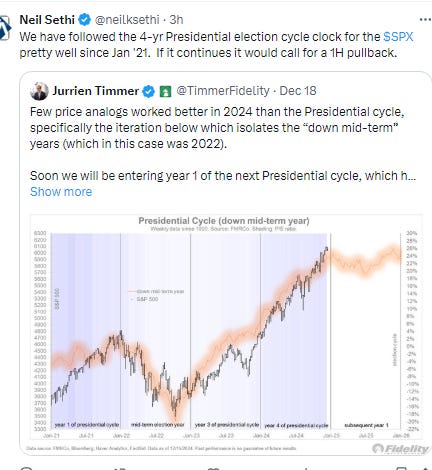
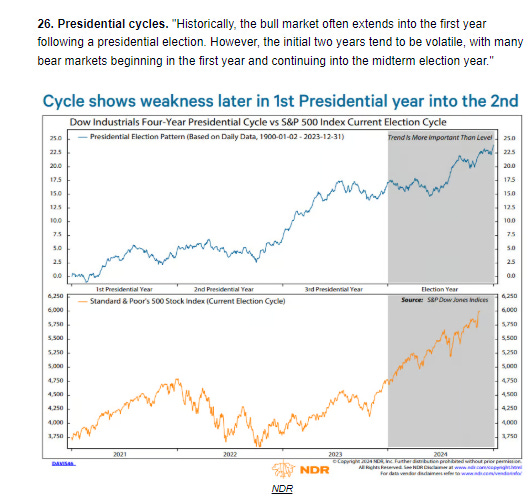
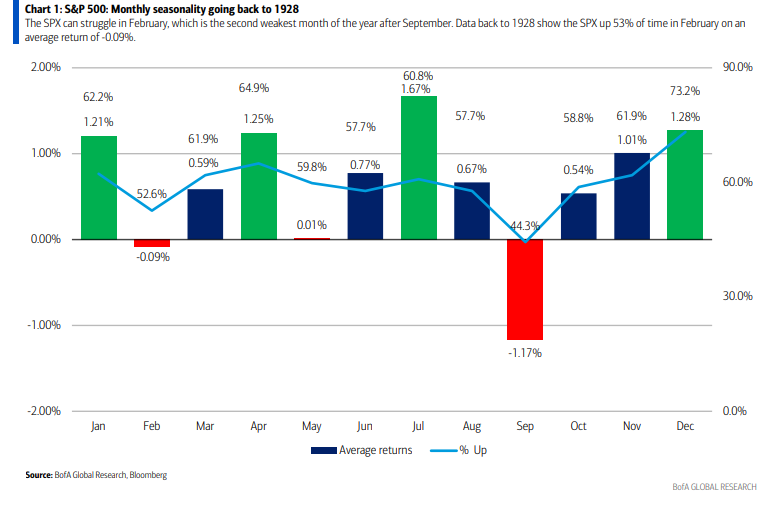
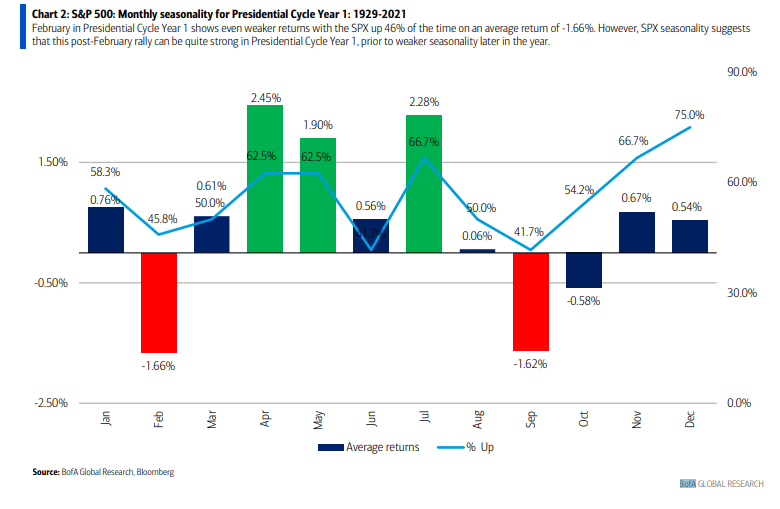
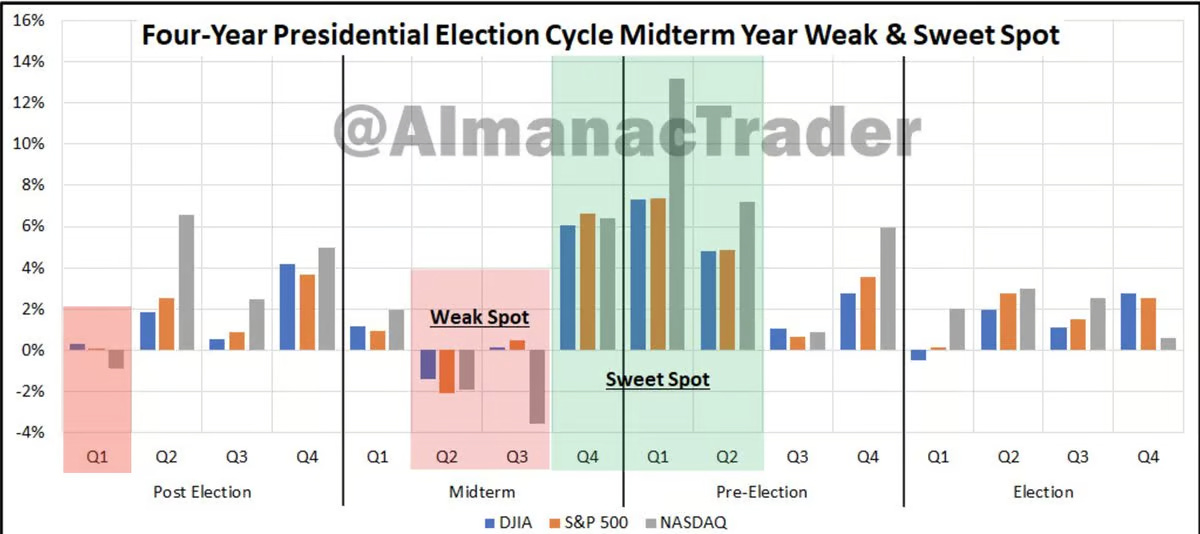
As noted two weeks ago, “as we move into February, we enter one of the weakest, if not the weakest, months for seasonality in the 4-yr presidential cycle (Feb of Yr 1). But we did have an up January at least, which bodes well for the full year. On average though February is only up 46% of the time historically with a -2.1% average loss for the month in Pres yr 1 (and it’s not much better for an average February). Note much of the weakness is backloaded.” And so now we enter that “backloaded” weakness. So based just on seasonality, things should be weak through the end of the month.
Of course, as always remember that seasonality is like climate. It gives you an idea of what generally happens, but it is not something to base your decision on whether to bring an umbrella (as the Santa Rally showed us).
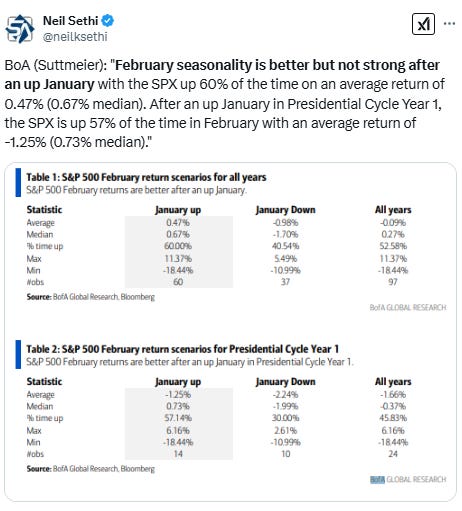
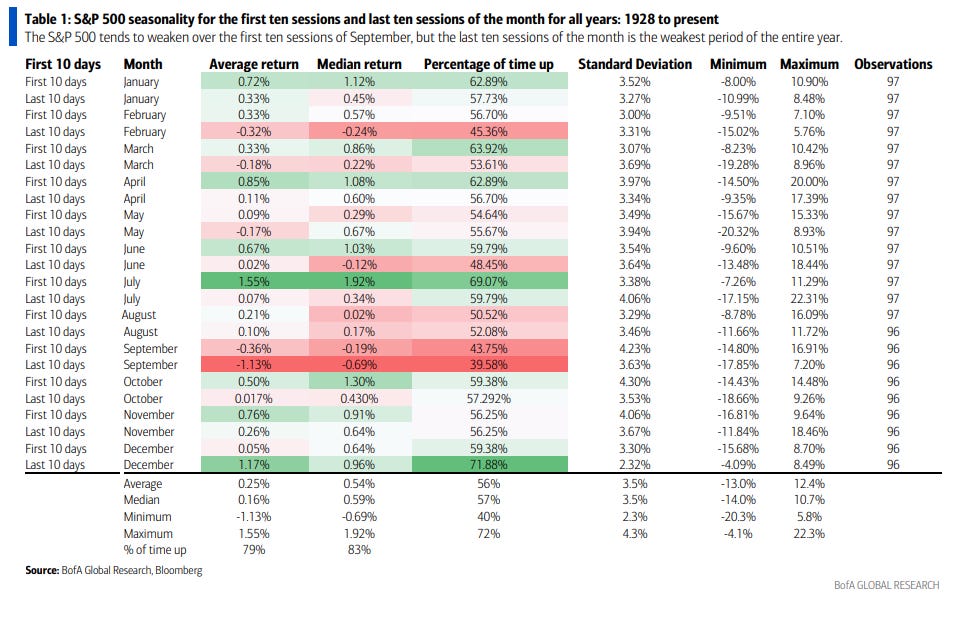
BoA (Ciana): "In Y1 of the US Presidential Cycle, the average trend is lower through February, basing in March and a summer rally" Feb in USPC Y1 is one of the weakest months of the cycle, up just 46% of the time w/an avg return of -2.1%.
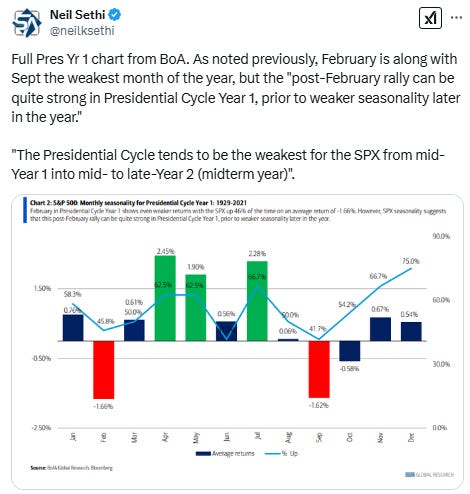
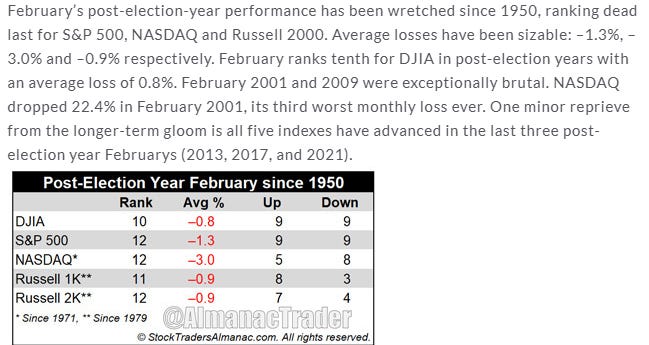
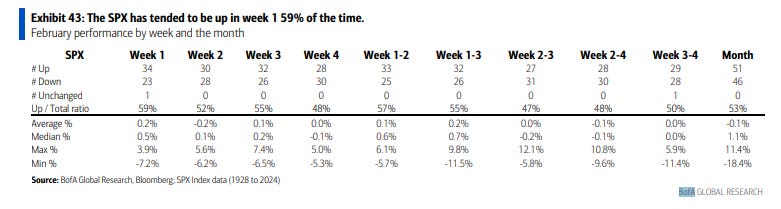
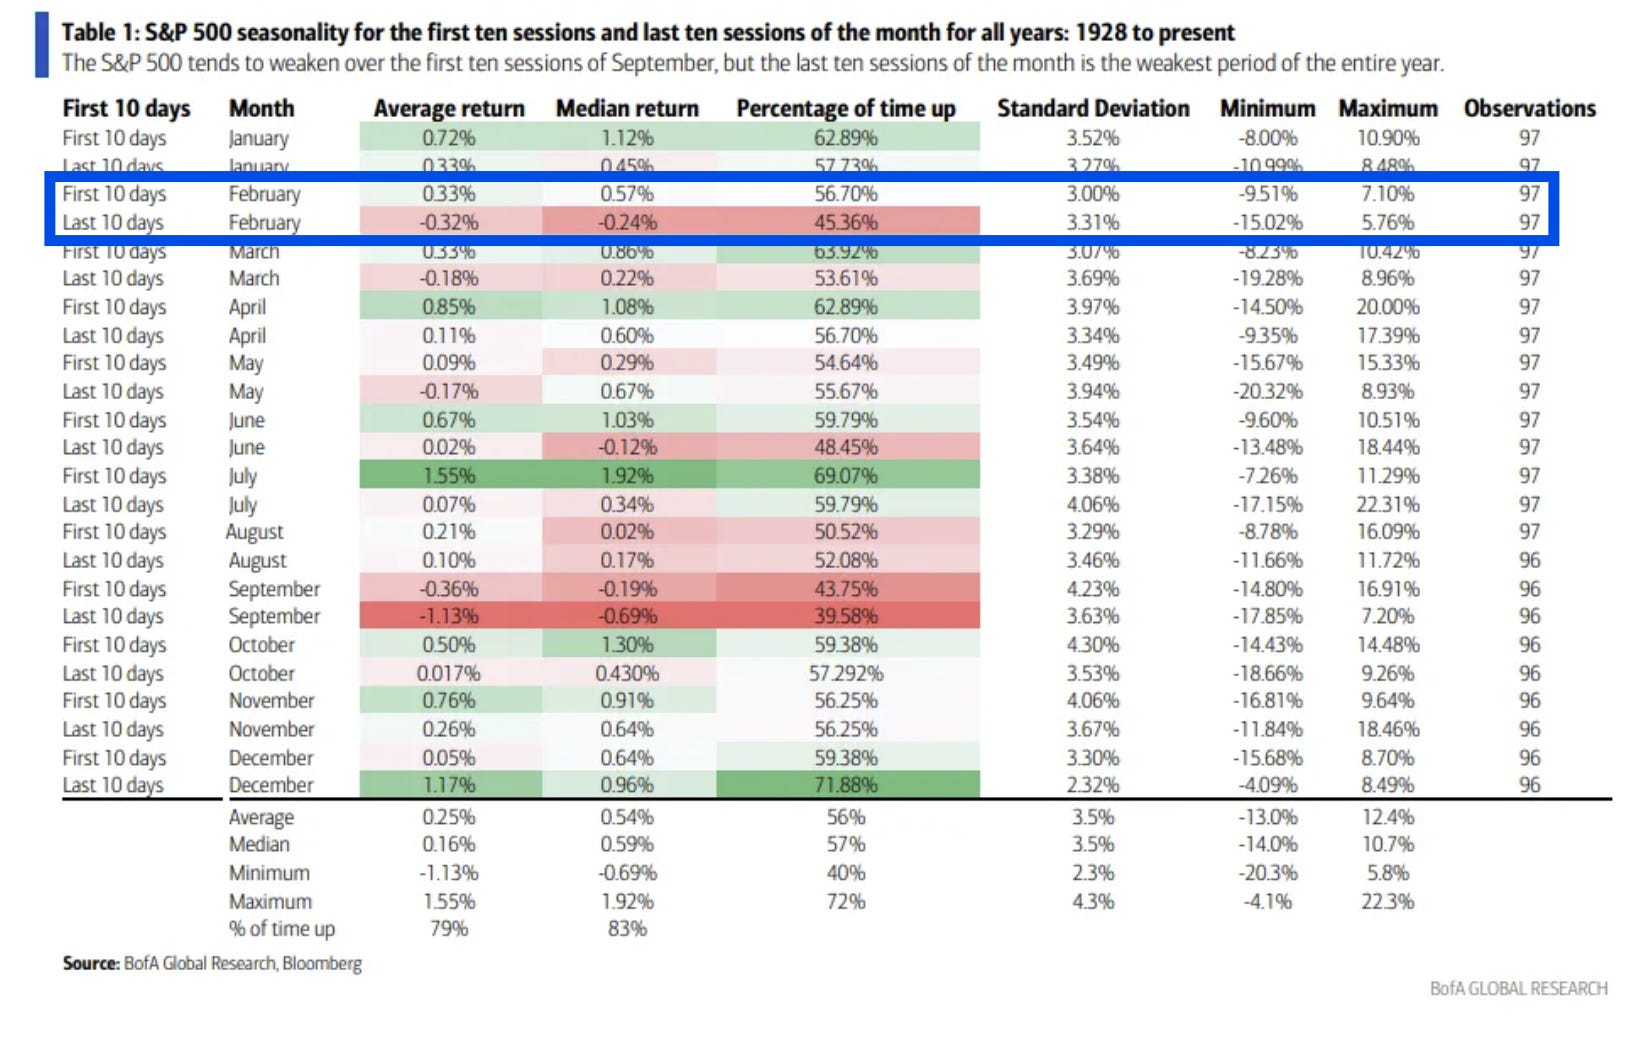
BoA: Since 1928, first 10 days of Feb not bad w/avg return of +0.33% and median of +0.57%, up 57% of the time w/the 2nd lowest standard deviation (after last 2wks of the yr). But last 10 days 3rd weakest of the yr w/-0.32% avg return and -0.24% median, up just 45% of the time.

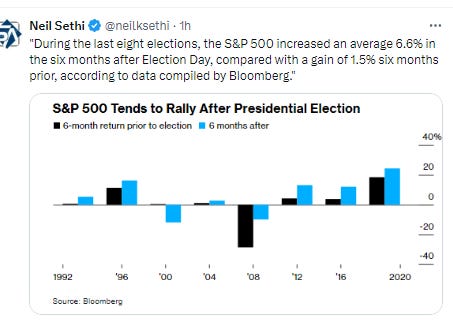
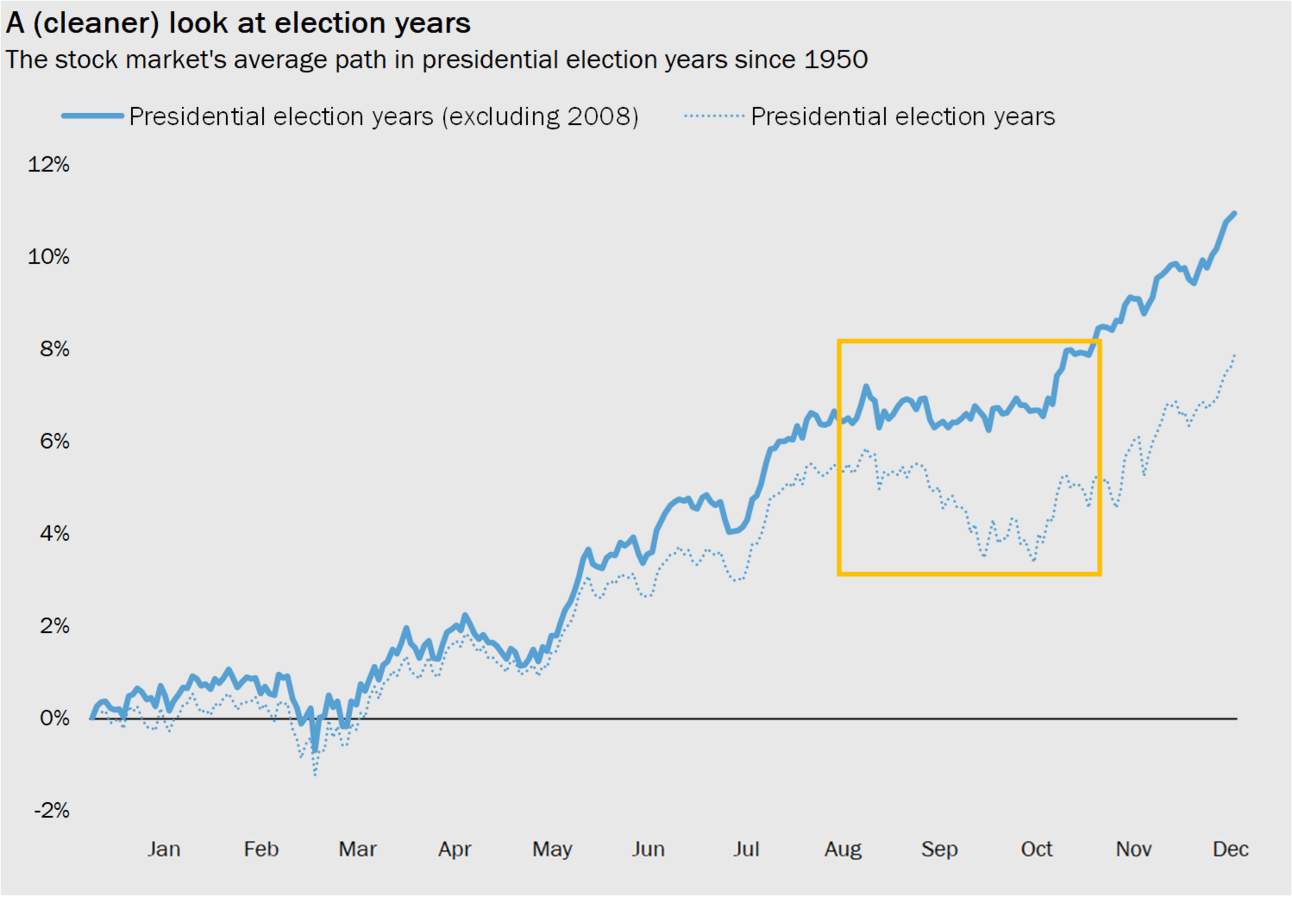
And as we consider seasonality, a really nice post from Callie Cox about how you need to take historical analogies w/a grain of salt (unless you've dug into the history). Her chart on Presidential election yr performance w/ & w/o 2008 (when the SPX was -17% in Oct) is a wonderful example.
https://www.optimisticallie.com/p/a-history-lesson
For references to all of the “up YTD through Feb” see the March 3rd post. For all the very positive stats through March (strong 1Q, strong two consec quarters, etc.) see the April 14h post.
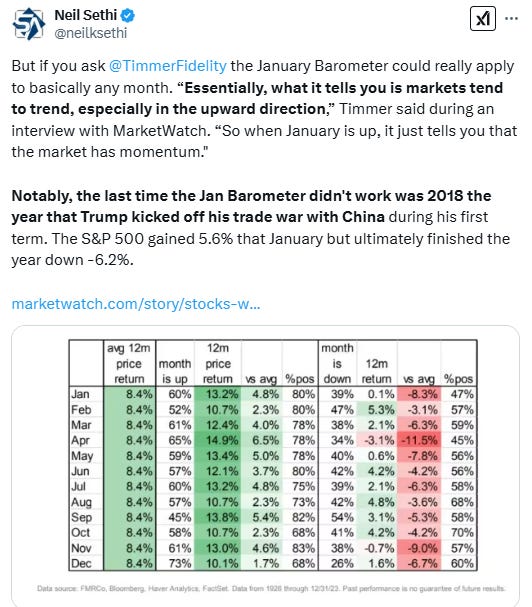
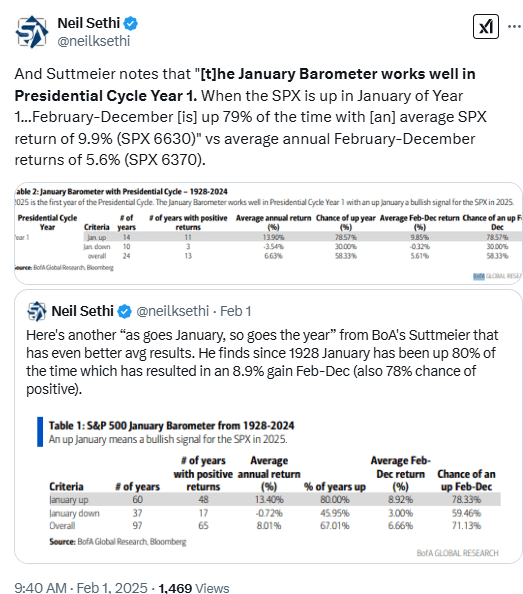
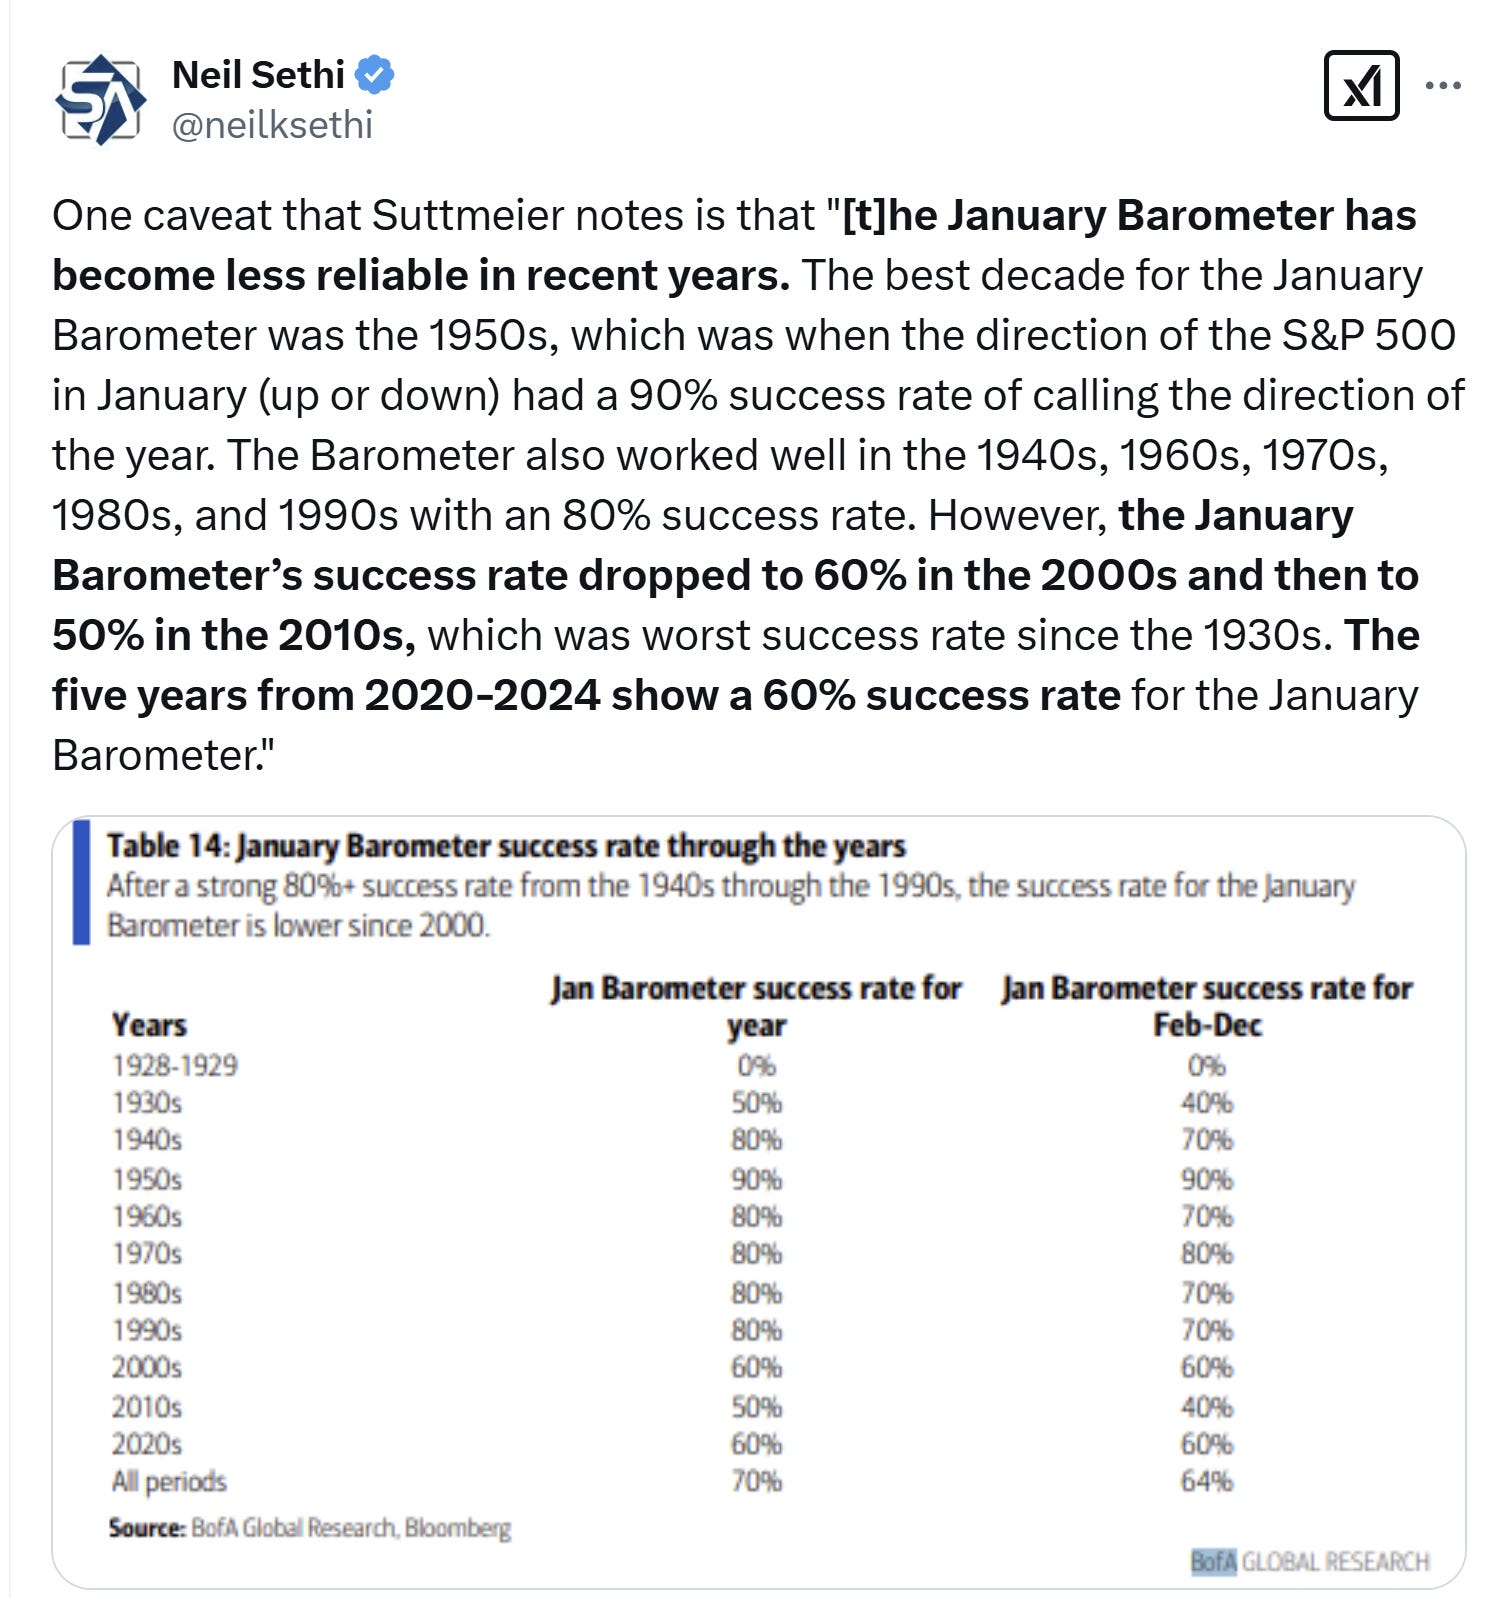
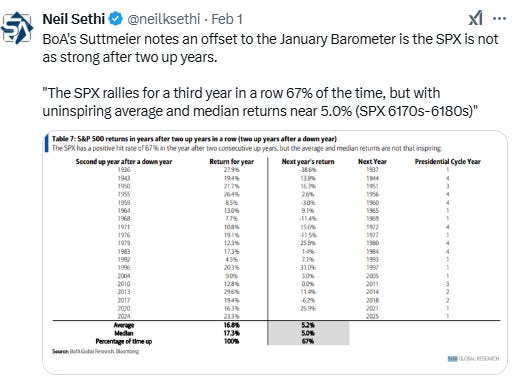
For the “as January goes so goes the year”, see the February 4th Week Ahead.
Final Thoughts
I noted at the start of the year,
As we turn the page into the new year, we’re presented with a very different backdrop than what we saw for much of 2024 when the Fed was moving from hiking to cutting, bond yields were falling, seasonality was mostly favorable, systematic positioning was mostly a tailwind, political risk was low, valuations had room to grow, liquidity was very robust, the economy was firing on all cylinders, volatility (until early August) was more subdued, earnings were rebounding, etc.
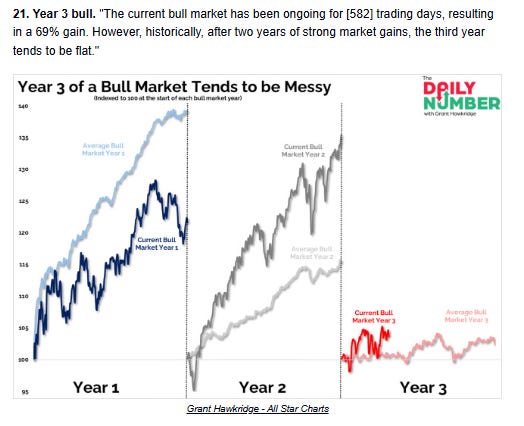
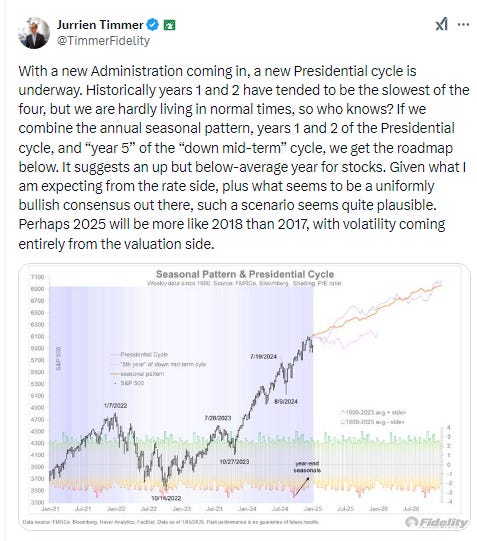
Now we’re in what is historically a more challenging year (1st year of a Presidential term and 3rd year of a bull market following two 20% years) with valuations well above where we started 2024, high expectations (judging from analyst SPX forecasts), higher volatility and political risk…higher bond yields (particularly real yields), a Fed talking more about fewer than more cuts and continuing to drain liquidity that is now hitting levels we’ve run into issues in the past, high earnings expectations, etc.
It doesn’t mean that we can’t have a good or even a great year. Balance sheets remain very solid as does the economy and labor markets (even if slowing), earnings are expected to be very good, buybacks are expected to be a continued tailwind, there’s a lot of scope for the Fed to become less hawkish, the upcoming administration may provide big tailwinds in tax cuts, deregulation, etc., etc. But we need to see at least some of those come through, and disappointments are not going to be welcomed given the set-up, so my expectation is for choppier markets more like we’ve seen since October than what we saw before.
And as noted in previous weeks that’s mostly what we’ve seen since then (some upside but it’s been very choppy with a lot more volatility and headline risk). The year so far has been “chock full of catalysts,” as I noted the last week of January between earnings (which we seem to be navigating pretty well although 2025 expectations continue to come down more than is typical), what comes out of the incoming Trump administration (which we continue to be in the teeth of (and it seems will be for the foreseeable future)), the Fed (who has become though less important with both the chance of cuts and hikes in the near term low), and economic data (which on balance has been supportive).
Valuations are back towards recent highs for the SPX, and breadth continues to remain pretty poor, but buybacks continue to be robust, and are one of the major underpinnings to the market, while systematic positioning has been increasing as well. Retail (a smaller buyer) has been an added boost. The week ahead as noted at the top is low on catalysts outside of Washington, so we’ll just have to see what comes out on that front, but it seems like they might be starting to dial things back a bit after some initial policies have seen some unexpected consequences that have not gone over well with portions of the Republican base, and resistance is starting to grow. I think a more targeted approach from the White House would be another tailwind. Seasonality the next two weeks is weak, but outside of that and unexpected negative surprises from the White House, the other tailwinds may continue to push us higher at least until the following week when we get another key catalyst in Nvidia earnings.
But as always just remember pullbacks/corrections are just part of the plan.

Portfolio Notes
I’ve decided to clean up the portfolio, trying to take it down to 50 (or hopefully fewer) positions to force me to stick with only my highest convictions (and make life simpler).
This week sold out of IMBBY, BIIB, VRSN, GD, ANF, BIIB. Trimmed AGNC, SAN, TCEHY, TLT, GPN, E, VWAPY, CVS, BXMT, ARE, DOC, LYG, KHC, MRNA, CPER, BMY.
Bought NVDA, DDOG (new), CCJ, FCX, ADBE, GOLD, OWL, AMZN, EA, MDLZ (new)
Cash = 30% (held mostly in SGOV, MINT & BOXX (BOXX mimics SGOV but no dividend, all capital appreciation so get long term capital gains if you hold for a year) but also some non-TBill (>1yr duration) Treasury ETF’s (if you exclude those longer duration TBill ETF’s, cash is around 11%)).
Positions (after around the top 20 I don’t keep track of their order on a frequent basis as they’re all less than 0.5% of my portfolio).
Core positions (each 5% or more of portfolio (first 2 around 10% each, total around 25%) Note the core of my portfolio is energy infrastructure, specifically petroleum focused pipelines (weighted towards MLP’s due to the tax advantages). If you want to know more about reasons to own pipeline companies here are a couple of starter articles, but I’m happy to answer questions or steer you in the right direction. https://finance.yahoo.com/news/pipeline-stocks-101-investor-guide-000940473.html; https://www.globalxetfs.com/energy-mlp-insights-u-s-midstream-pipelines-are-still-attractive-and-can-benefit-from-global-catalysts/)
EPD, ET, PAA, SHY
Secondary core positions (each at least 2% of portfolio)
ENB
For the rest I’ll split based on how I think about them (these are all less than 2% of the portfolio each)
High quality, high conviction (long term), roughly in order of sizing
ENB, CTRA, GILD, GOOGL, PYPL, SCHW, PFE, ARCC, AM, TRP, T, XOM, SHEL, JWN, CVS, TLH, FSK, TFC, NTR, GSK, EQNR, CMCSA, TLT, APA, DVN, OXY, RRC, JWN, RHHBY, E, ING, VZ, VSS, VNOM, SLB, MPLX, BTI, KMI, VOD, CVX, ING, O, KHC, ADNT, STLA, NEM, CCJ, AES, BWA, BMY, HBAN, VICI, DGS, ADNT, WES, MPLX, CVE, MTB, BAYRY, SOFI, BEP, SAN, TEF, SCHD, KVUE, KT, SQM, ALB, KIM, F, MAC, MFC, GPN, CI, LYG, ORCC, LVMUY, EMN, NVDA, BCE, KEY, OCSL, GBDC, SNOW, MDLZ, DDOG, RTX, PANW, ETSY, BAC, UPS, EA, SIG, BUD, VALE, BAX,
High quality, less conviction due to valuation
Higher risk due to business or sector issues; own due to depressed valuation or long term growth potential (secular tailwinds), but at this point I am looking to scale out of these names on strength. These are generally smaller positions.
FXI, LADR, AGNC, URNM, URA, STWD, PARA, CFG, YUMC, ORAN, KSS, CHWY, ILMN, TIGO, TCNNF, TCEHY, JD, WBA, ACCO, KVUE, KLG, CLB, HBI, IBIT, UNG, EEMV, SABR, NSANY, VNQI, ST, SLV, WBD, BNS, EWS, IJS, NOK, SIL, CURLF, WVFC, VTRS, NYCB, ABEV, PEAK, LBTYK, RBGLY, LAC, CMP, CZR, BBWI, LAC, EWZ, CPER, MBUU, HRTX, MSOS, SIRI, M, CE,
Note: CQP, EPD, ET, MPLX, PAA, WES all issue K-1s (PAGP is the same as PAA but with a 1099).
Reminder: I am generally a long term investor (12+ month horizon) but about 20% of my portfolio is more short term oriented (just looking for a retracement of a big move for example). This is probably a little more given the current environment. I do like to get paid while I wait though so I am a sucker for a good well supported dividend. I also supplement that with selling calls and puts. When I sell a stock, I almost always use a 1-2% trailstop. If you don’t know what that is, you can look it up on investopedia. But that allows me to continue to participate in a move if it just keeps going. Sometimes those don’t sell for days. When I sell calls or puts I go out 30-60 days and look to buy back at half price. Rather than monitor them I just put in a GTC order at the half price mark.
To subscribe to these summaries, click below (it’s free).
To invite others to check it out,
A lot od useful info, thanks so much! ;)