


The Week Ahead - 6/29/25
A comprehensive look at the upcoming week for US economics, equities and fixed income

If you're a new reader or maybe one who doesn’t make it to the end feel free to take a second to subscribe now. It’s free!
Or please take a moment to invite others who might be interested to check it out.
Also please note that I do often add to or tweak items after first publishing, so it’s always safest to read it from the website where it will have any updates.
As a reminder, some things I leave in from prior weeks for reference purposes, because it’s in-between updates, it provides background information, etc.. Anything not updated this week is in italics. As always apologize for typos, errors, etc., as there’s a lot here, and I don’t really have time to do a thorough double-check.
For new subscribers, this is a relatively long post. The intent is to cover the same areas each week. Sometimes the various areas are more interesting, sometimes less, but it’s easier just to go through them all, so you can expect this format (with things in the same places) each week.
The main sections are intended to cover 1) what’s upcoming next week, 2) what the Fed and rates are up to, 3) what’s going on with earnings (which along with valuations are the most important determinants to stock prices over the long term), 4) what’s going on with the economy (both because of its impact on our daily lives (I am a business investor in my “real” job) but also because it impacts earnings), 5) valuations, 6) breadth (which gets into sector/style performance), 7) positioning/flows (this is the most important determinant to asset price changes in the short term), 8) sentiment (really only matters at extremes though), 9) seasonality (gives you an idea of what normally happens), 10) “Final Thoughts” (remember you get what you pay for there, and it’s the last thing I do so it often is a bit rushed), and 11) my portfolio (to be transparent about where my money is in the market (but note first it is most definitely not intended as financial advice, and second as I mentioned earlier my main job (and investing assets) are in private industries (RE & venture capital)) so my portfolio is built with that in mind (i.e., it’s not how I pay the day-to-day bills)).
The Week Ahead
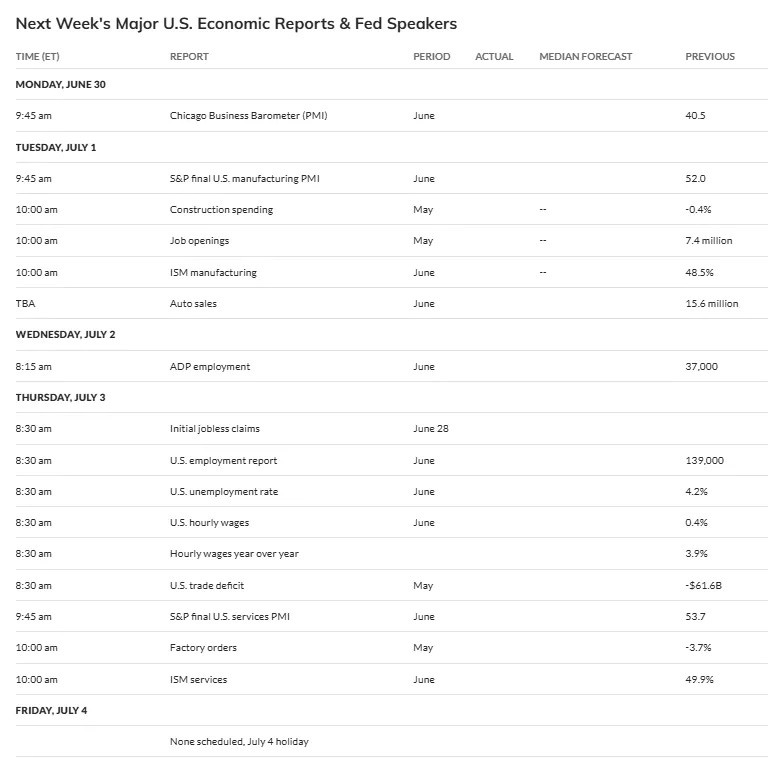
The upcoming week is another shortened by a holiday in the US, but this time a more traditional Friday. It’s also though the first week of the month which brings us all our standard first week US economic reports including NFP. But instead of spreading them evenly throughout the already shortened week, they’re mostly jammed into Tuesday and Thursday with the latter (Thursday) a particularly busy day that includes NFP (expectations are for 110k on the payrolls number) in addition to jobless claims, the trade deficit, factory orders, and services PMIs.
Tuesday brings us manufacturing PMIs, JOLTS, and construction spending, Wednesday ADP and Challenger job cuts.
We’ll also get the standard weekly reports (jobless claims, mortgage applications, and petroleum and nat gas inventories) on the standard days.
Fed calendar is currently light, but I’m sure there will be more appearances than what is listed. The highlight is a panel discussion Tuesday at an ECB conference with Powell (Fed), along with Lagarde (ECB), Bailey (BoE) and Ueda (BoJ)). Currently there are no other Fed Governors (generally considered more influential with 14-yr terms who vote every year) on the calendar, and the only regional Fed Presidents (who serve 5-yr terms (up to 10 yrs) and vote on a rotating schedule (except the NY Fed Pres (Williams) who votes every year) are Bostic (twice) and Goolsbee (who we’ve heard from a half dozen times the past two weeks). Goolsbee is a voter this year, Bostic in 2027.
Treasury auctions also light with no non-Bill (>1yr) notes or bonds.
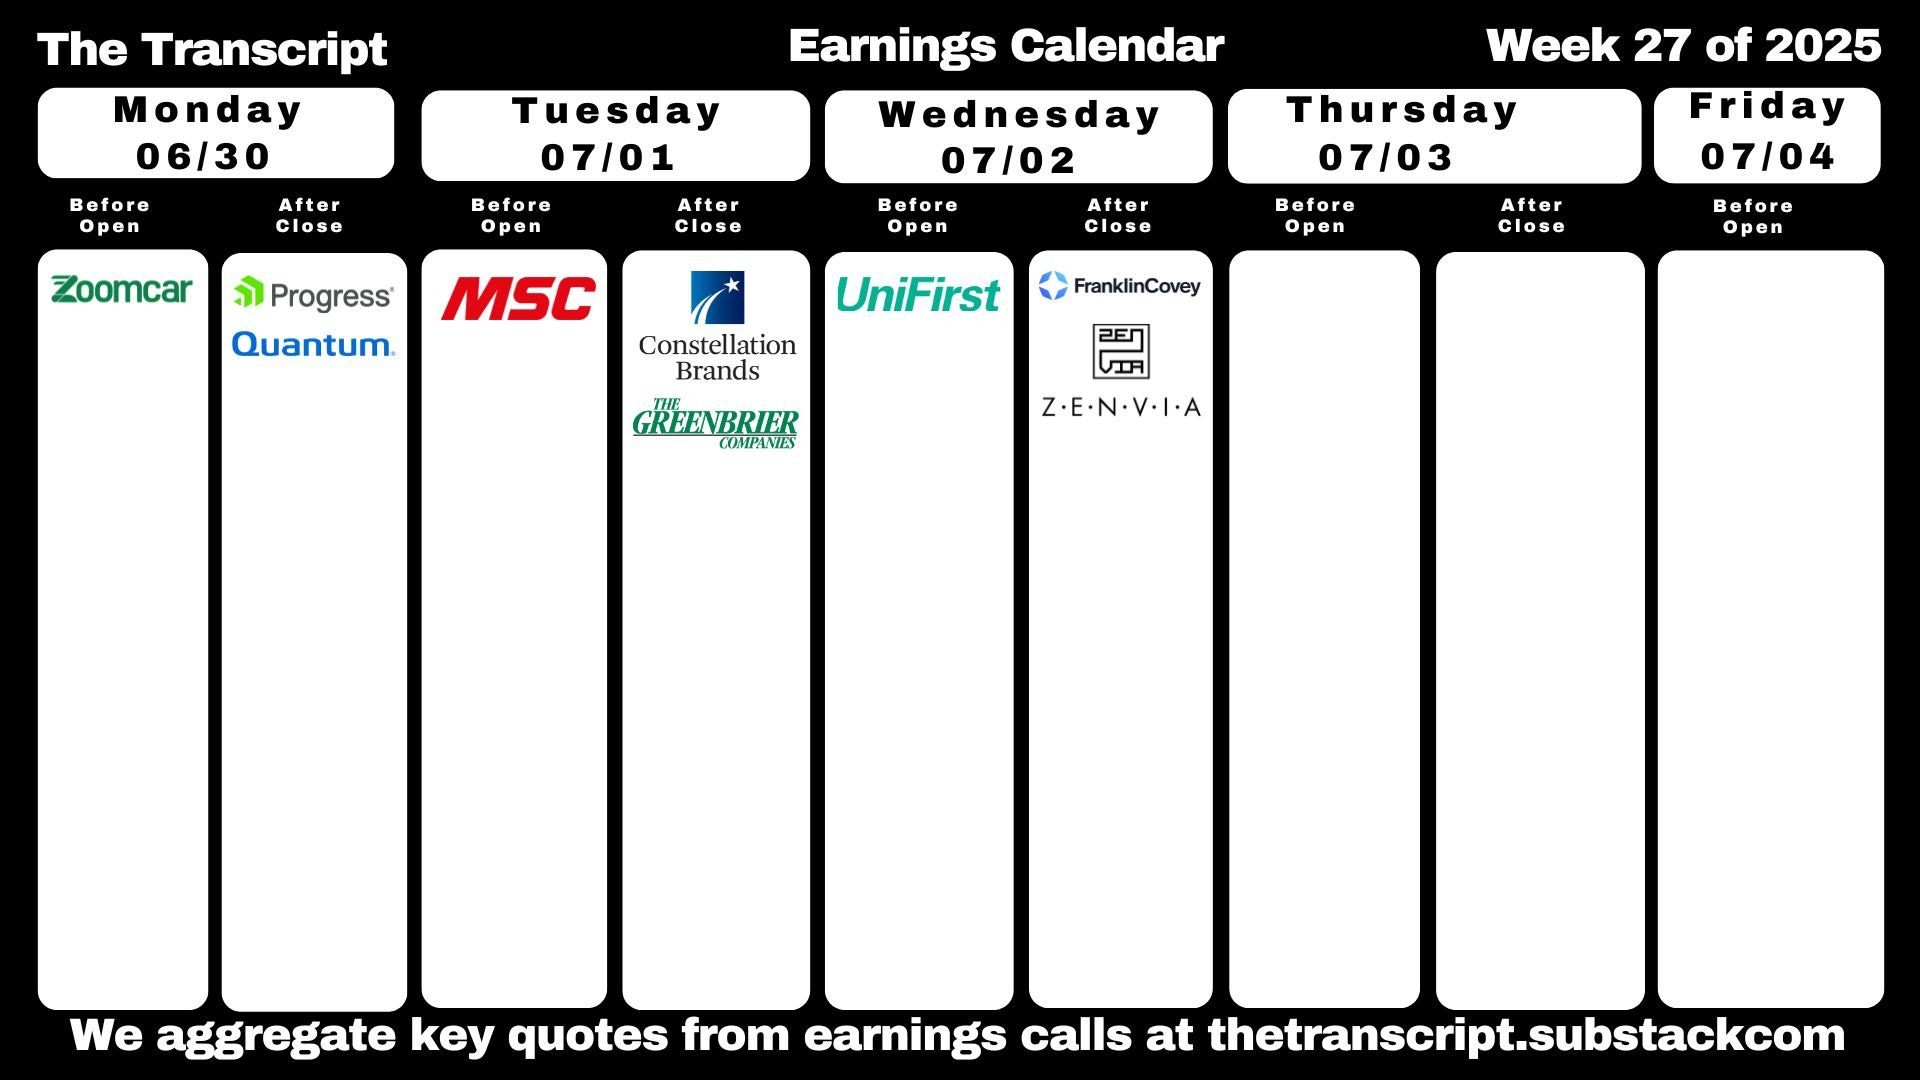
Earnings about as light as it gets just one SPX component reporting in Constellation Brands (STZ) on Tuesday. They’ll pick up the following week as we get further into 2Q results.
But of course there will be plenty going on in Washington to keep us occupied. Congress will be feverishly trying to get the OBBBA tax bill jammed through, and we will see what comes of this most recent tariff broadside from Pres Trump at Canada. There may be other trade agreements announced as well, as we are just 10 days away from the July 9th expiration of the 90-day reciprocal tariff pause at which time those rates “spring back” into effect. So unless Trump doesn’t want that, he has to announce something by then. In addition, according to Scott Bessent there are 10 or so deals that are expected to be announced by then, so you’d think we should start seeing those.


Note earnings date listed listed is one day in advance for some reason. From WallStNumbers.com.


Ex-US a less busy week with highlights global PMIs, Canada trade numbers, the BoJ’s Tankan survey of firms, industrial output and/or trade reports from a number of Asian countries. No major central bank decisions this week, but we’ll get minutes from some (ECB and Columbia). We’ll also get the ECB’s annual gathering in Sintra where we’ll likely hear from every member (as well as many other central bankers including Powell (Fed), Bailey (BoE), and Ueda (BoJ)), and they will announce the results of their strategy review (they’ll also be out at another gathering in Aix-en-Provence in France this week (how do I get this job?)).
Canada
Canadian goods trade data for May will probably show a continued sharp decline in US exports, with shipments to other countries rising but not offsetting the loss of access to the American market. The first payments of Canada’s digital services tax are due Monday, hitting major US tech firms with a 3% levy on their revenue from Canadian users above C$20 million. Trump cited the tax as the reason for the US ending trade talks with Canada on Friday.
Asia
The week in Asia features a number of PMI reports that will shed light on how regional economies are coping with elevated US tariffs. China gets a pair of PMI releases, with the official gauge Monday expected to show that manufacturing activity remained contractionary for a third straight month in June as persistent deflation on top of trade tensions weighed on activity. The next day sees the release of PMI figures for South Korea, Malaysia, the Philippines, Indonesia, Thailand, Vietnam, Taiwan and China’s Caixin gauge. The BOJ’s Tankan survey, also on Tuesday, is forecast to show that large companies plan to boost capital investment by 10% this fiscal year. Business sentiment among large manufacturers is expected to stay relatively upbeat, albeit at a lower level, while the gauge for non-manufacturers is seen staying close to the 34-year high set in the previous period.
May trade reports are due during the week from Australia, Indonesia, Thailand and Sri Lanka, while South Korea reports those figures for June. South Korea also publishes consumer price statistics for June that may keep the Bank of Korea on track for another rate cut. Indonesia June CPI is also due. Industrial output figures from South Korea, India and Japan, and Japanese household spending data will bookend the week.
Europe, Middle East, Africa
Inflation numbers will draw attention in the euro zone. Data on Monday may show consumer-price growth picked up in Germany and Italy, though not enough to worry the ECB. For the region as a whole, economists anticipate an outcome of 2% the following day, exactly at the goal targeted by policymakers. Other than price reports, clues on how the region’s manufacturing sector is faring amid Trump’s tariff squeeze will also emerge. German factory orders, along with French and Spanish industrial production, will be published on Friday.
Aside from its Sintra seminars, the ECB itself will offer plenty of other news. The results of its strategy review are due on Monday, followed by the institution’s own measure of inflation expectations the next day. On Thursday, an account of its June policy meeting will be released, revealing more on the decision to cut rates. Beyond Sintra, ECB officials will be out in force at another economic gathering later in the week in Aix-en-Provence, in southern France. On Monday, the Swiss National Bank will reveal how much foreign-exchange intervention it carried out during the first quarter. Switzerland’s latest inflation numbers are scheduled for Thursday and may also draw interest from traders focused on the franc. Economists anticipate that consumer prices fell from a year earlier for a second month in June.
In the UK, a full breakdown of gross domestic product for the first quarter will be published on Monday. Appearances by BOE Governor Andrew Bailey in Sintra and Aix-en-Provence will also be highlights. Away from Europe, South Africa’s Bureau for Economic Research will release its second-quarter inflation expectations survey on Wednesday. The report will be closely monitored by the central bank, which uses the two-year-ahead measure to inform its decisions. The bank aims to anchor expectations at the 4.5% midpoint of its target range, but is currently in discussions with the National Treasury to revise it lower. In Turkey on Thursday, annual inflation is forecast to slow slightly to 35.2% in June from 35.4% the prior month. That may persuade the central bank to lower its main policy rate by at least 300 basis points to 43%.
It’s a quieter week than usual for monetary decisions, but some are still on the diary:
In Ethiopia, policymakers will likely leave their rate unchanged at 15% on Monday as inflationary pressures begin to build because of subsidy reforms.
On Wednesday, the Polish central bank is likely to borrowing costs on hold, followed by Governor Adam Glapinski speaking at a news conference the next day.
Latin America
Argentina will publish activity data for April on Monday, with the result in focus after first-quarter growth data showed that the economy expanded significantly slower than expected early in 2025. Chile will follow with economic activity data for May on Tuesday, a reading that will follow weekend primary elections for center-left candidates hoping to succeed President Gabriel Boric in a race for the country’s top job later this year. The data also comes after Chile’s central bank kept its rate unchanged in mid-June, with policymakers saying that while domestic activity has exceeded expectations, they remain vigilant about an unpredictable global economy. The monetary authority will publish the minutes to that decision on Thursday, with analysts looking for clearer signals about when policymakers may start cutting rates after signaling that more monetary easing is coming. Later that day, Colombia’s central bank will publish minutes to its decision to hold rates steady on Friday. The Andean nation has been roiled in recent weeks by the government’s decision to suspend its fiscal rule, a move that along with a worsening debt burden led both S&P Global Ratings and Moody’s Ratings to downgrade the nation’s credit last week.
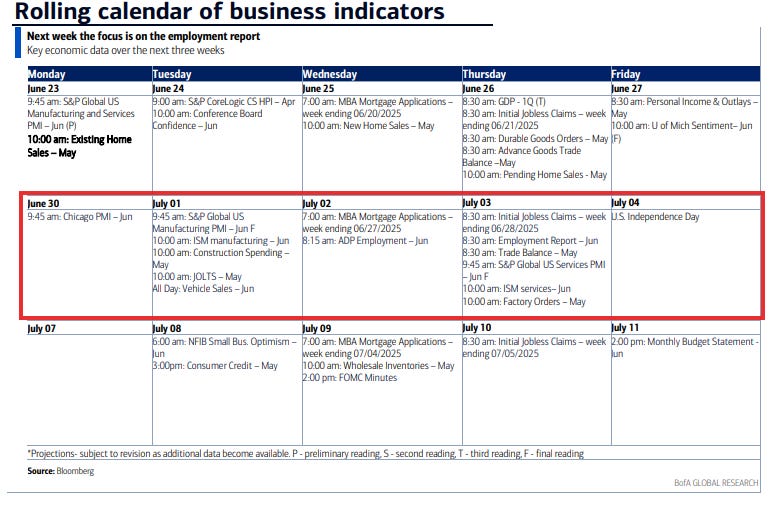
BoA’s cheat sheets for this week:


Day-by-day calendar from DB:

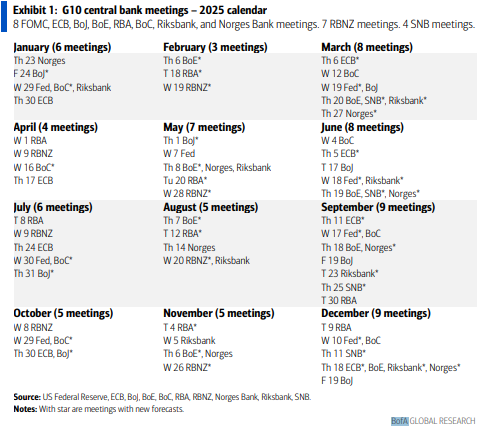
And here’s calendars of 2025 major central bank meetings.

Market Drivers
So let’s go through the list of items that I think are most important to the direction of equity markets:
Fed/Bonds
As noted previously this was one of the sections that had grown unwieldy, so I’ve really pared it down. Given I provide daily updates on Fed expectations, Fedspeak, and analyst thoughts on the Fed, it’s duplicative (and time consuming) to regather it all, so, again, I encourage you to look at those (the daily posts) for updates. I will just give more of a quick summary.
I’ve taken out the background information from how we got to where we were from the start of the year through the end of March, but if you’re interested you can find that in this section from the March 23rd update.
As I have been noting the month or so leading up to the June Fed meeting last week,
there have been some differences in how Fed members are looking forward, particularly into the second half. While many think there’s a low probability for rate cuts this year absent a serious deterioration in the labor market (regional Fed Presidents Schmid and Musalem have even talked about “leaning against” potential inflation consequences (i.e., putting rate hikes on the table (although Schmid was not so aggressive in his last appearance)) or perhaps a chance for one (Bostic), others are more constructive led by Governor Waller. Mary Daly continues to think two cuts are a “base case,” while Goolsbee is back looking for “much lower rates” in 10-16 months.
Another place there is some difference is in how Fed members think they should respond to a situation where inflation is sticky or increasing while the labor market is weak. As noted Schmid and Musalem, joined recently by Dallas Fed President Logan (not a voter this year) and Gov Kugler (who provided a very detailed analysis of her thinking (see the Friday update) would not be cutting, and NY Fed President Williams, a key voice, insinuated recently that in the event of a tradeoff between the Fed’s inflation and growth goals, they should pick fighting inflation.
So as I said six weeks ago,
it seems for now the markets probably have it right that the Fed is going to wait until we get deeper into the year and some of the “uncertainty” has hopefully passed (or at least we’ve had a longer run of time with tariffs in place) regardless of what happens with inflation (i.e., they are going to “look through” any cool prints for now). They also will look through high prints focusing on market-based measures of long term inflation expectations. The only thing it seems that would get them to move would be a deterioration in the labor markets.
But I noted three weeks ago:
I have a feeling if inflation continues to remain relatively subdued (it was basically at the 2% target in April (so Powell did get his “soft landing”)) that more members will climb on board. That said, there is certainly no rate cut coming at the meeting next week, and given we’ll only get one more set of inflation and NFP reports by July, it seems the market may be correct in September being the most likely next cut.
And this week we did see more members “climb on board” with Waller, most notably Michelle Bowman, although that was as much her “throwing her hat in the ring” as a potential Fed chair. And while Daly and Goolsbee continued their constructive tones seeing two rate cuts this year (and Kashkari (who is not a voter this year) did the same, a large contingent came out more hawkish led by Powell, although outside of the very hawkish wing (basically Schmid and Hammack who are clearly in the no cuts this year camp and perhaps Musalem) there has been a softening in the tone as Fed members “mark to market” their statements (i.e., inflation at least at the consumer level has remained tame).
I thought Powell did a better job this week (than at the June FOMC where I was critical of his performance) in his Congressional testimony in being more balanced and acknowledging that there was certainly a path where tariffs result in moderate and/or “one time” price rises that would clear the way for rate cuts later this year. In that regard he said that with all of the uncertainty, he thought “any of” the potential inflation paths that were being forecasted by Fed members were reasonable. Importantly, both Powell as well as other Fed members say they are expecting to see tariff impacts “in the summer” and Powell specifically pointed to the June and July inflation reports (to be delivered in July and August) as key inputs.
Given all of that, I think it’s now pretty clear that if we get through August with no notable tariff impacts that the Fed will be cutting in September and likely again in December (assuming things continue towards the 2% target). Of course, we could always see a quicker start to the cutting cycle if we see a sharp rise in unemployment (I think above 4.5%) or growth really starts to deteriorate (we did see some very weak data on the spending side this week, although it’s hard to say how much was tariff “hangover”. There even remains the outlier possibility that if we get a weak employment report (and other economic data) over the next several weeks and still soft inflation we could see July become “in play”.
Clearly the markets are sniffing this out with rate cut bets firming notably since the June FOMC.

And with Fed rate cut bets firming the 2/10 curve pushed back higher to +0.56% after hitting a 2-month low on FOMC Day.
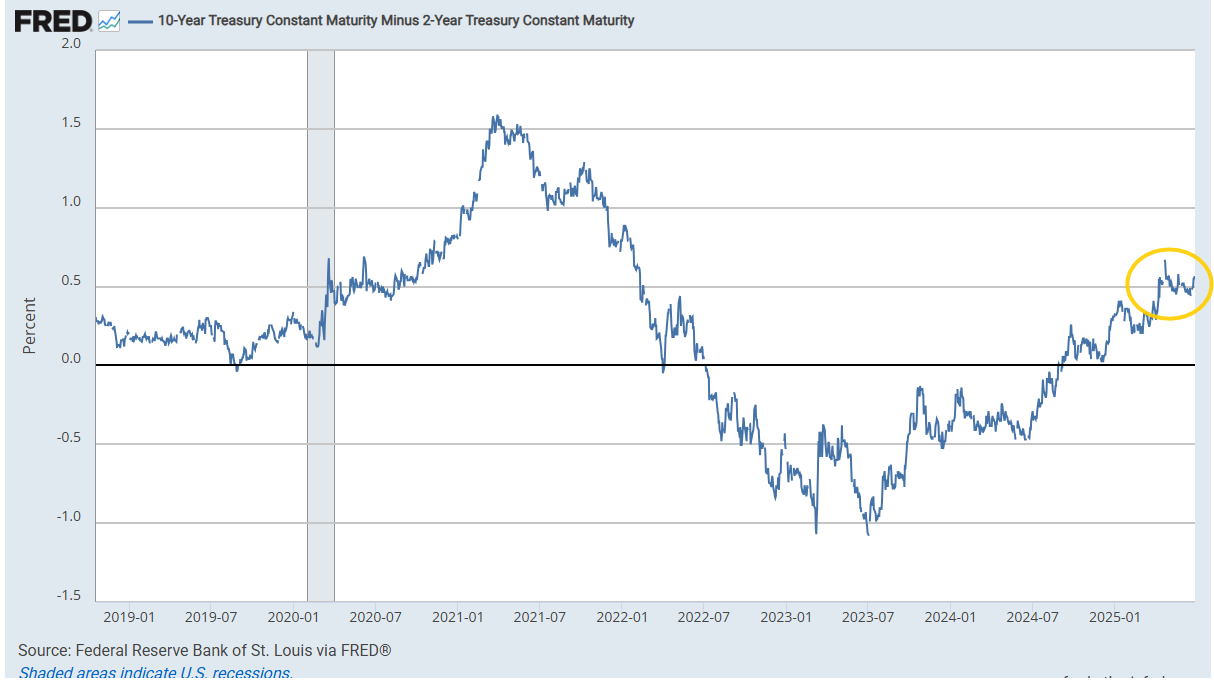
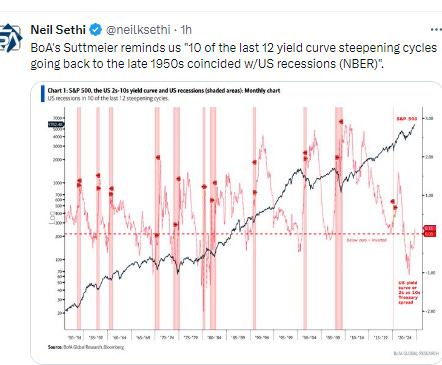
As a reminder, historically when the 2/10 curve uninverts following a long period of inversion the economy is either in a recession or within a few months of one. It uninverted in Sept, so I had said this looks officially like a "this time is different" situation.
The 3mos/10yr yield curve (considered a better recession signal than 2/10’s w/the last four recessions on average coming a few months after the curve uninverted (prior to that it generally uninverted after a recession had already started)) though fell to a 2-mth low at -0.14% this week, clearly calling for rate cuts (this is normally closer to 1.25%).

As noted back in February, this (reinverting) is something that it did prior to (or just after) the last two recessions and it also dipped (but didn’t reinvert) in the two recessions prior to that. Not sure if the reinversion “restarts the clock” on the recession watch. If so the longest it went in those previous four instances before recession after reinverting is 6 months (2007).
Also note that in 1989 and 2007 we saw similar periods of a recovery from inversion that stalled at the zero line for long periods of time which turned into recessions after they lifted (but in 1989 it took six months).


And another way of looking at this, the 10yr Treasury yield also fell back under the Fed Funds rate, well under the typical spread of around 1-1.25% above, so also for now still calling for rate cuts.
As noted previously when it’s dropped from above to below (as opposed to having the FFR move from below to above) as it did earlier this year, we’ve always seen a rate cut since 1985 although it can take as long as a year.

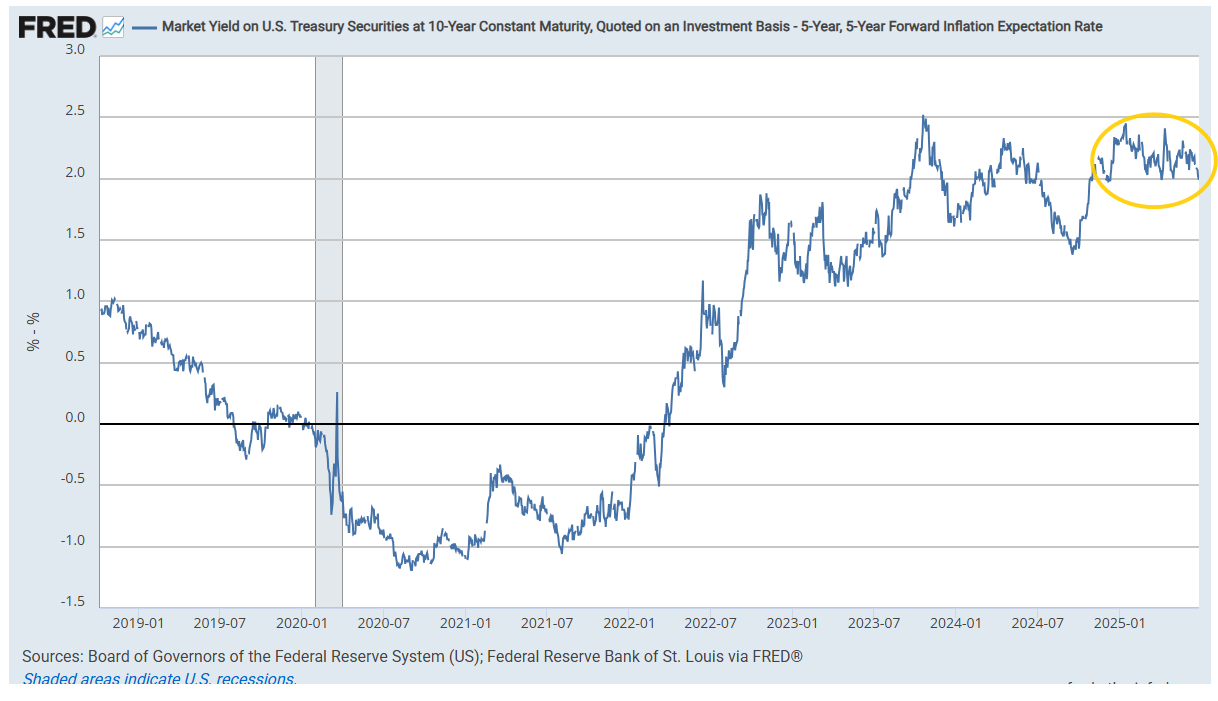
Long term inflation expectations as measured by the 5-yr, 5-yr forward rate (exp'd inflation starting in 5 yrs over the following 5 yrs), which continues to be referenced by Fed members (including Jerome Powell (although I don't think he mentioned it at the June meeting)) as evidence for long-term inflation expectations remaining “well anchored,” edged back -4bps w/w to 2.25%, remaining around the middle of its 4-year range, so for now not showing a great deal of concern about longer term pressures from tariffs or oil prices.

And the 10-yr breakeven rate remains in the middle of its post-2021 range at 2.29%, -4bps w/w.

10yr real rates fell -9bps w/w as of Thurs to 1.98%, a 2-mth low, now -36bps from the 2.34% mid-Jan peak (which was the highest since Oct ‘23 (and before that 2007)), but still well above the 2012-2020 peak of 1.12%.

As with 10yr rates implied from market pricing, backing into 10yr real rates using 5-yr, 5-yr forward inflation expectations (subtracted from the 10yr nominal yield) similarly saw them similarly fall back to 1.99% as of Thurs, nearly a 3-mth low, now -46bps from the Jan peak (2.45%). These remain over four times the 2013-2020 average of around 0.5%.
And as a reminder according to BoA the importance of real rates on equity returns has seen the largest increase in the factors they track over the past 5 yrs and explains a larger proportion of stock returns (83% correlation) in their data (to 2006), with the dollar close behind the most correlated (76%) since 2015.
Short-term real yields (Fed Funds - core PCE) fell back to 1.65% in May from 1.75% in Apr (rev’d from 1.81%) which was the highest since October, remaining well under the 2.70% last June, which was the highest since 2007, but above the local low of 1.38% in February.

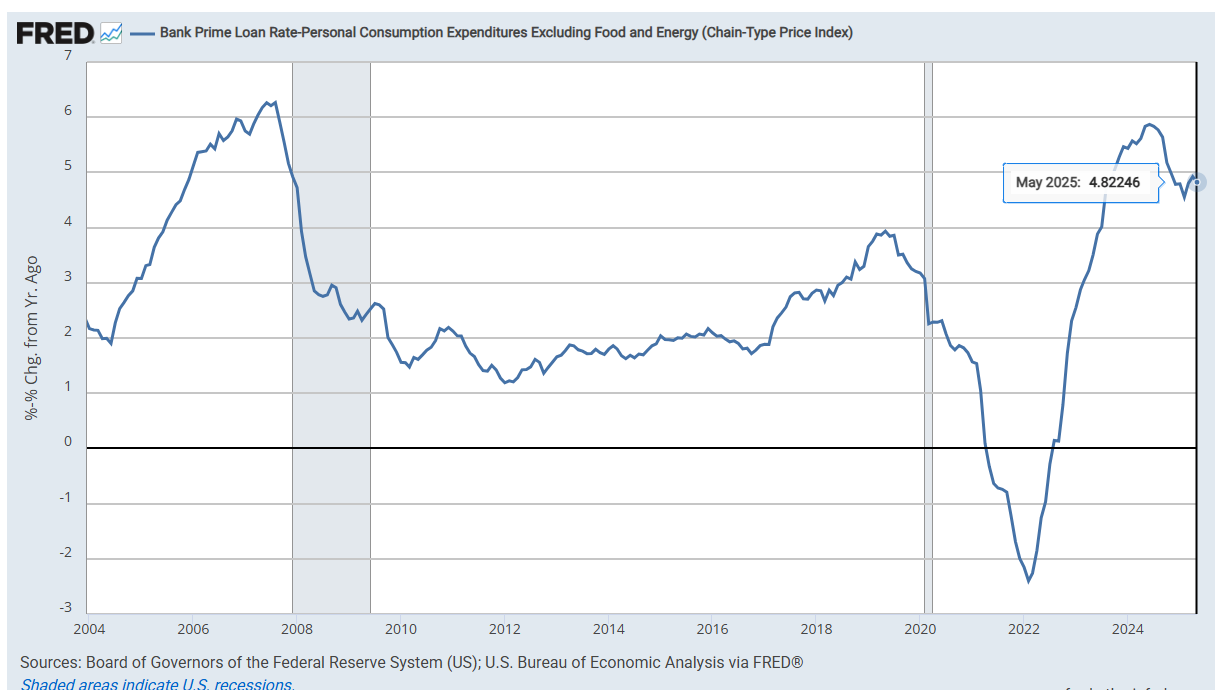
Not much relief for small businesses or HELOC borrowers as the real prime rate (inflation adjusted using core PCE) fell just a tenth to 4.82% from 4.92% in Apr although over a percent below the 5.9% high last June, which was the highest since Sep 2007. Still, it remains more than double the 10yr pre-pandemic avg.
A little surprising to some was the FOMC’s median long run projection for the endpoint of the Fed Funds rate (the “neutral rate”) remaining at 3.0%. That said, note the average moved up to 3.11% from 3.02%, and even at 3% it is the highest since Sep 2018 (but also well below levels prior to that).
The ACM model of the 10yr UST term premium (which is solely based on interest rates), was little changed w/w as of Thursday at +0.69%. It remains below the +0.91% hit on May 21st which was the highest since July 2014 but is still +45bps since Apr 2nd.

The extended discussion on term premium (what it is, why it’s important, etc.), can be found in this section in the Feb 4th Week Ahead.
The MOVE index of expected 30-day Treasury note/bond volatility like the VIX is back down to the lowest since February and is not far from the lowest since Jan ‘22.

Despite overall Treasury volatility falling, 30yr mortgage spreads edged higher as well to 2.45%, +6bps w/w although still just +18bps from the 2.27% hit Dec 19th which was the least since 2022 and is well under the 2024 peak of 2.73% and the 37-yr high of 3.1% in June ‘23. The 2025 peak was 2.53% May 1st. But they are still around +65bps above the 2010-2020 avg level.

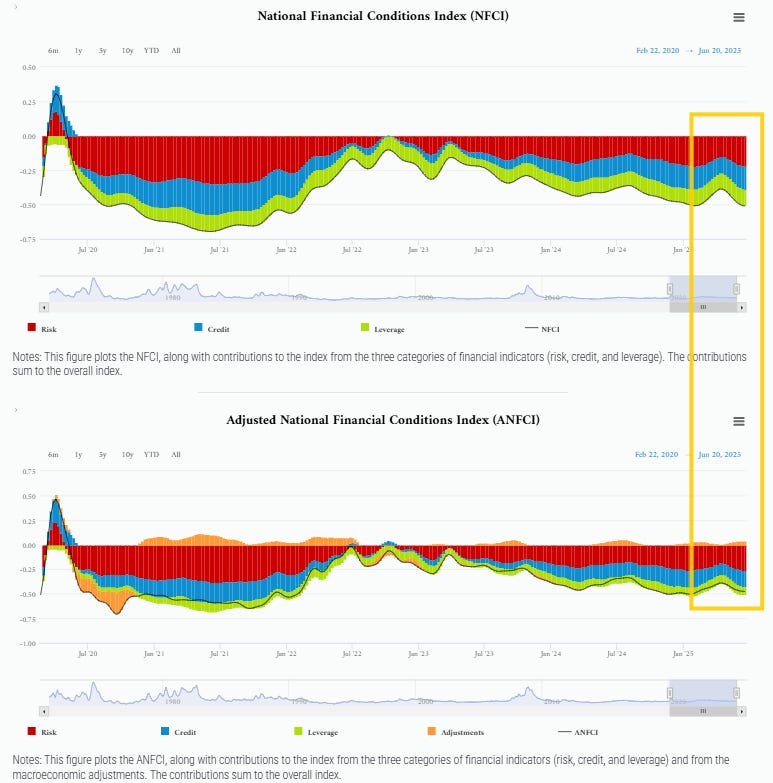
Chicago Fed National Financial Conditions Index and its adjusted counterpart (the latter attempts to remove the correlation between the various indicators due to broad changes in economic conditions), both of which are very comprehensive, each w/105 indicators, in the week through June 20th held steady after falling for 8 weeks, the former at the joint least (loosest) with Jan since Feb ‘22 at -0.51, while the latter is the least since Feb at -0.48, but just 0.02pts away from the least since Jan ‘22.
https://www.chicagofed.org/research/data/nfci/current-data
Turning to RRP, some background:
As the Fed continues to drain liquidity from the system via QT, I think it’s important to watch for stresses which give an early warning signal that they are perhaps going to far as they did in 2018 which led to a near bear market. One area I am monitoring is reverse repos (which is an overnight secured place institutions (mostly money markets and banks) can park excess funds to accrue some interest, designed by the Fed originally to keep excess liquidity from pulling down rates too much in other short term markets and provide a “risk free” place to park short-term funds). RRP grew rapidly in 2021 & 2022 as money was pumped into the system and needed a home, but since May ‘23 has been steadily drained down by the Fed’s QT program and higher bond issuance with banks discouraged by regulatory rules from taking up the increased Treasury supply.
In particular, the continued sizeable issuance of T-bills (<1 yr duration) of around $800bn/month (accentuated by the $60bn in balance sheet runoff (meaning the Fed has reduced its buying of maturing Treasuries by that amount which the private market has to fill)) drained ~$1.75 trillion from RRP in the year through March 1st. From then until early July RRP levels had remained relatively stable in the $375-$500bn range, but then resumed their decline (in fits and starts (seeing spikes at most month-ends but then coming down to hit new lows), with the lowest level hit Feb 14th at $58bn, the least since Apr ‘21 on the back of the Fed cutting RRP rates to the low end of the Fed Funds band which made parking funds there (versus lending overnight to other institutions or buying T-Bills) less attractive in line with their desire to sop up most of this “excess liquidity” (as they have described it).
As noted in previous weeks, since then RRP had rebuilt as with the Treasury up against the debt ceiling they have had to stop issuing new Treasuries only refinancing maturing ones. This has taken away a source of investment for money markets and other buyers who have had to turn to the RRP in part despite the lower rates. The expectation was for RRP to continue to slowly build until the debt ceiling is raised, at which time (when the debt ceiling is raised) it is predicted to drop quickly as the Treasury “catches up” on the Treasury issuance currently on hold, which will force the end of QT (concerns about that have already seen the Fed cut QT by $20bn), but we saw an unexpected drop in April to a new low ($54bn) Apr 16th, although they have rebounded a bit.
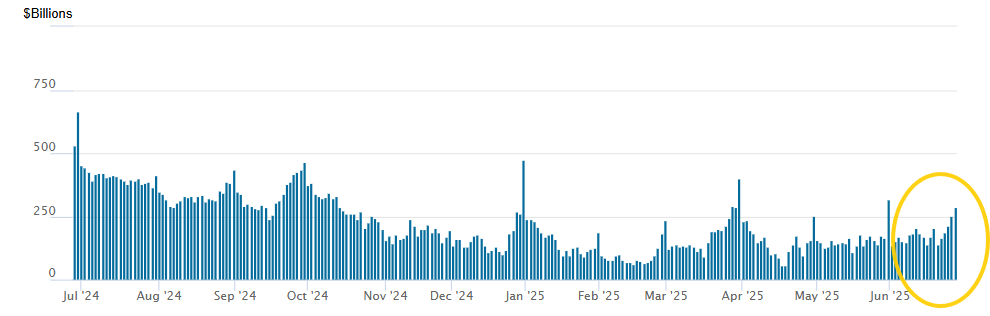
After hitting what I called “concerning” levels Apr 16th at $54bn, the least since 2021, RRP had built back up to around $150bn and remained there outside of May month-end when we saw the typical month end jump as banks shrink their reported balance sheets at quarter/month-end when they have to report their asset mix to regulators (RRP doesn’t count against their regulatory ratios while cash & T-Bills do).
I said “I would expect this to come back down” and it did ($135bn this week), but as I said then “even at ~$150bn it indicates there’s currently sufficient liquidity in the system.” I said last week “[w]e should expect to see these same month-end dynamics (which is a little more at quarter end) as move to June 30th,” and that’s what we’ve seen now up to $285bn. These should spike Monday and have come back down considerably by the time I report on this next week.
Still expectations were that this would build while the Treasury was drawing down their TGA account (due to the debt ceiling). The fact that it hasn’t leaves insufficient cushion when the debt ceiling is raised and the Treasury boosts auctions to refill the TGA (estimates for this rebuild are as high as $475bn in extra issuance currently).

BoA who I have often highlighted pushed out their expectation for the end of QT to December, and they continue to say to watch RRP as the trigger (which they expect now to hit zero in September, but which it appears may come well before that):
"We expect the Fed will wait until after the debt limit resolution and TGA rebuild to reevaluate their balance sheet policy. We expect a debt limit resolution in late July/August, which would imply a large TGA rebuild from near $0 following the resolution....We revise our QT end date to Dec ’25 as slower QT implies a slightly longer runway. We expect the Fed ends QT after TGA is rebuilt and clearer funding pressures are evidenced. At this time we expect the Fed’s 'dashboard' of money market & liquidity indicators will clearly shift from green, past yellow, and towards red. We continue to believe UST repo is the single best indicator for flagging when QT should end."


Also (like RRP) rebounding from April lows have been the more important bank reserves. After touching $3tn in April (which is the level where we saw indigestion in the credit markets in March ‘23 (which contributed to the banking issues (SVB, etc.) and Robert Perli, head of the SOMA desk of the NY Fed confirmed we did see some stresses in April), they have pushed back up to a more comfortable level ($3.34tn this week) maintaining a cushion over the $3tn level where we’ve seen issues in funding markets (this April and March ‘23 most notably). They appears for now will be safe until we get the debt ceiling raised, at which point the Fed may have to step in to add liquidity as the Treasury re-funds the TGA (see RRP discussion).


For background on various estimates of when reserves will be “too low” see the Feb 4th Week Ahead.
Getting back to rates, I said back in April 2024 that 2-year Treasuries were a good buy at 5%, and as I noted once the Fed started its cutting cycle thereafter the ship has likely sailed on seeing those yields anytime soon (meaning years). In terms of 10yr’s I had advised then grabbing some at 4.7% (which I subsequently sold on the drop under 3.75% as posted here in September) but at the time seemed like something we wouldn’t see anytime soon, but we got back there in January (and I added some as posted here) but it seemed like we might be headed much higher until Treas Sec Bessent noted the administration’s focus on keeping the 10yr yield low (and perhaps more importantly committing to the auction schedule set up by Sec Yellen for the next few quarters in both of the Quarterly Refunding Announcements, which has exerted downward pressure on 10yr yields). I sold that small position on the dip under 4% in April, and it seemed like we were poised to get back up there before they turned down not quite reaching those levels.
And for now we continue to see range bound action in my “2025 likely trading range of between 4 and 5%.” While they left that range in early April (for one day), other than that we’ve been solidly in it, which I expect to continue for now.

I still believe that if we do get a recession with the unemployment rate rising over 4.5%, job losses in the employer’s payroll survey, and contractions in consumer spending and business investment, then we’re likely to see 3.6% again (and probably lower). In terms of how high they could go, I still have a hard time seeing them sustaining for long above 5%.
For all the old “final hike” and “first cut” materials, you can reference the Feb 4th blog post.
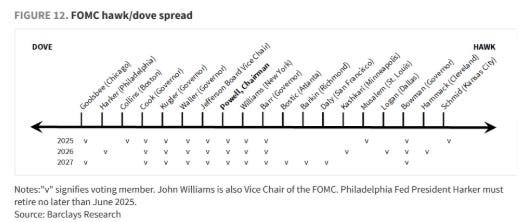
Note BoA’s Dove-Hawk chart (which they acknowledge is badly in need of an update) is missing Hammack in ‘26 (Cleveland and Chicago vote every 2 yrs), but otherwise looks right (in terms of voters (also note that Philadelphia Fed Pres' Harker’s replacement has started (Anna Paulson) who will have a vote in 2026). While little is known about how she views policy, she does come from Chicago which is headed by the more dovish leaning Goolsbee (but she’s been there for two decades).
In terms of the Hawk/Dove spectrum it’s still not that far off although Bowman has joined Waller as the most dovish while Kashkari has turned more dovish as well.

While it doesn’t break them across the Hawk/Dove spectrum, UBS had a nice chart this week that gives you voters this year and next. I hadn’t realized that Kugler’s term as a Gov is already up (surprising as those are long).

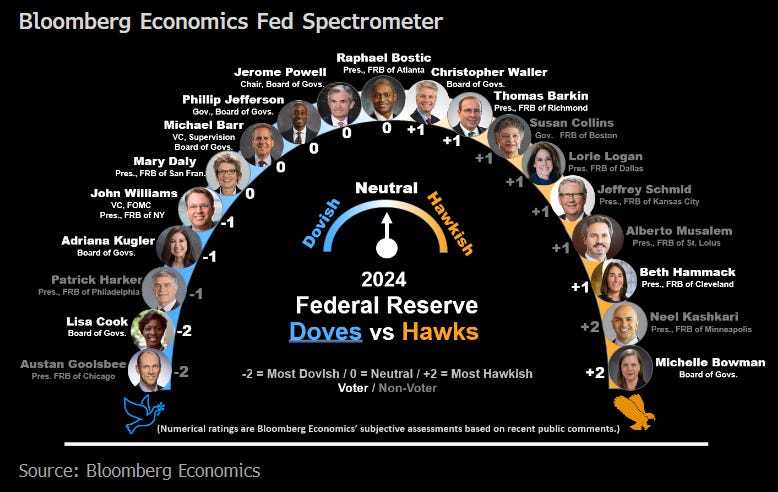
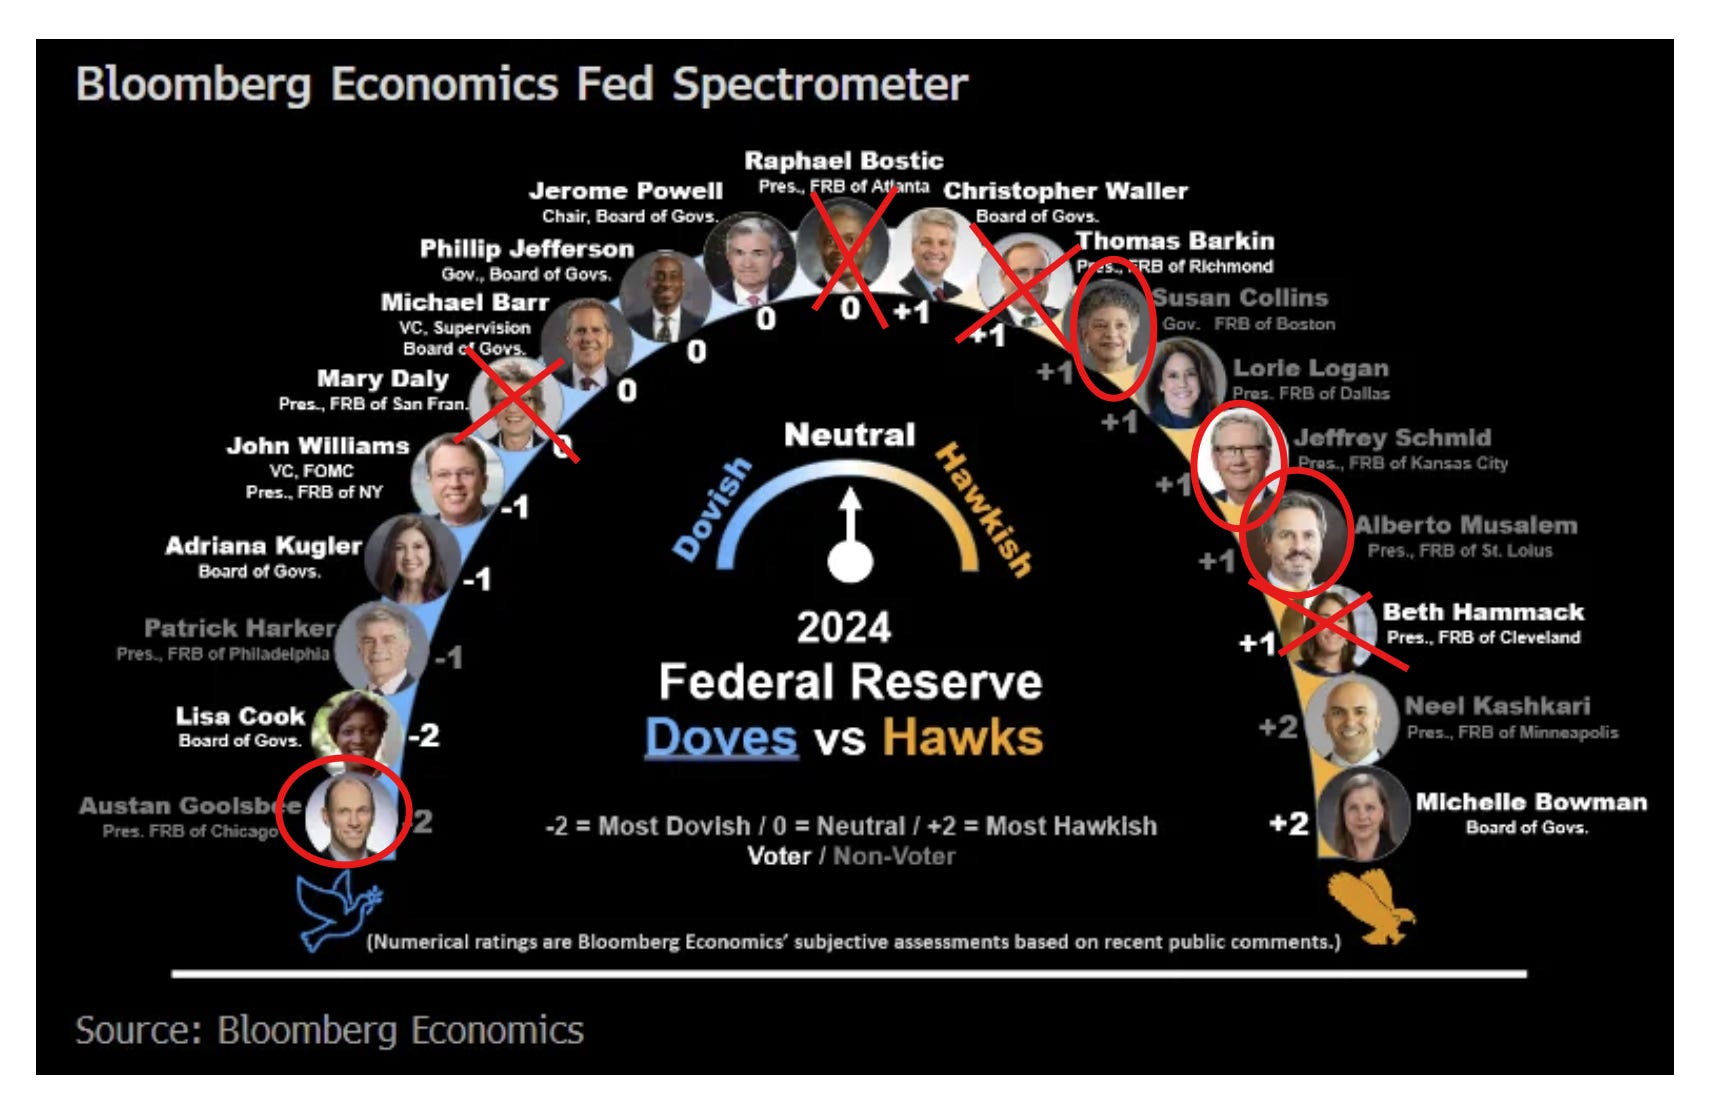
And I came across one from BBG. I think it’s pretty accurate except Kashkari is definitely not that hawkish (he was calling for a December cut in early November):
And here who is rotating off and on for 2025.
Found another FOMC hawk/dove chart to add to my collection. This one from Barclays. Seems pretty accurate except have to wonder how hawkish Hammack really is considering she was talking about a June rate cut right before the blackout. Also, don't think Daly is all that hawkish given she said she was looking for two cuts this year that week as well.
And on Harker’s replacement in July.

Earnings
As a reminder, I have removed most of the background material, which you can get in the Feb 4th blog post. You can reference this post from 12/1/24 for stats on 3Q, this post from 3/9/25 for stats on 4Q, and this post from 6/1/25 for stats on 1Q 25.
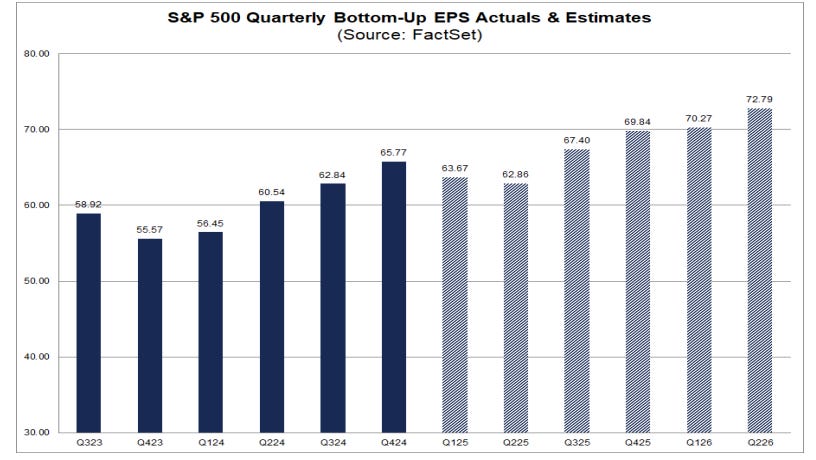
As we head towards Q2 earnings (the unofficial kickoff is July 15th w/JPM who has cemented that role at this point (but we’ve already started to get them as some companies don’t follow the calendar for their quarter-end), we’ve seen a larger than normal drawdown in expectations, now at 5.0% according to Factset from 9.3% as of the start of the quarter (April 1st). This decline is larger than the 5 & 10-year averages (-3.0% & 3.1%).
While the 8th consecutive quarter of positive earnings, it would also be the least y/y growth since Q4 ‘23.
6 of 11 sectors are expected to report y/y growth led by Comm Services & Tech while Energy leads the 5 decliners.

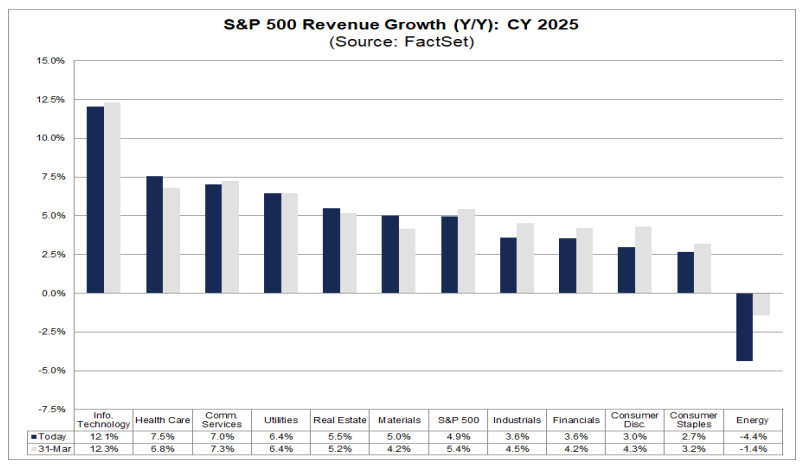
In terms of revenues, Factset says 4.2% growth is expected, down from 4.7% to start the quarter, which would be the 19th straight quarter of growth.
10/11 sectors are expected to report growth led by Tech. Energy is the lone decliner (but that has been cut in half since the start of the quarter).

In terms of profit margins, expectations are for 12.3% for Q2, down from 12.7% in Q1 but above 12.2% a year ago and the 5-year average of 11.7%. Two sectors are expected to report a year-over-year increase in their net profit margins in Q2 2025 compared to Q2 2024: Communication Services (14.0% vs. 11.6%) and Information Technology (25.0% vs. 24.0%).

While Q2 was edged up a tenth to +5.0% growth (-4.6% past 12 wks, -8.6% last 22 wks),
-Q3 was also edged higher to +7.3% (-4.4%, -8.1%),
-Q4 +0.2% to +6.4% (-4.9, -10.3%).
For 2025 as a whole though we’re still looking for +9.1% growth unch w/w for a 5th week.
With Q2-Q4 expectations edging higher, Factset says expectations for 2025 as a whole have started drifting higher, although remaining for now around the least since the start of their tracking at $264.21 (-$10.05 since Dec 31st).

That though still represents a pretty healthy growth rate of +9.1% for 2025 earnings, but that’s also down from 12.6% Dec 31st. Factset says the -3.5% drop in 2025 earnings expectations since the start of the year is larger than the 5 & 10yr avgs (-3.2 & -2.3% respectively).

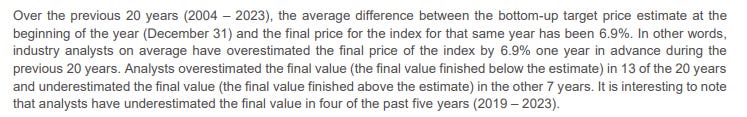
In terms of the earnings growth exp’d for 2025 Factset notes it will be a record, although also notes that there is on average over the past 25 yrs a -6.3% deterioration from where it starts the year ($275.05) w/analysts overestimating in 17 of those yrs (which would equate to $257.72 based on the average deterioration). But it should be noted that average includes 4 outlier years (2001, 2008, 2009 & 2020) where the overestimation was b/w 27-43% due to recessions. Excluding those, the difference is just -1.1% (which would equate to $272.02 (a little below where we are now)).
2025 revenues are now expected to grow +4.9% down -0.9% since Dec 31st, and down from 5.4% at the start of the quarter (April 1st).
Energy is the only sector expected to have negative revenue growth (although that’s been cut by two-thirds since the start of the quarter).
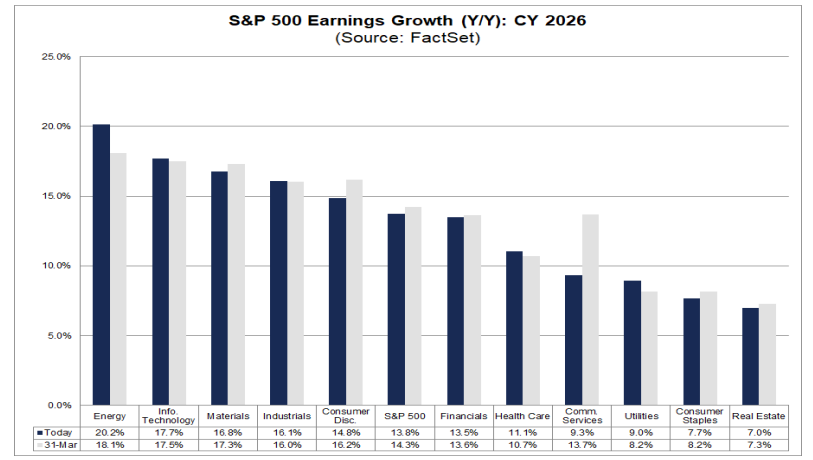
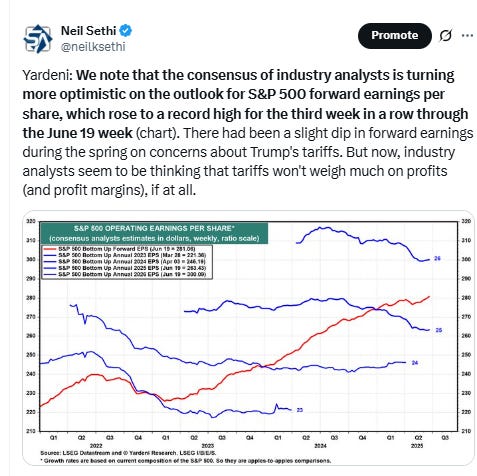
The softening to 2025 earnings expectations (now down to +9.1% y/y growth from over 14% at the start of the year) has been matched by 2026 expectations which have remained near +14% all year (as of Thursday +13.8%, +0.1% since Dec 31st), as they've tracked 2025 lower on an EPS basis.
Factset’s analysis of analyst bottom-up SPX price targets for the next 12 months as of Thursday continued to increase after halting a 10 week string of decreases (the longest period of softening since 2022) five weeks ago this week another +22pts w/w to 6,679 (still -362 pts last 15 weeks, but +152 pts past five weeks) which would still be +8.8% from Thursday's close.
Health Care (+16.9% up from 14.9% two weeks ago but down from +19.0% the week before that) remains the sector having the largest upside seen by analysts followed by Energy (+14.9% up from 14.1% two weeks ago but down from +20.4% the week before that) followed by RE (+14.4%) while Financials (+4.6% down from 6.2% two weeks ago) and Industrials (+5.7% down from 6.1% two weeks ago) are the sectors expected to see the smallest price increase.
As a reminder the last 20 yrs (through 2024) they have been on avg +6.3% too high from where they start the year (which was 6,755), but note they underestimated it five of the past six years (including 2024).

Factset: In terms of analyst ratings (there are 12,319 tracked by Factset), buy and hold ratings continue to dominate at 56.4% & 38.7% (buy ratings are up from 53.6% on Oct ‘24 but fell four tenths the past 3 weeks coming into this week), while sell ratings edged down to 4.9%.
“The percentage of Buy ratings is above its 5-year (month-end) average of 55.1%. The percentage Hold ratings is below its 5-year (month-end) average of 39.0%. The percentage of Sell ratings is also below its 5-year (month-end) average of 5.9%.”
Energy (68%), Communication Services (68%) and Comm Services (64%) & Tech (64%) sectors have the highest percentages of Buy ratings, while Consumer Staples (40%) has the lowest percentage. Utilities leads sell ratings at 7% (but -3% the past 2 weeks) along with Consumer Staples.
The Consumer Staples (53%) sector also has the highest percentage of Hold ratings.


And some other earnings stuff:


Economy
Over the past 2+ years part of my earnings optimism has been due to the economy holding up better than expected. While earnings only track the economy loosely (and markets look forward 6-12 months), there is a clear positive correlation between the economy and earnings (particularly a weak economy and weak earnings), and there is a very strong correlation between earnings and stock prices (although stock prices (being as noted forward looking) generally fall in advance of a recession and bottom 6-9 months before the end of one). So if you can see a recession coming it is quite helpful, although very difficult (especially ahead of the market). You can reference this Week Ahead (see the Economy section) for a lot of material on how every recession is preceded by talk of a “slowdown” or “soft landing” as close as a month before the start. That report also has the notes about how small caps have shorter debt maturity profiles and more of it (debt).
The intro will remain unchanged for the time being as it serves as introductory material:
As long time readers know the beginning of this section hadn’t changed much until this year since I switched to the Week Ahead format in mid-2022, with the indicators to me during that period consistent with solid (which at times has been robust) economic growth, and I have been a broken record that I “certainly do not think we’re on the verge of a recession (although as noted above every recession starts out looking like just some economic softening).”
That said, I started noting in February that the January data had taken a turn for the worse. However, I also said January could be written off due to poor weather, and in that regard we did see some bounceback in most of the “hard” data in February. As we got the March data last month, I noted the pattern had continued with the hard data generally continuing to come in good to very good (the “very good” normally though likely due to tariff front-running), while the soft data continued to deteriorate.
Since the end of March though, we’ve seen the data soften. That continued this week, and it actually stretched back pre-March with 1Q services spending getting a notable markdown (as did services exports and construction spending). In terms of more current data we also saw weak services spending in the May personal spending report along with a big drop in goods spending as auto sales dropped almost in half (although other goods spending was better)). Along with that we saw the first drop in personal income since Sep ‘21 on the back of a drop in social security payments (but after seeing a much larger than normal increase in prior months). Other data showing some weakness this week were new home sales and exports seeing the largest drop since the early days of the pandemic (although it looks like it might have been due to continued shuffling of metal inventories as traders look to avoid tariffs) and continuing claims remaining near cycle highs.
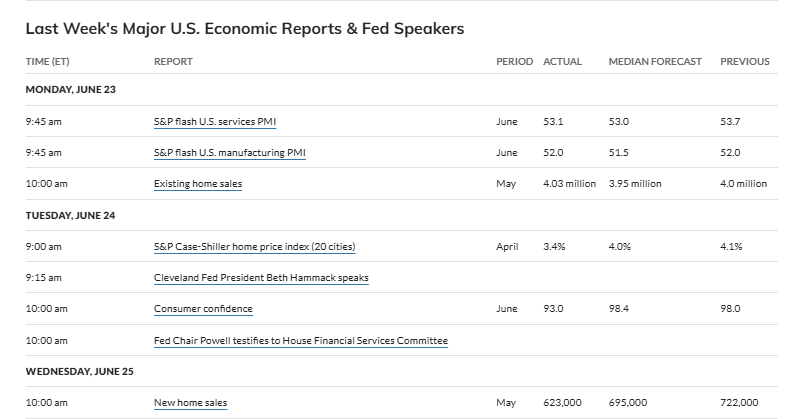
But flash PMIs, existing home sales, consumer confidence, initial jobless claims, and durable and capital goods orders all came in better than expected (the last much better than expected) providing some balance. And while government transfer payments fell sharply in May, wages remained quite strong, one of the key underpinnings to my overall constructive view on the economy.
So, overall, I would say the data last week continues to show an economy clearly softening but remaining in “ok” shape at this point, but with those “tiny cracks” as I put it three weeks continuing to get a little less tiny. For now the general message remains the same as prior weeks:
Hopefully we don’t get much further softening and perhaps we can rebound as we start to (fingers crossed) get past the tariff uncertainty. The good news is the important services sector has so far held up which is keeping overall employment and wages up [but as noted we saw some cracks in that this week]. That last item is perhaps the most important indicator to watch (real wage growth). We also got a weak productivity report but for now we can look through it given it was based on faulty GDP metrics. Hopefully once they get that all squared away it comes in better, but that’s another thing to keep an eye on. Productivity is incredibly important in allowing the economy to expand with less labor supply and without triggering inflation. Still, for now, I continue to feel that any softening does not appear to be morphing into a recession.”
And as I said at the start of September:
without question, the evidence is building that the days of >3% real GDP growth are behind us, and we should be happy to settle into something more around trend (1-3% real (infl adjusted) growth). That though is far from a disaster. The important thing will be to see the softening level out (L-shape) rather than continue to fall turning the “soft landing” into a recession.
And looking more specifically at the biggest current risk to economic growth, the tariff policies and uncertainty they’re creating until finalized, as I mentioned 11 weeks ago,
I am now less concerned than I was the week the reciprocal tariffs were first unveiled given we’ve seen a clear acceptance by the administration that they likely overreached and are now dialing things back (including now China) with continued positive noises coming out of the White House regarding “deals”, etc. As I also noted we saw that there is a definite pain threshold for the administration which means to the extent things start to look shaky, we seem to have a “Trump put”, although there are perhaps longer term ramifications that we’ll only see months/years down the road in terms of the global view of the US as an investment destination which may have impacts on the cost of capital here. That’s beyond the scope of this note, though, and as I said following the unveiling of the reciprocal tariffs when I noted I didn’t want to forecast a recession despite the numerous calls for one because “I am not an economic forecaster, so I will just continue to follow the data…. I think it’s too early to draw any strong conclusions,” that remains the case. For now, I don’t see any strong signs of a recession.
Finally, as a reminder, it does appear more and more likely that we’ll be getting some level of economic boost from deregulation and the tax bill moving through Congress, which should at the very least offset the drag we’re getting from the tariffs and restarting of student loan payments and perhaps provide a bigger boost than many are expecting.
Next week we’ll get a lot more data, particularly on the jobs market, so we’ll see how those turn out.

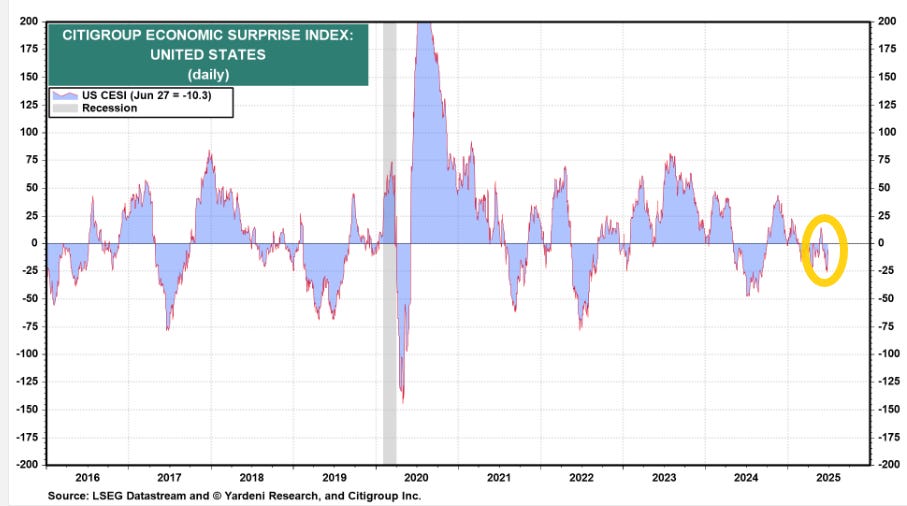
As the data last week was quite mixed, I wasn’t sure how the Citi Economic Surprise Index would handle it, but it found it overall fairly positive increasing +13.6pts w/w to -10.3 from the least since Sept the prior week (-23.9), still though down -21.7pts the last four weeks).
The highs of the year were 22.5 in mid-Jan. The 2024 high was 47.2 (in Feb) and the low -47.5 (in July).
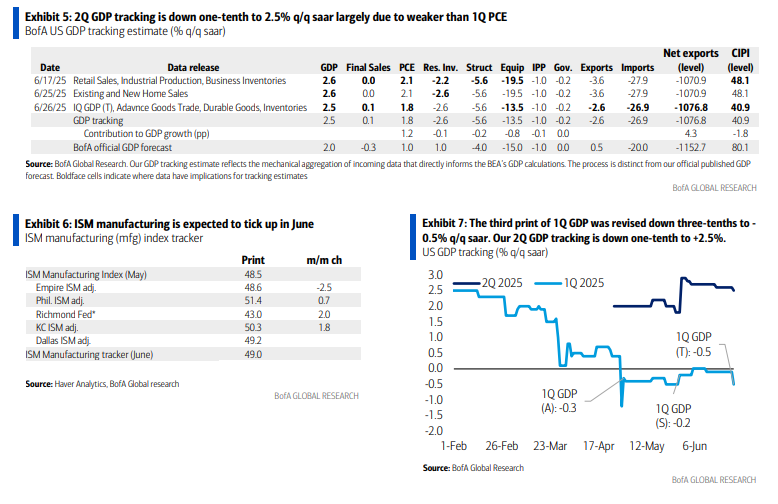
And GDP estimates are for now consistent with a no recession call (again though remembering GDP going into recessions generally doesn’t look like one is coming (it was up around 2% in Q2 & Q3 2008 well after the recession had started)), and while the Q1 number was weak as I expected, there is broad agreement that it was a function of mismeasurement (even the Fed said that in their May meeting minutes), but it looks like instead of that getting revised higher, it is flowing through to 2Q GDP estimates which though like Q1 are now getting quite wide (although at least all positive) going from the St. Louis Fed & NY Fed at just 1% to Goldman near 4%
2Q GDP estimate from the Atlanta Fed (whose GDP tracker was right in line in its 3Q & 4Q ‘24 first est’s of GDP (and just a tenth off for 2Q), but who was -1.2% too low for 1Q ‘25) drops to 2.85% (a 1-mth low) from 3.40% June 18th on the flurry of data over that 9-day period but mostly on a big drop in inventories which outweighed a jump in net exports (which itself is odd considering that net exports in the advanced goods report this week came in much worse than expected (I emailed them, I'll update when I hear back)

NY Fed’s 2Q GDP Nowcast (as a reminder, they were way off for 1Q seeing +2.6% vs the actual 1st est of -0.3% (although they were closer in most other estimates and that will be closer after revisions)) continues its steady deterioration now down to 1.72%, the least since it initiated tracking Feb 28th, from 1.91% the prior week and 2.72% Apr 25th most notably on the personal spending number as well as downward revisions to data from prior months offset somewhat by the beat on durable goods shipments.
As a reminder the model is “dynamic” and so adjusts in real time as data evolves but no “parameter revisions” this week.

The NY Fed’s 3Q GDP tracker fell to 1.92%, also the least since the start of tracking, from 2.06% the prior week and 2.50% Jun 23th.

St. Louis Fed Q2 GDP tracker (which has had a mixed track record the past few years, often undershooting actual GDP since Q2 ‘22, but was right on in Q1 & Q4 '24, but then way too high at +3.07%(!) for Q1 ‘25), continues to be the lowest of the trackers I follow falling nearly a half point to 1.02% from 1.46%. They do not give a breakdown of the inputs.

BoA (who as a reminder was just a tenth high for 1Q ‘25 GDP vs the 1st estimate, right on for 4Q ‘24 GDP & two tenths high for 3Q), dropped their 2Q GDP tracker to 2.5% as of Thursday due to the larger than expected markdown to 1Q consumer spending (validated by the weak May number Friday), weaker than expected new home sales, exports, offset by the stronger than expected durable goods orders.
Goldman lowered their 2Q GDP tracker a tenth to 3.9% following the weak personal income and spending data, but note their domestic final sales estimate, a measure of underlying growth trends that combines consumer spending and business investment, is just 0%. As a reminder their official house forecast is for 3.8%.
We forecast quarterly annualized GDP growth of 3.8% in Q2 (reflecting distortions related to frontloading of imports ahead of tariffs), 0.6% in Q3, and 0.9% inQ4.

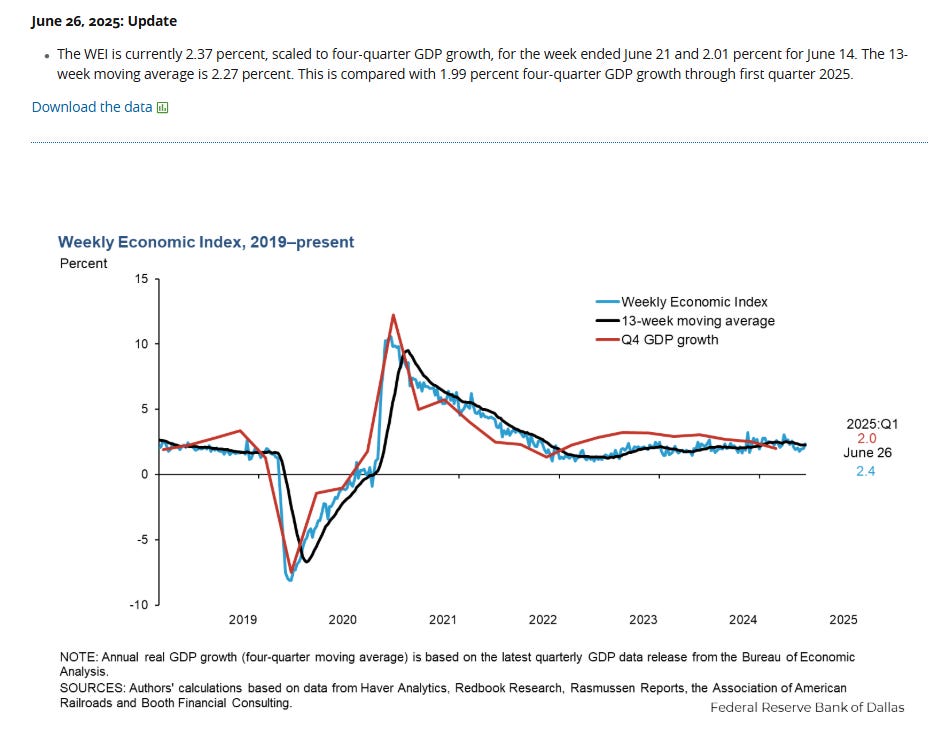
The Weekly Econ Index from the Dallas Fed (scaled as y/y rise for GDP (so different than most GDP trackers) which uses 10 daily and weekly economic series), which runs a week behind other GDP trackers, in the week through June 21st increased to 2.37% from 2.01% the prior week (down though from 2.66% on Apr 19th) moving back towards the top of the 1.49 - 2.66% range it has occupied for almost all of the past 3+ yrs, only poking above a couple times earlier this year (most recently Apr 5th).
The 13-wk avg also increased, in its case for the first time since May 3rd, to 2.27% from 2.25% the prior week (still well off the 2.53% May 3rd, which was the best since 2022), continuing though to evidence overall economic momentum that is a little above trend.
https://www.dallasfed.org/research/wei
Other economy stuff:
Valuations
Like the other sections, I’ll just post current week items regarding the multiple. For the historical stuff, see the Feb 4th blog post.
With equities seeing a strong rally last week and forward 12-mth earnings expectations little changed for the most part (they must have risen for mid-caps), the SPX forward P/E ratio jumped back up towards the highs of the year and increased notably for all but the mid-caps:
-The SPX forward P/E is 21.9 (+0.7pts w/w, +2.9pts since Apr 20th and -0.4pts from the post-2021 peak of 22.3 in December.
-Mid-caps' (S&P 400) is 15.9 (unch w/w, +1.8pts since Apr 13th, -1.6pts from the highest since early-’21 (17.1)).
-Small caps' (S&P 600 so higher quality than the Russell 2000) is 15.2 (+0.5pts w/w, +2.2pts since Apr 13th, and -1.9pts from the highest since early-’21 (17.1)).
-Yardeni's “Megacap-8” (adds NFLX) P/E is 28.7, +1.4pts w/w, +5.5pts since Apr 20th, but -2.8 pts from the 31.5 it hit in 1H 2024 (which was the highest since Jan ‘22)). It was ~31 at the December peak of the BBG Mag-7 index.
https://yardeni.com/charts/stock-market-p-e-ratios/

Other valuation stuff:
Breadth
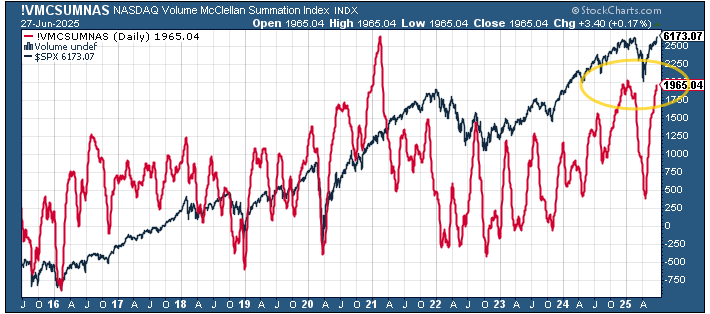
The NYSE McClellan Summation Index (red line, "what the avg stock is doing") turned back up as it continues to mostly just trend sideways the past 6 weeks.

The Nasdaq volume-based version (red line) though has not rolled over and is nearing the highs of the year, which were the highest since early 2021.
SPX new 52-wk highs jumped Friday to the highest since the start of March but the 10-DMA is not nearly at those levels, another way to look at the narrow push to ATH’s for the index.

% of stocks over 200-DMAs (red line) moved to the highest since March on the NYSE but not even to the highs of the month on the Nasdaq and neither are anywhere near the levels from last November, again showing the lack of participation in the rally.


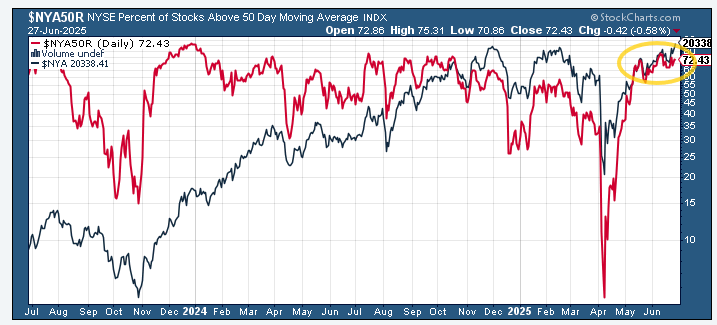
% of stocks above 50-DMAs (red line) also are not confirming the ATH’s in the indices although these are closer.

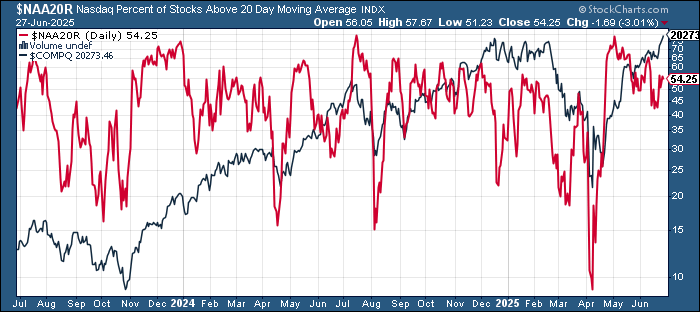
While % of stocks above 20-DMAs (red line) are a little weaker than those over 50-DMA’s, particularly on the Nasdaq.

Growth/Value on the SPX now at a record high (to 1995).
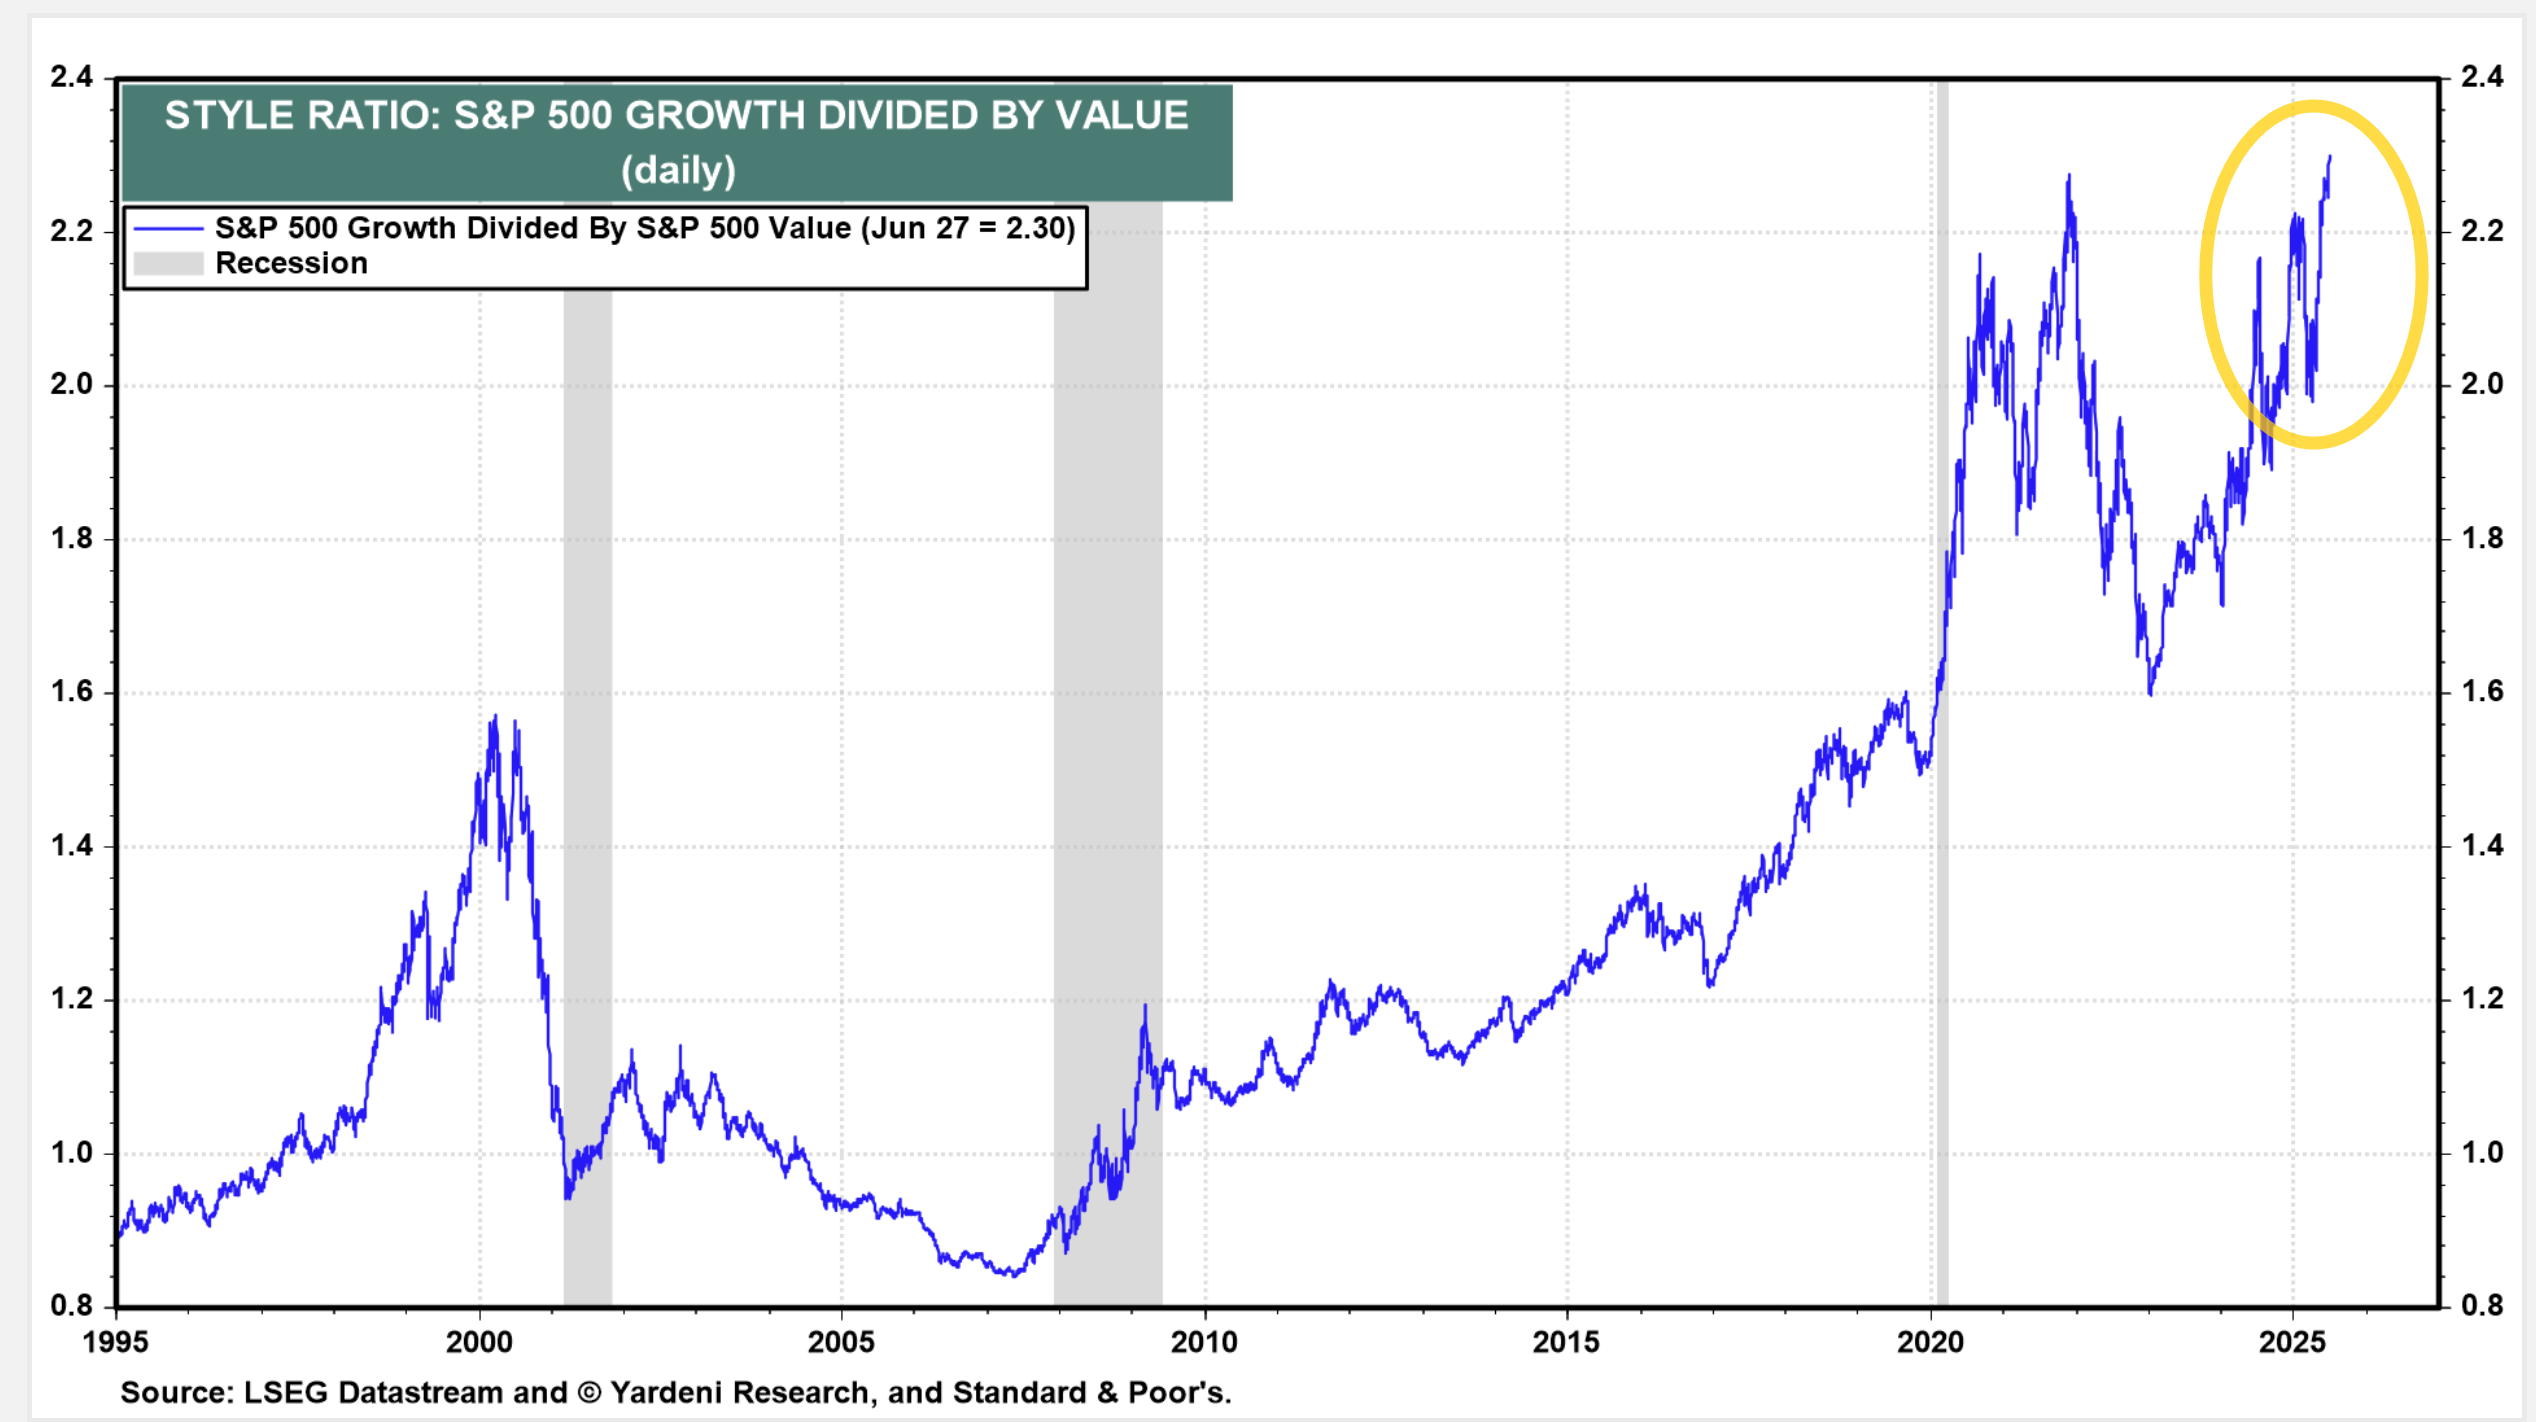
Which can be explained by relative earnings.

The equal-weighted SPX vs cap weighted ratio fell this week to the joint least (with last July) since 2009, very close to the least since 2003.

IWM:SPY (small caps to large caps) remains just above the 24 year lows hit in April.

SPX sector breadth improved to 9 of 11 sectors up on the week (from five the prior two weeks) led by the megacap growth sectors which were all up around 4% or more. Financials and Industrials were both up over 3%. In total 8 of 11 were up over 1%.
After Energy (-3.4%), bond proxies took the bottom three spots.

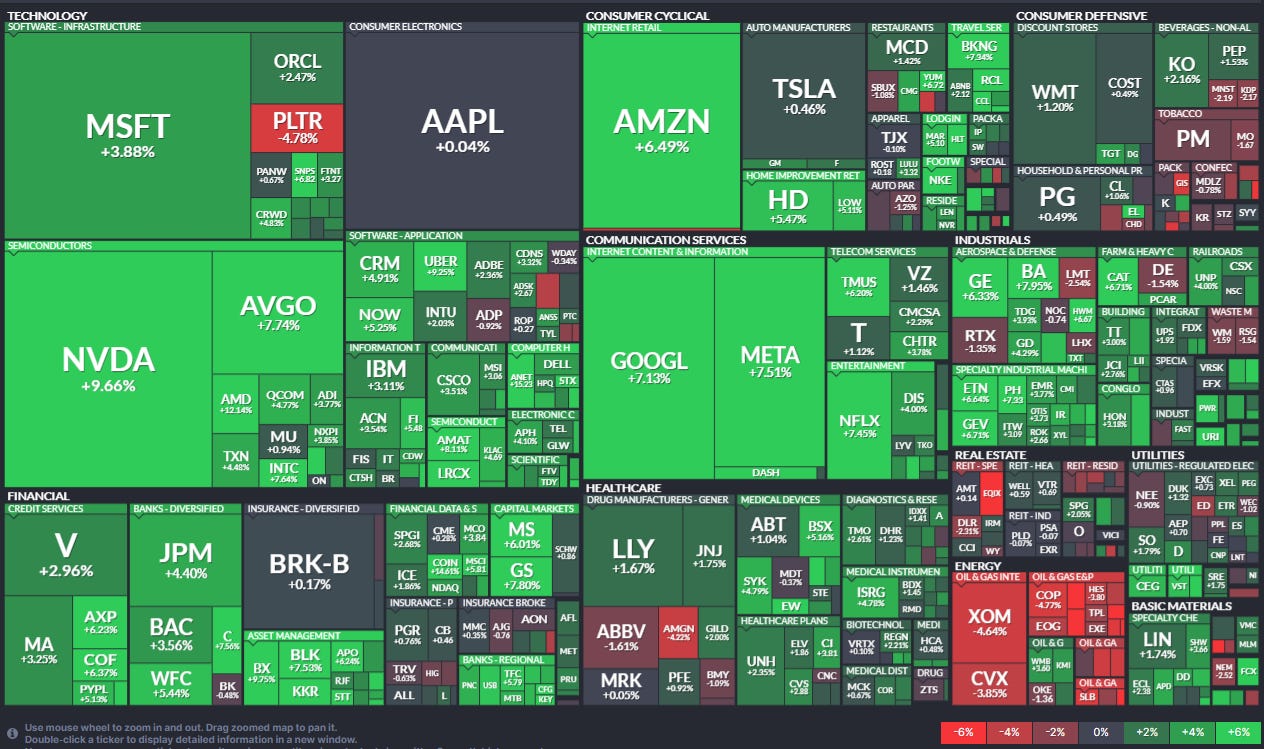
Stock-by-stock chart from Finviz consistent with lots of green outside of Energy. Just a few stocks outside of energy down more than -3% (including PLTR, AMGN, EQIZ, PAYX, GIS, CPB, CAG, BG).
Way too many over to name with NVDA, GOOGL, META, AMZN, UBER, INTC, AMD, AXP, COF, C, BLK, TMUS, NFLX, BKNG, BA, GE, ETN, CAT, MS, GS, COIN, YUM, NKE just some of the names up over 6%.
Other breadth stuff:
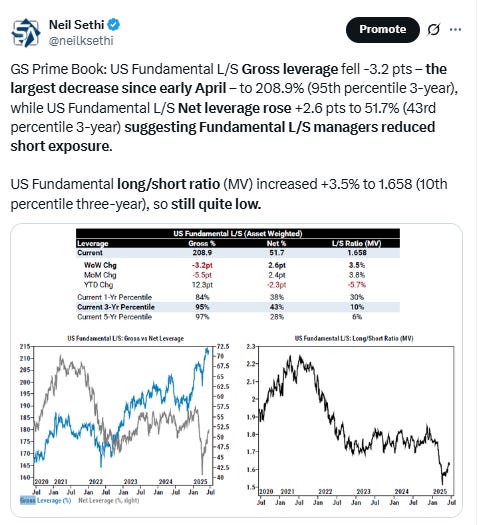
Flows/Positioning
Flows from BoA’s Flow Show report:


ICI data on money market flows saw a +7.6bn inflow in the week through June 25th, less than the +$26.1bn EPFR saw (although the prior week EPFR saw a decline while ICI saw a rise). It was 2/3 to retail ($5.2bn) vs institutions (+$2.5bn), the latter of which are ~60% of MMF assets).
Total MMF assets now at $7.02tn, just below the record $7.03tn.
https://www.ici.org/research/stats/mmf

Looking at CTA (trend follower) positioning in the US indices, first as noted two weeks ago BoA has updated their reporting to now providing detail on bullish, flat, and bearish price paths (which are based on price trend vs moving averages), and also adds in short, medium, and long term price trends.
With that backdrop they say “[w]ith the S&P 500 and NASDAQ-100 closing at all-time highs this week, trend followers have picked up the pace of buying in these indices. Our models indicate that most CTAs, regardless of model speed, will be long S&P 500 and NASDAQ-100 futures by the end of next week. Buying is set to be most aggressive among long-term trend followers which still see the lowest price trends. Russell 2000 trend follower positioning is still mixed, but CTAs could be buyers next week as shorter-term trend followers grow longs and longer-term CTAs cover shorts.”
So there is a bias for buying the SPX and NDX. The RUT should see buying as well on a positive price path. They don’t have a sell trigger for the SPX but the buy trigger is 6482.


Tier1Alpha’s model also sees CTA positioning in US equities having pushed higher last week requiring further price gains to see them add.

DB notes “CTAs reduced their overall equity long positions this week (41st percentile). In the US, they trimmed S&P 500 longs a little (22nd percentile), while increasing Nasdaq 100 longs (27th percentile); they also reduced shorts in Russell 2000 (13th percentile).” So CTA positioning remains quite light by their estimates in US indices. Not sure how that totals to 41st percentile, but they’re the experts.

BoA notes on gamma positioning “SPX gamma has arguably been in a muted regime since equities sold off in February from then all-time highs. However, as the S&P 500 has recovered recently - setting new records on Friday - SPX gamma has begun to show some signs of life. For example, as of Thursday’s close SPX gamma was modestly long at ~$3.7bn (50th 1y %ile). While Thursday’s gamma was not exceptional (e.g., relative to the >$12bn gamma in mid-Feb) it was the 4th highest gamma we’ve seen for SPX since gamma collapsed in late-Feb and the remaining top 3 largest SPX gamma days have all occurred in the last two weeks.”
So like others BoA sees gamma having moved more firmly into positive territory which should have some marginal dampening impact, particularly as to declines all the way to the 5950 level but there’s a falloff at 6200 would see dealers have to chase upside past that level.

BoA continues to model risk parity funds (whose AUM is est’d to be as big as CTAs & vol control combined ($500bn-$1tn)) with their (leveraged) overweight to bonds at now the highest since 2021, while their commodity and equity exposures remain low (but continuing to slowly build).
#oott

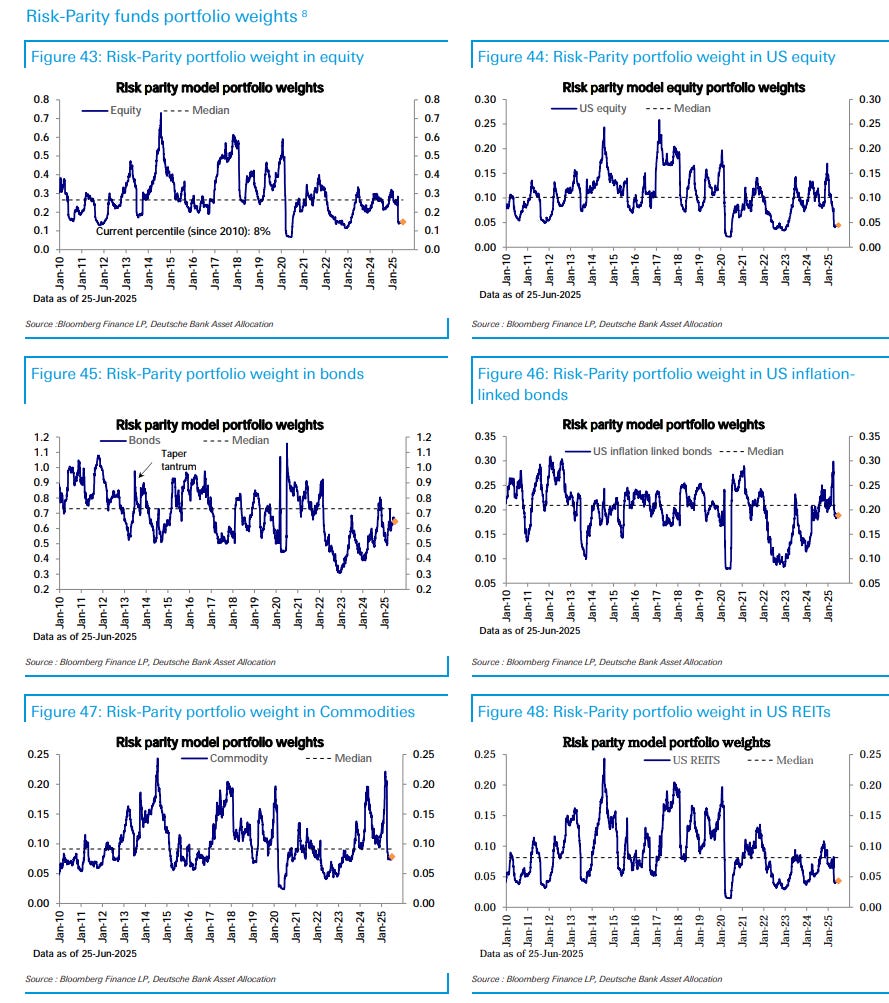
DB sees less of an allocation to bonds but otherwise similar (with “very low” equity allocations): “Risk parity funds’ equity allocations remained very low (8th percentile). Allocations were trimmed slightly in EM equities (25th percentile), while those in the US (8th percentile) and other developed markets (7th percentile) stayed flat at low levels. Their allocations to bonds also got pared (35th percentile), while those to commodities (39th percentile) rose; those to inflation-protected notes also rose modestly (32nd percentile).”
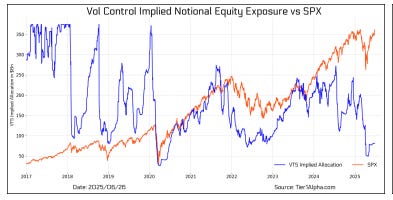
With realized volatility having fallen sharply at the 1-mth horizon and continuing to fall at the 3-mth horizon (we still have a ways to go), BOA sees vol control (volatility targeting funds) exposure continuing to slowly rebound but remain off even their lowest positioning of 2024.
They note: “vol control frameworks are likely to continue adding exposure as realized vols decline. However, we note that buying from vol control strategies is typically more gradual than the CTA moves.”

Tier 1 Alpha similar to BoA sees vol control exposure just marginally off the least since 2020 with plenty of room to move higher.
DB as a reminder sees vol control likely to continue to reengage (even as it pulled back to the 30th percentile last week) over the next month as the April Liberation Day shock recedes from the 3-mth lookback:
Systematic strategies continue to raise their exposure slowly, but remain underweight (-0.41sd, 27th percentile). As we noted last week, we just had the shortest selloff on a vol shock (vol jumping more than 1.5sd) on record. However, backward-looking vol signals continue to be impacted by the April vol shock and as it recedes from the relevant lookback windows, we expect systematic strategies to continue to raise exposure. Trend signals will also continue to move higher absent a meaningful selloff (at least -2% for the S&P 500).
Currently they see it at the 36th %ile to 2010

And after a couple of weeks of vol control modest buying (and selling) we’re now getting into April on the 3-mth realized volatility lookback, and we’ll drop both a -2% and -4.8% day this week (with some huge numbers coming next week).
The 1-mth lookback is much less favorable lapping very low volatility but given the drop we’re going to be seeing in realized volatility at the 3-mth lookback over the next month, we should be seeing a big increase in vol control buying absent high volatility in coming weeks.

And DB says vol control sensitivity to a 2% selloff has dropped significantly.

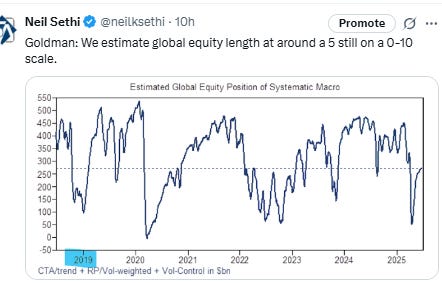
And Tier1Alpha finds overall systematic positioning continues to recover but remains under the 0 z-score (the mean since 2011).

DB sees it at the 30th %ile since 2010 (up from 24% the prior week).

And as you know, I like to look at the notional value in leveraged ETFs as a barometer of risk appetite, and both the SPX and NDX leveraged ETF positioning shot higher last week with the former the highest since November and the latter the highest since pre-2024.
Remember, this is a “constant negative gamma” source as Charlie McElligott put it in a Oddlots appearance (meaning that there is double/triple buying pressure from them as they rebalance each day). BoA estimates while they’re just 4% of end of day flows for the SPX, they’re 37% for the NDX in the last 5 minutes.

But leveraged ETF AUM in the two largest single stock ETF’s $TSLA and $NVDA both remained off the highs of the year with TSLA falling -$0.2bn to $7.7bn while NVDA edged towards the highest since March but just +$0.3bn to $5.8bn.
3rd place $MSTR +151mn to $3.0bn. $COIN has overtaken $PLTR as the fourth largest at $1.2bn (+$235mn w/w).

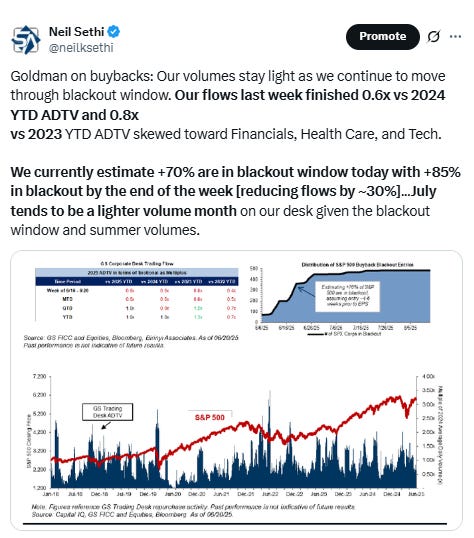
And after buybacks ended 2024 at a record, and started 2025 even better, they had slowed since April but it they’ve started to reaccelerate the past couple weeks (although note we’ve started to enter the next blackout window which runs through July 25th (but that said it only impacts around 30% of buybacks)).


And some other notes on positioning:


Sentiment
Sentiment (which I treat separately from positioning) is one of those things that is generally positive for equities when its above average but not extreme (“it takes bulls to have a bull market”, etc.) and when it’s at extreme lows (“washed out”). I had said in April “I can’t say we’re completely ‘washed out,’ but we’re a lot closer than we were a week ago.” Since then we moved pretty far in the other direction for eight weeks but the last few weeks things have been more mixed with and continued that way this week. Overall, we never got back to euphoric conditions, and they remain tilted bullish, which to me keeps it a tailwind.
AAII bears (those who see lower stock prices in 6 mths) edged back to 40.3% from 41.4% but remain up from 33.6% two weeks ago and above bulls (see higher stock prices in 6 mths) who though rose to 35.1% from 33.2%. 24.7% were neutral from 25.4%.
Those are vs the historical avgs of 37.5% (bulls), 31.0% (bears) & 31.5% (neutral).


NAAIM's (investment managers) exposure index which "represents the average exposure to US Equity markets reported by our members" and which ranges from -200 (2x short) to +200% (2x long) fell back to 81.4, a 5-week low, from 94.1, which was the highest this year, remaining though far above the 35.2 Apr 16th, which was the least since Nov ‘23. The 4-wk avg (85) also edged down from the highs of the year.
https://naaim.org/programs/naaim-exposure-index/

The 10-DMA of the equity put/call ratio (black/red line), which jumped higher last week didn’t follow stocks higher this week, instead edging lower consistent with investors showing some caution and incrementally adding downside protection as opposed to “piling in” to calls.
When it’s increasing it normally equates to a consolidation in equities and increase in volatility and vice versa.

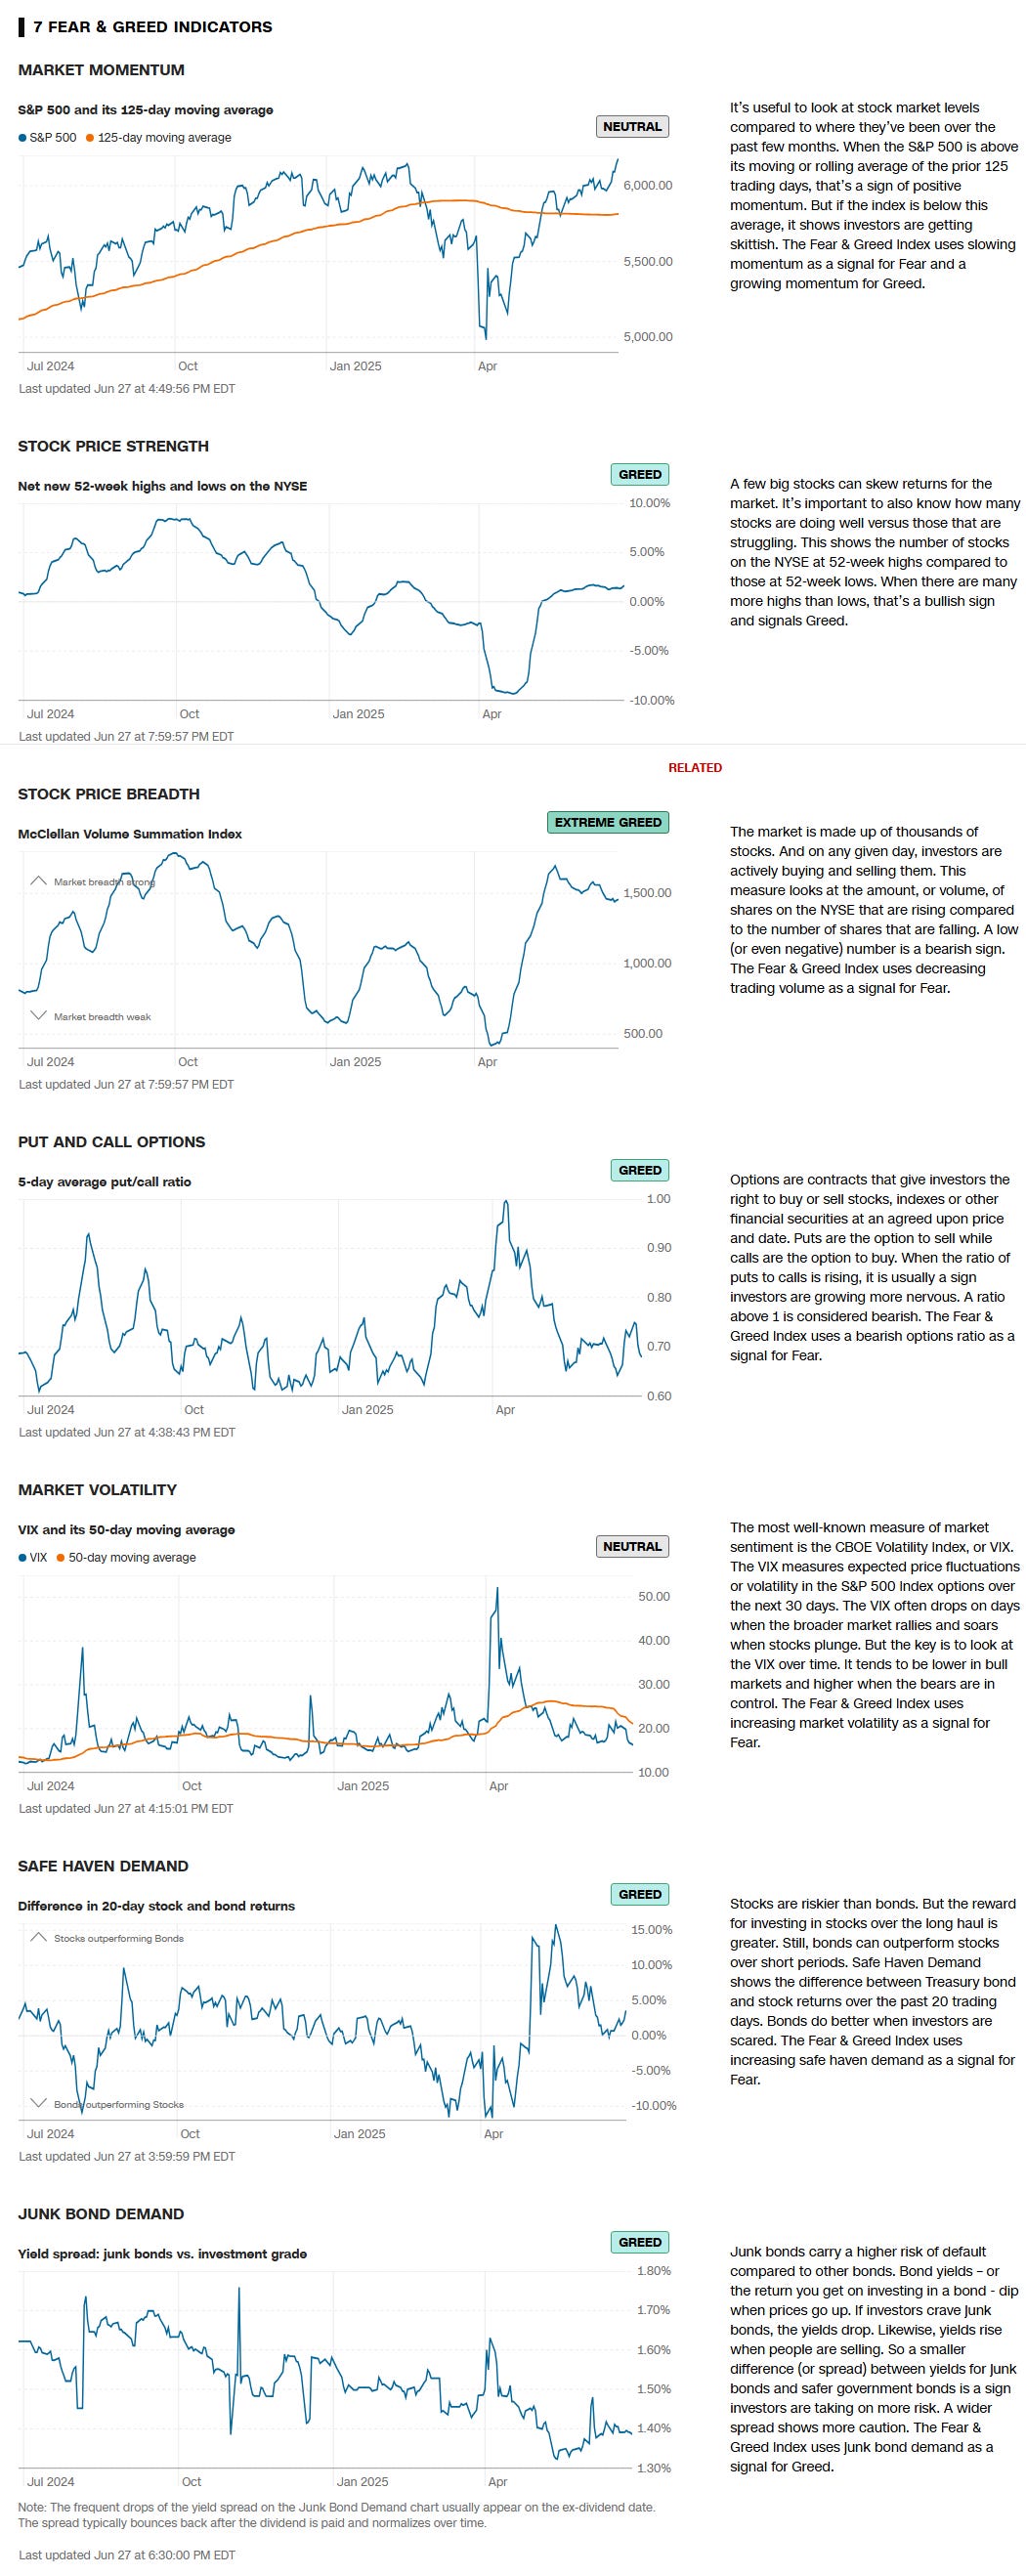
The CNN Fear & Greed Index after hitting the lowest since May 2nd the prior week at 54.1 continued to rebound from that level ending this week at 64.6 (“Greed”), up from 55.4 a week ago still though down from the 70.4 peak of the year on May 14th. Now none of the indicators are in Fear or Extreme Fear):
Extreme Greed = stock price breadth (McClellan Volume Summation Index)
Greed = stock price strength (net new 52-week highs); safe haven demand (20-day difference in stock/bond returns); put/call options (5-day put/call options) (from Fear)
Neutral = market volatility (VIX & its 50-DMA); market momentum (SPX vs 125-DMA) (from Fear)
Fear = None
Extreme Fear = None
https://www.cnn.com/markets/fear-and-greed

BofA’s Bull & Bear Indicator (a global metric), up another +0.3pts w/w, the after “largest jump since Oct'24 China stimulus,” two weeks ago now at 5.8 ("Neutral"), the highest since November and further above the 3.2 it hit at the start of the year which was what would now be a 1-yr low. Three of the six components are now “V Bullish” vs just one that is “V Bearish” (HF positioning).
The increase was “on falling FMS cash levels, strong global stock index breadth, rising inflows to risky assets such as EM equity & debt funds, offset by more bearish hedge fund positioning (CFTC data shows hedge funds adding protection against lower S&P 500).”

Helene Meisler's weekly poll bullish for the first week in three and only the second week in the past eight with 59.1% voting next 100pts higher on the SPX (up from 43.4% the prior week and the 33.2% record low six weeks ago).

No Chart Fest this week.
Note it normally includes Citi’s Panic/Euphoria Index which fell almost to the zero line at the end of April but since then has moved higher now just under Euphoria after never getting to Panic.
As a reminder, “[h]istorically...euphoria levels generate a better than 80% of stock probabilities being lower one year later.” In that regard, it first entered euphoria in late March 2024 (when the SPX was around 5200) and then reentered in late October (around 5800).
We didn’t get to 5200 by late March of this year, but we got closer than I would have thought at 5500. We’re remain below 5800. So we’ll see where we are in October.
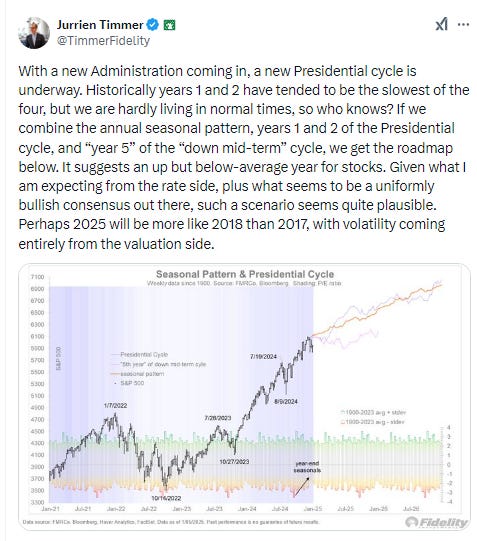
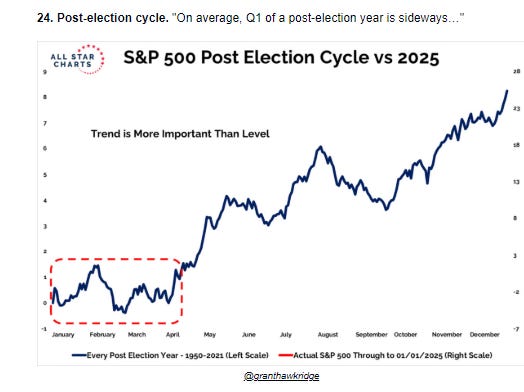
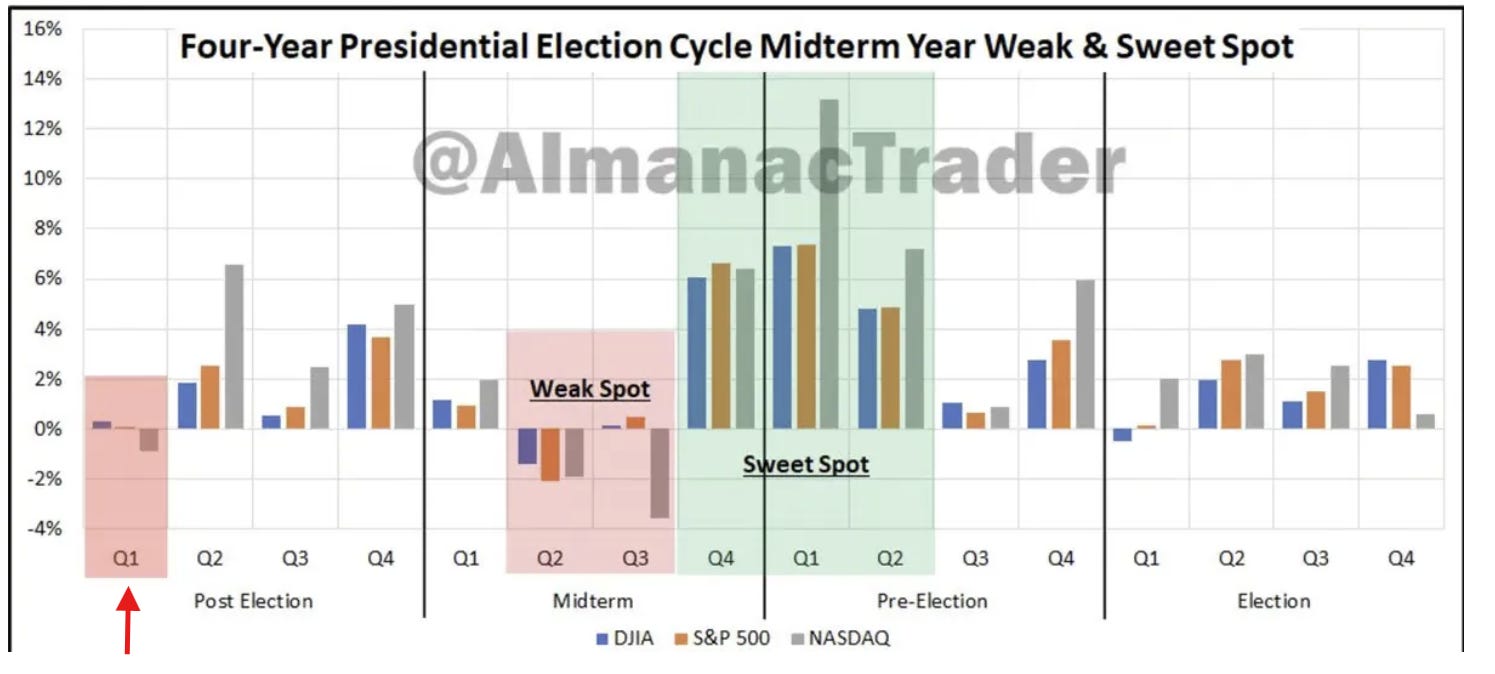
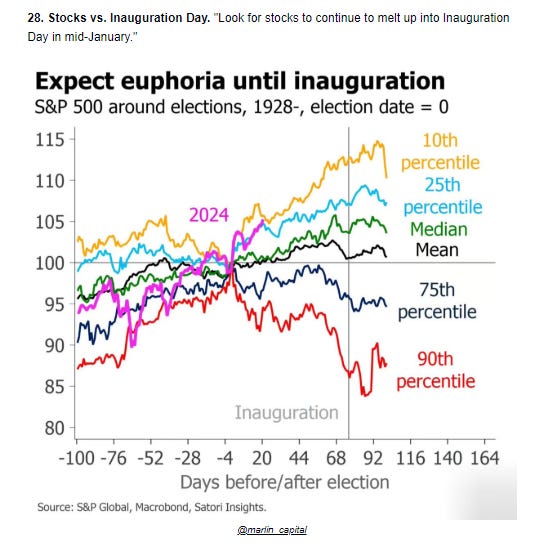
Seasonality
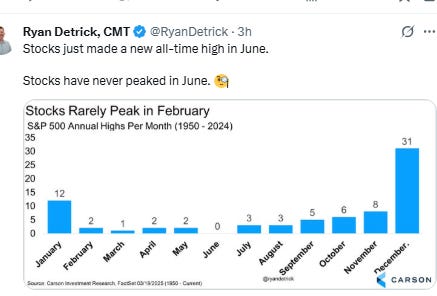
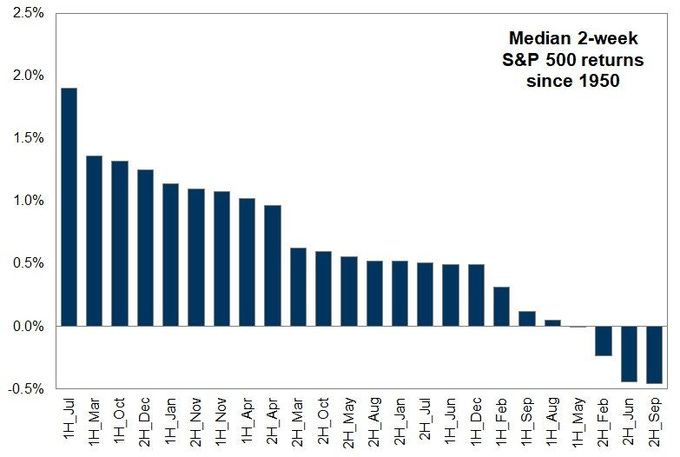
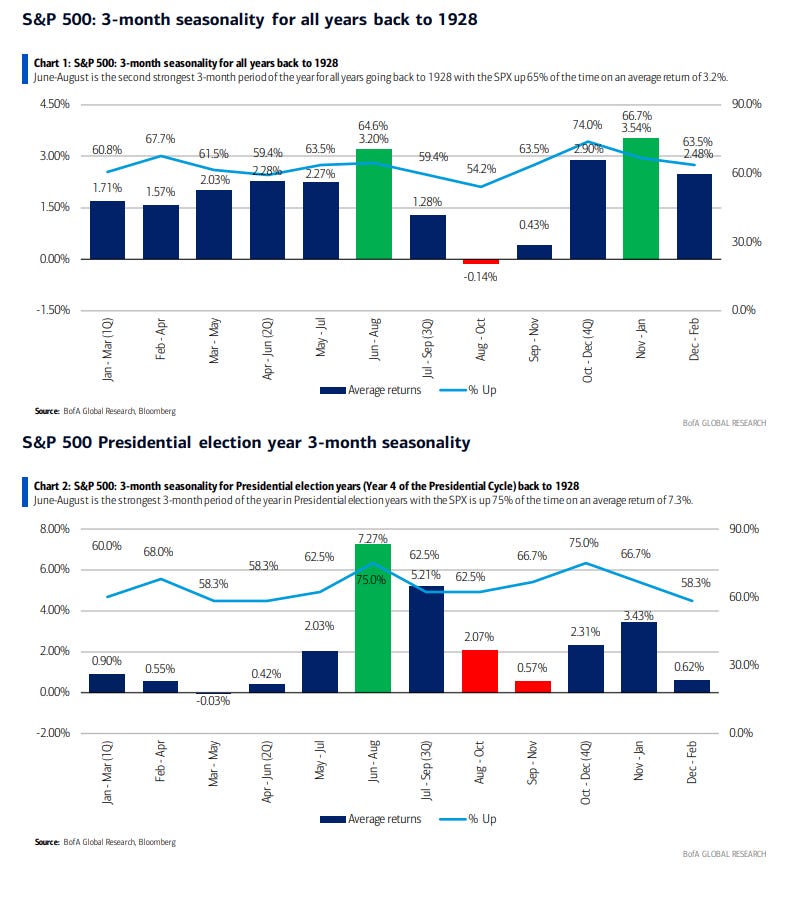
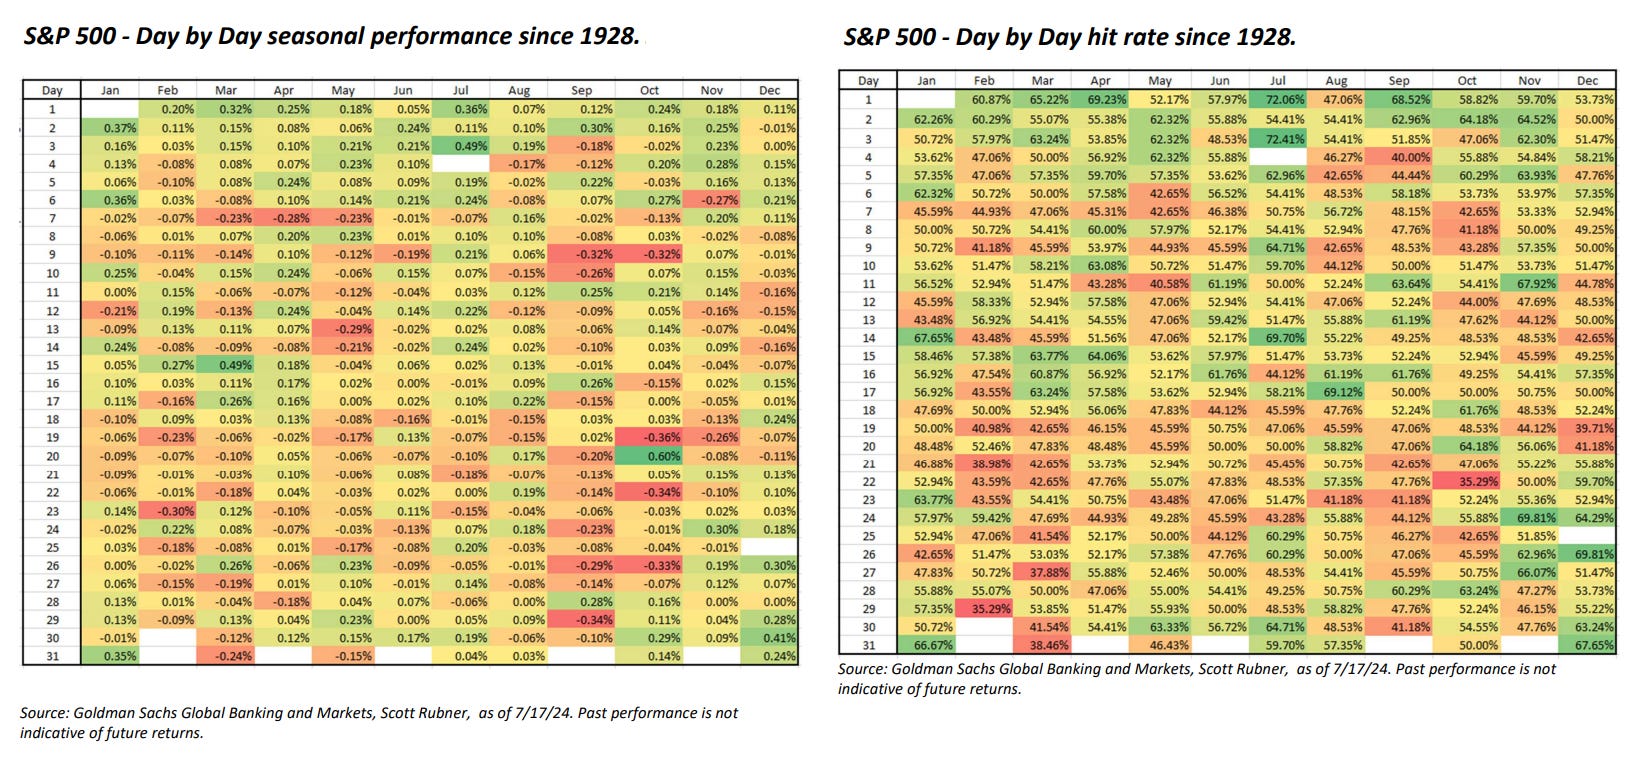
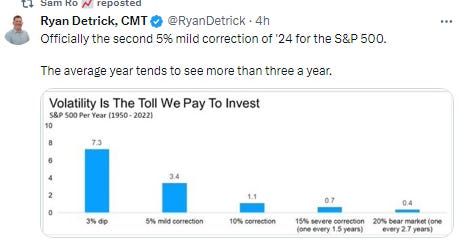
As we move into the first half of July, we enter what since 1950 strongest half month of the year at a nearly 2% median gain. That’s by far the best of all half-month periods.

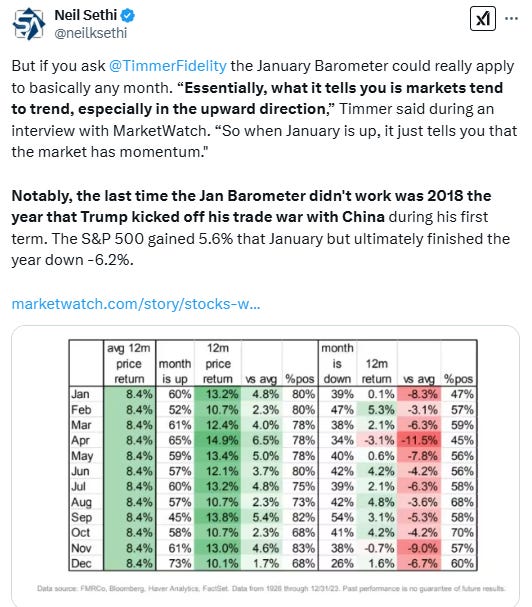
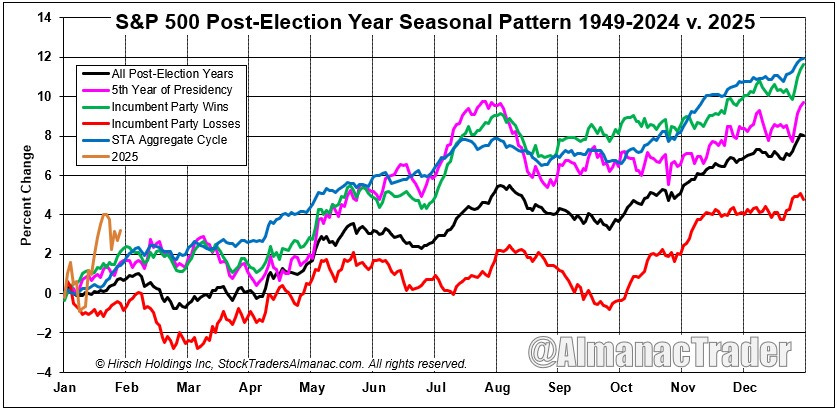
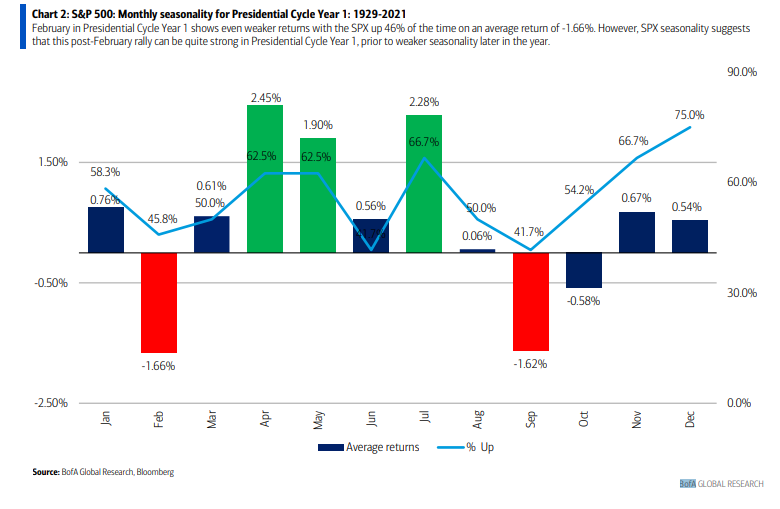
And we know that looking at July as a whole, in Pres Yr 1 it is one of the strongest months up 67% of the time with an average return of +2.28%, second only to April.

Since 1928 a similar takeaway:
The best average (1.55%) and median (1.92%) gain of all first/last 2-week periods with the 2nd best hit rate (69.1%). Volatility (standard deviation is around the middle of the pack (3.38%, 10th lowest among all periods) although a littl ebelow the 3.5% avg/median.

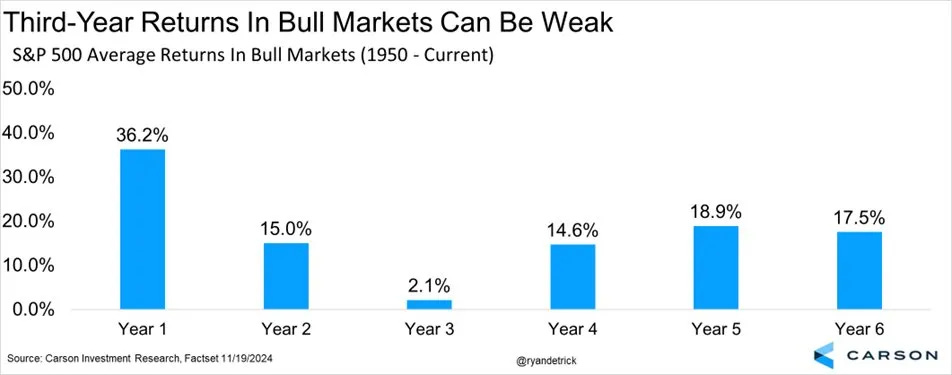
The only negative is that the average Pres Year 1 peaks in July and falls around -8% by the end of the year from the peak.

As always, though, remember that seasonality is like climate. It gives you an idea of what generally happens, but it is not something to base your decision on whether to bring an umbrella (as the Santa Rally showed us).”


Final Thoughts
I noted at the start of the year,
As we turn the page into the new year, we’re presented with a very different backdrop than what we saw for much of 2024 when the Fed was moving from hiking to cutting, bond yields were falling, seasonality was mostly favorable, systematic positioning was mostly a tailwind, political risk was low, valuations had room to grow, liquidity was very robust, the economy was firing on all cylinders, volatility (until early August) was more subdued, earnings were rebounding, etc.
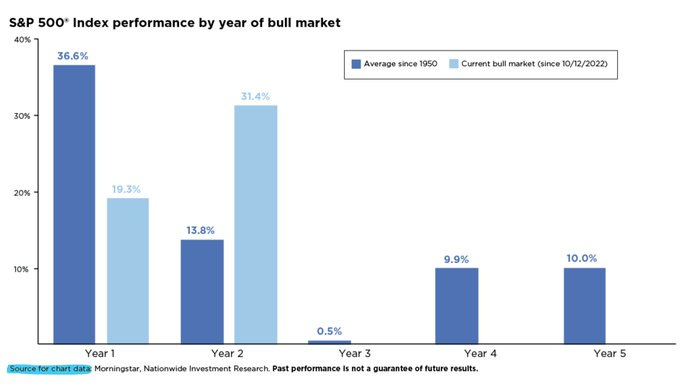
Now we’re in what is historically a more challenging year (1st year of a Presidential term and 3rd year of a bull market following two 20% years) with valuations well above where we started 2024, high expectations (judging from analyst SPX forecasts), higher volatility and political risk…higher bond yields (particularly real yields), a Fed talking more about fewer than more cuts and continuing to drain liquidity that is now hitting levels we’ve run into issues in the past, high earnings expectations, etc.
It doesn’t mean that we can’t have a good or even a great year. Balance sheets remain very solid as does the economy and labor markets (even if slowing), earnings are expected to be very good, buybacks are expected to be a continued tailwind, there’s a lot of scope for the Fed to become less hawkish, the upcoming administration may provide big tailwinds in tax cuts, deregulation, etc., etc. But we need to see at least some of those come through, and disappointments are not going to be welcomed given the set-up, so my expectation is for choppier markets more like we’ve seen since October than what we saw before.
But 11 weeks ago I noted that I thought
the upside is much more favorable than the downside…. The tariff issue remains the overhang over things and until things are finalized it will weigh on market, consumer, and business sentiment, and prevent any sort of truly sustainable rebound. At some point we’ll get to a resolution that will “free” the markets to react more typically to the other fundamental inputs….. Positively, we did see that Trump will, as expected, not push things too far in terms of stress on financial markets as evidenced by his pivot following stresses in the bond market (which weren’t actually all that bad outside of the move in yields (things barely registered on the Fed’s radar))…the good news is we have taken all of the “froth” out of the equity markets, which means we’ll be working from a much less extended base with plenty of “dry powder” from hedge funds, institutions, etc. And while the Fed is on hold for now, they still have a bias to cut, and the economy (and most importantly labor markets) remain for now healthy.
And then 6 weeks ago,
and things continue to progress better than I think most anyone thought they would, even with institutions still remaining relatively low in positioning as noted in the Flows/Positioning section. As they continue to catch up to the market, it will be an additional boost. Sentiment has turned markedly more bullish but isn’t quite yet what I’d consider a headwind. Earnings expectations have continued to deteriorate, but so far markets haven’t paid much attention. That said, valuations are getting back up towards frothier levels which may present a headwind before too long. Markets can only outrun earnings for so long. The Fed also doesn’t remain particularly friendly to the markets, but again for now stocks have seemed ok with that. We’ve also run a long way in a short period of time, so some consolidation at some point would be expected.
But as I said, “things look far from dire, meaning just as we can’t take for granted this is not a bear market rally, we shouldn’t take for granted this is not going to end up leading to new highs.” … a lot of course also depends on President Trump. The markets have rode a wave of more positive policy (trade deals, progress on tax legislation, etc.), and with Trump saying twice recently it was a good idea to buy stocks, I think we’ve established a “Trump put” at those levels. That said, as I noted last week, “it is just this sort of calm that Pres Trump has in the past sought to use to inject changes in policy, so that’s something to watch out for.” That continues to be the case.
And while as noted five weeks ago President Trump did take advantage of the equity recovery to inject a broadside against both Apple and the EU (which we’re perhaps seeing to some extent again with Canada), he dialed it back almost immediately, which perhaps indicates as I noted then he’s losing his taste for “pain” associated with the tariffs and is wanting to move along to more market (and politically given the upcoming midterms) friendly items such as tax cuts and deregulation. It seems that escalatory statements now are more to move towards resolution than intended to provide policy guidance. If so, this is a definite market positive. We’ll get a lot more information on that front in the next two weeks. That said, with markets at all-time highs, the likelihood of escalation on his part is definitely higher.
And while as also noted five weeks ago, some systematic traders (particularly CTAs) and hedge funds have started to bring their positioning back to more neutral levels, overall systematic positioning (including the large group of volatility targeters including risk parity) remains low historically and institutions (funds, etc.) in particular remain very low on net exposure (although they have dialed back their short positions). This still leaves them both in a position that sooner or later they will need to “catch up” if the rally continues and/or volatility continues to die down (and with less to sell if it doesn’t).
But as mentioned last week we are heading into the corporate buyback blackout which will increase as we move through June and into July which will be a headwind, especially with retail and hedge fund buying having cooled (but remaining positive, and it seems that “buy the dip” remains as strong as ever which should hopefully keep pullbacks contained for now).
Valuations continue to be a bit of a headwind as well, but technicals, sentiment, and seasonality have all turned from less to very favorable, and the indices have regained the momentum that appeared to be flagging a week ago. Add to that a Fed that seems to be pivoting to cutting rates sooner than we thought following the June FOMC, an increasing likelihood of the Trump tax bill making it through with a fair amount of stimulus, and an upcoming earnings season which seems from all appearances to have been a good one for many (particularly the largest) companies despite the tariff headwinds, and the recipe for continued gains seems favorable.
Just the sort of environment, as mentioned though, Trump has utilized in the past to “renew escalations” in market unfriendly areas as Deutsche Bank put it.
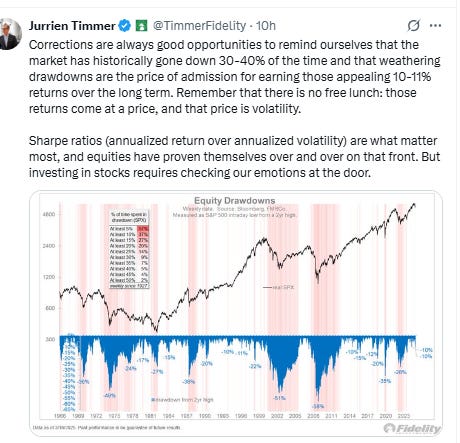
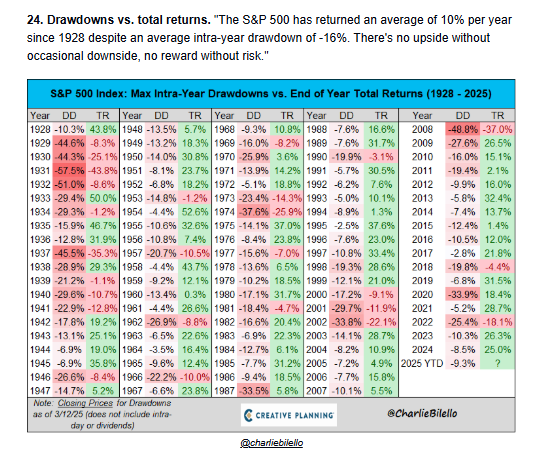
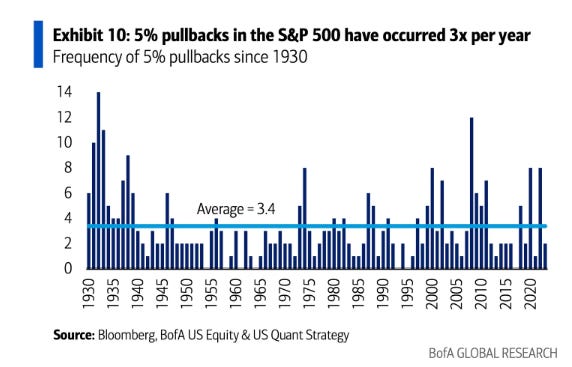
And in the long term, as always just remember pullbacks/corrections/bear markets are just part of the plan.


Portfolio Notes
BTI position was called away as well as a quarter of AM. I will sell puts on AM for what was called away on any decent pullback.
Cash = 30% (held mostly in SGOV & BOXX (BOXX mimics SGOV but no dividend, all capital appreciation so get long term capital gains if you hold for a year)
Bonds/Fixed Income (mostly short duration like MINT, SHY, ICSH, etc., but also 3% or so in longer term (TLH, TLT)) = 20%
Core equity positions (each 5% or more of portfolio (first 2 around 10% each, total around 25%) Note the core of my portfolio is energy infrastructure, specifically petroleum focused pipelines (weighted towards MLP’s due to the tax advantages). If you want to know more about reasons to own pipeline companies here are a couple of starter articles, but I’m happy to answer questions or steer you in the right direction. https://finance.yahoo.com/news/pipeline-stocks-101-investor-guide-000940473.html; https://www.globalxetfs.com/energy-mlp-insights-u-s-midstream-pipelines-are-still-attractive-and-can-benefit-from-global-catalysts/)
EPD, ET, PAA
Secondary core positions (each at least 1% of portfolio, less than 5%)
ENB
And the rest of the top 20 (all >0.5%, less than 1%):
GILD, XOM, SCHW, VNOM, ARCC, MPLX, HYD, IBIT, AM, CTRA, OXY, NEM, RRC, AMZN, BOND, ING, PFE, GSK, CHWY, AGNC, BIP, CMCSA, VOD, BIP, AR, VZ, GLD, RHHBY, URNM, OWL, MSFT, DVN, VICI, GOOGL, BAYRY, SLB
High quality, less conviction due to valuation
Note: EPD, ET, MPLX, PAA all issue K-1s (PAGP is the same as PAA but with a 1099).
Reminder: I am generally a long term investor (12+ month horizon) but about 20% of my portfolio is more short term oriented (just looking for a retracement of a big move for example). This is probably a little more given the current environment. I do like to get paid while I wait though so I am a sucker for a good well supported dividend. I also supplement that with selling calls and puts. When I sell a stock, I almost always use a 1-2% trailstop. If you don’t know what that is, you can look it up on investopedia. But that allows me to continue to participate in a move if it just keeps going. Sometimes those don’t sell for days. When I sell calls or puts I go out 30-60 days and look to buy back at half price. Rather than monitor them I just put in a GTC order at the half price mark.
To subscribe to these summaries, click below (it’s free).
To invite others to check it out,