A ton of information from last week, and it just keeps going this upcoming week. I’ll continue to get through as much as I can. As usual, it was a scramble to get this out, with no time to do a full edit. Apologize for any typos, etc.
If you're a new reader or maybe one who doesn’t make it to the end feel free to take a second to subscribe now. Subscriptions help validate spending the time to create these (and I’ll have a note on pledges at the end in the Overall section).
Also please note that I do often add to or tweak this after first publishing it, so it’s always best not to go off the emailed version but to read it from the website where it will have any updates.
Recap
Here was my recap from Friday’s report:
As noted in the weekend update (which is much more in depth than the quick summaries, I encourage you to check it out if you haven’t), as with last week there’s reasons to be bullish this week (technicals, breadth, systematic flows(?)), but also reasons to be bearish (remain mildly overbought conditions, technical resistance), and some wildcards (data, global events, Fedspeak, and earnings).
So, overall, as I noted last week, earnings and data will be the big focus for now, particularly with the Fed on autopilot for the next meeting. Last week I was dubious that we could get through resistance given how overbought the market was (although we still remain overbought just not such extremes). This week I’m a little more optimistic, particularly if we can some systematic flows, but emphasis on a little. Breadth remains pretty good though (and ended the week strong) which is an additional tailwind. The beginning of the week is relatively light on data and with no Fed speakers it’s definitely possible we see a rally over resistance. Thursday and Friday will be more about reactions to the data, and all week earnings will be a moderate factor, so any of those have the potential to push us one way or the other. On the negative side, it’s a weak week seasonally, and, well, we are in a bear market for now, so all else equal the general path is down until that’s been broken. We also are still fairly overbought after not having fully reset the more extreme overbought conditions from last week.
And on Monday we did get the positive start to the week I was hoping for. It definitely took the index back over the 200-DMA, and, depending on where you draw the MOAT (Mother Of All Trendlines), we are above that as well. It’s the first close I have over the line since the start of the bear market. It also took us above the closely watched 4000 level that we haven’t closed over since Dec 13th. So no matter how you look at it, a positive day technically. And I postulated that if they haven’t already, CTA’s will be jumping on this train soon. I ended Monday with
Now is the test. Do we get the follow through buying that keeps us above for more than a day or two or do we fall back into the chop like every other time since the start of the bear market? Answer is above my pay grade, but we’ll know soon enough. We do get flash PMI’s tomorrow. I’d be surprised if they are market moving (but they might be if they come in significantly different from expectations which are for more weakness). Also a relatively big day for earnings (see below) so that potentially could impact things as well.
But on Tuesday in contrast to my thinking that the flash PMIs would be dismissed, it appears they had a sizeable impact on trading, particularly in the dollar and bond markets as both the dollar and yields fell sharply following the release (see charts in Tuesday’s wrap up) which gave a lift to equities that were in danger of breaking down (the SPX notably had fallen beneath 4000 at that point). From there equities continued to grind higher throughout the day to end little changed near their highs. They might have done better but for relatively weak earnings releases. But the recovery kept the SPX above all of those key levels identified above while the Nasdaq and NDX approach those same key levels currently (see chart in the Bloomberg section of Tuesday’s wrap-up), and the RUT is also below a key level (19,000)). I ended Tuesday with:
As noted Monday, after breaking through those well-watched resistance levels, now is the test. As I said, “do we get the follow through buying that keeps us above for more than a day or two or do we fall back into the chop like every other time since the start of the bear market?” Wednesday is free of any major data, so while earnings will be important (which we will get a lot of), the day’s action might give us some indication of which way the markets seem to want to go (and whether we are getting any of that systematic buying) as we head into the data heavy end of the week.
And earnings were in fact “important” on Wednesday, particularly those from heavyweight Microsoft (easily the second largest stock in the indices) along with Dow component Boeing. Those in addition to other weak reports noted in Wednesday’s report had stocks down early with the SPX at one point -1.5%. But whereas Tuesday the recovery was fueled by a big drop in bond yields on the back of weak PMI’s, Wednesday stocks recovered in the face of modestly rising yields (although yields still finished lower on the day). The recovery was also more impressive than Tuesday’s due to the fact that at the lows the SPX had fallen beneath all of those well watched levels (4000, MOAT, 200-DMA), making today’s action notable to me. Still it left the major indices little changed for a second day, an inconclusive result at best ahead of more earnings and some key economic data tomorrow. I ended Wednesday with
So for a second day stocks recovered from early losses to finish little changed. I’m inclined to take that bullishly (failure to break down), particularly given we broke those noted key levels during the session, breadth outperformed modestly today, and the sideways action has helped to work off some of the overbought condition we started the week with. Tomorrow, though, we get some big data, particularly 4Q GDP. That definitely has the potential to move markets, as do earnings releases once again (particularly the card companies in terms of what they see in consumer spending). So we’ll see how those come out, and if we can make some better headway towards my target of 4100.
And on Thursday we did “make some better headway towards my target of 4100” getting about halfway there on the back of better corporate news (noted in Thursday’s; summary) and no economic data that the market had a major issue with. While most data came in better than expected, each had caveats, as noted in the linked summaries. Also aiding stocks was declines in yields and the dollar during the session (although both ended higher on the day). And I also noted on a technical note that while the SPX was clear of its 200-DMA, the Nasdaq Comp was testing it’s while the RUT was testing that key 1910 level. I ended Thursday with
While we get some earnings and data tomorrow, they are less important than the releases we got today (while the personal income and spending numbers and PCE prices are important, they were incorporated into the 4QGDP number we got today, so we have a very good idea how they’ll come out (weaker consumer spending, weak business investment, in-line prices, solid incomes), and the companies reporting are a lower tier than what we got earlier this week). So there’s really no reason the rally in the SPX can’t continue to that 4100 target area, particularly as I suspect we’re going to see increasing short covering and systematic buying the further we get above the MOAT and 200-DMA. The Nasdaq and RUT are trickier due to the resistance noted at the top, but perhaps this is the time for them as well. We’ll find out soon enough.
And on Friday, that all played out pretty well. The PCE did come in roughly as expected (although it did show sticky services inflation which is something that will almost certainly come up in the Fed press conference next week), and company reports were mixed but didn’t really impede stocks from rallying. A huge day from Tesla and some other tech heavyweights flattered the indexes, but the RUT was also up four tenths of a percent. And neither higher yields nor a higher dollar had much impact, which tells me that there likely was some systematic buying going on (or at least short covering). It was enough to push the SPX up to that 4100 target before it fell back late in the day, but the Nasdaq and RUT kept more of their gains which got them over that resistance (although not by a lot), setting up for an interesting Monday.
Dollar
10-year yield
SPX
. All the major market averages finished higher for the week, with the Nasdaq Composite climbing 4.3% to rack up a fourth straight week of gains, while the S&P 500 gained 2.4%, the Dow Jones average ended up 1.8%, and the Russell 2000 +2.4%.
Flows, Positioning, Etc.
As in the week through Jan 25th, Lipper mostly saw a continuation of what we saw in the previous two weeks with global equity funds seeing continued inflows for the first time in nine weeks with strong flows into European funds again this week and a continued deceleration of outflows from US equities. And after global bond funds saw their first weekly net buying since mid-August three weeks ago week (the most since August 2021) that continued for a fourth week. One difference though was money flowing out of cash globally but into cash in the US (it was the opposite last week). Emerging markets saw a third week of large inflows. RTRS.
Refinitiv Lipper data showed global equity funds obtained $3.23 billion worth of inflows during the week, compared with $5.16 billion worth of net purchases in the previous week.
Fund flows: Global equities, bonds and money market
European and Asian equity funds received $3.15 billion and $1.36 billion worth of inflows, but investors sold about $1.14 billion worth of U.S. equity funds. Global data showed many sectoral funds were out of favor with health care, industrials and financials witnessing disposals of $1.8 billion, $695 million and $687 million, respectively.
Fund flows: Global equity sector funds
As noted, U.S. equity funds witnessed net selling, although outflows during the week stood at just $1.14 billion, the lowest since Nov. 16. It was though a tenth straight week of outflows.
U.S. growth and value funds, both saw withdrawals, worth $3.68 billion and $501 million, respectively.
Fund flows: US growth and value funds
Among sectors, health care, financials and industrials saw $1.35 billion, $857 million and $774 million worth of disposals. Materials led inflows.
Fund flows: US equity sector funds
Meanwhile, global bond funds accumulated a net $11.35 billion worth of inflows in a fourth successive week of net buying. Global short- and medium-term bond funds obtained $1.05 billion, while government bond funds drew $3.53 billion in a 13th straight week of net buying, but investors exited $160 million worth of high yield funds after two weeks of net purchases.
Global bond fund flows in the week ended Jan 25
U.S. bond funds obtained net inflows for a third straight week. U.S. bond funds obtained a net $4.89 billion worth of inflows, although a tad lower than the previous weeks $5.83 billion worth of net purchases. U.S. taxable bond funds attracted $3.75 billion worth of inflows while municipal bond funds drew a net $1.07 billion. Investors purchased U.S. short/intermediate investment-grade, general domestic taxable fixed income, and emerging markets debt funds worth $1.37 billion, $1.09 billion and $822 million, respectively.
Fund flows: US bond funds
Global money market funds suffered $12.25 billion worth of outflows, but U.S. money market funds attracted $10.75 billion worth of inflows after facing two weeks of outflows.
Among global commodity funds, precious metal funds lured $1.19 billion, the biggest weekly inflow in nine months, but energy funds had outflows of $87 million. Data for 24,502 emerging market (EM) funds showed equity funds attracted a net $5.02 billion in a third successive week of net buying, while bond funds obtained a net $3.9 billion worth of inflows.
Fund flows: EM equities and bonds
And Bank of America also strong inflows into European stocks (the fastest pace in nearly a year) as well as EM, while US equity inflows remained muted (but positive unlike the Lipper data). Bonds had a fourth straight week of strong inflows in this data as well. Hartnett noted “capitulation” in technology and health care outflows.
European stock funds had $3.4 billion of inflows in the week through Jan. 25, according to a note from the bank’s strategists led by Michael Hartnett, citing EPFR Global data. This is the largest addition since February, before these funds had 48 straight weeks of outflows. With a growing chorus of investors souring on the US, emerging-market equities outpaced other regions in the week with $7.9 billion coming in, according to the note. US stocks saw just $300 million, the first positive flow in four weeks. Among sectors, Hartnett said flows data show “capitulation” in technology and health care as the outflow trend of the past weeks was the worst since January 2019. By contrast, materials and utilities saw inflows at $700 million and $200 million, respectively. Bonds had a fourth straight week of inflows at $12.2 billion, exceeded by global equity funds with $13.9 billion coming in. Hartnett added that US money market fund assets hit all-time high at $4.8 trillion. There’s “still lots of liquidity sloshing around.”
That data was part of the weekly “Flow Show” report from BofA (FYI, I’m becoming a private client of BoA in part so I start getting this data directly). Interestingly, despite his overall bearishness, Hartnett sees likely further gains before it all falls apart. I do like the disclosure and the lava comment.
Signs point to a US “hard landing” in 2023, Hartnett and his team wrote in the note dated Thursday. Further tightening of financial conditions may be needed this spring to tip the US economy “into the recession the consensus craves,” they said. But the S&P 500 “pain trade” — typically a crowded strategy that tests the resolve of investors — will be around 4,100 to 4,200 points, or as much as 3.4% higher from current levels. “After that we sell,” the strategists wrote, citing a “moment where stock gains start dragging yields higher.”
And Deutsche Bank is even more optimistic. BBG.
A team led by Binky Chadha is maintaining its view that the S&P 500 can rise to 4,500 points by the end of the first quarter, about 12% above current levels, before slumping amid an economic contraction. That’s even as the benchmark is headed for its best January since 2019. “We view the rally as having further to go,” the strategists wrote in a note dated Jan. 25. “While a number of leading indicators have fallen steeply, raising the alarm, there are several reasons for a continued pushing out of the timing of a potential recession.” Among those are strong household and corporate balance sheets, hesitancy to fire employees and excess savings accumulated at the start of the pandemic, they said. “I wouldn’t necessarily describe it as a bullish view on fundamentals. The basic driver of the rally in our view is a positioning squeeze,” Chadha said in a separate interview on Bloomberg TV on Wednesday.
Chadha’s team expects the S&P 500 to fall significantly when the recession begins before rebounding to 4,500 by the end of the year. The strategist said the S&P 500 can slide to as low as 3,250 — down 19% from Wednesday’s close. “A very important aspect of the recession playbook to keep in mind if you’re thinking out 12 months is that equities pretty robustly bottom about halfway through” the year, he said on Bloomberg TV. “They will come all the way back in the fourth quarter.” The Deutsche Bank team called the first-quarter rally back in November, although their 2022 year-end target didn’t pan out, with the benchmark ending the year at 3,839.50 versus their forecast of 4,750 points.
But others aren’t having it. JP Morgan strategists retained their bearish posture. HR.
Eventually, “risk markets will have to reconnect with the late-cycle backdrop.” That’s according to JPMorgan analysts led by Marko Kolanovic, who last week warned that a recession isn’t in the price for equities. The bank pointed at technical flows to explain part of the recent rally, and they’re not wrong [more on that later]. For their part, JPMorgan sees the flow drivers running out of gas, and on their view, the fundamentals aren’t supportive. “We anticipate markets struggle with the Fed, disappointing earnings and/or guidance, weak capex and worsening activity momentum,” the bank cautioned. “With new orders negative, it is difficult to see PMIs in coming months reach a level that would justify the stock performance, and the cyclical and banks rally is at odds with the current PMI trajectory,” they went on to say, adding that “in earlier quarters, we benefited from the relationship between rising PPIs and profitability as corporates could pass on price increases [but] now we face the reverse of that at a time when consumers’ excess savings are exhausted.”
BBG - And earnings are a concern for JPMorgan Chase & Co. strategist Mislav Matejka, who notes that the environment will be particularly challenging this year, with corporate pricing power starting to reverse, just as margins are near record-high in the US and in Europe. “Even if companies do not disappoint for the fourth quarter 2022, we do not believe EPS upgrades will come in the first half of this year,” Matejka wrote in a note.
As did Mike Wilson. BBG.
Morgan Stanley strategist Michael Wilson elaborated on points he made in a note to clients on Monday: Namely, that investors are failing to price in a backdrop of weakening economic data and earnings for 2023. Recent optimism around a less hawkish Federal Reserve, China reopening and a weaker dollar is already priced into share prices, he wrote. “The question is when will equity indices price the current weakness in the leading data and the eventual weakness in the hard data?,” wrote Wilson, who was the top-ranked strategist in last year’s Institutional Investor survey. “We think it’s this calendar quarter.” Wilson’s view serves as a warning sign after the S&P 500 Index rose 12% since mid-October in its recovery from last year’s bear market. The gauge looks expensive compared with average historical levels given that earnings estimates have been falling for months.
Although he’s bullish 2024 - “As bearish as we are on earnings in the near-term, we actually are probably more bullish than most in 2024 because we think we are in this boom-bust-boom environment,” Wilson said in an interview on Bloomberg TV. “If you agree with our earnings call next year then you almost have to agree with our earnings call this year and the market won’t look through that.”
And you can add Blackrock to the bearish near term bullish long term list.
An investor’s time horizon is key when gauging how 2023 developments so far affect investments. These events have upped our confidence in our strategic views on a horizon of five years and more. Economic risks like a closed China and ultra-high inflation have lessened, further underpinning our strategic overweight of stocks, as the chart shows. Equity valuations look reasonable versus our long-term expectations. The stock rally hints at how markets will likely react once inflation eases and rate hikes pause, buoying prospects for long-term corporate earnings. Yet before this outlook becomes reality, we see DM stocks falling when recessions we expect manifest. We think the U.S. economy’s 2023 calendar year growth will then be positive. Investors with a longer-term investment horizon can position for the rebound now but could see more pain to come in the near term.
We may turn more positive on stocks when the damage we see ahead is priced or our assessment of market risk sentiment shifts. For now, the fading risks after this year’s positive developments are key to our strategic views. Case in point: inflation. We have always expected it to fall as pandemic drivers – like consumer spending’s shift from services to goods – reversed. What’s key is our view of U.S. inflation landing closer to 3% than the Federal Reserve’s 2% target. Markets aren’t pricing that in. Plus, longer-term trends like aging demographics, geopolitical fragmentation and the energy transition mean inflationary pressures will be higher than in the past. Treasury yields are falling further away from where we think they’ll climb to in the long term as investors demand more term premium, or compensation for the risk of holding them amid persistent inflation and heavy debt loads. We don’t think nominal sovereign bonds can diversify portfolios anymore, and our preference for inflation-linked bonds is stronger given 2023 events. We see stock returns offering more compensation for risk than bonds.
While Tom Lee is still refreshingly Tom Lee.
And getting back to positioning the WSJ analysis of EPFR data confirms the flight to cash noted by BofA.
Investors have added about $135 billion to global money-market funds over the past four weeks, according to EPFR data through Jan. 18. That is the best stretch since the four-week period ended May 2020, when those funds logged roughly $175 billion in net inflows. The average return on U.S. money-market funds this month is 4.12%, the highest yield since the 2008 financial crisis, Crane Data show. The S&P 500, on the other hand, has a dividend yield of about 1.6%. The index is up 4.6% so far in January. By the end of December, assets sitting in money-market funds hit a record $5.18 trillion, Crane Data going back to 2006 show. That surpassed the previous high of $5.16 trillion from May 2020.
And while hedge funds remained relatively bearishly positioned as of mid-week.
Per my notes during the week, trend followers (CTA’s) are near their highs since the bear market start in US equities (red line) and well above ex-US (blue).
From Charlie McElligott (via HR, these are the flow drivers JPM was talking about “running out”):
According to Nomura’s estimates, CTAs have covered 12 of 13 legacy shorts, and are now net long again, after almost $140 billion in buying since last month. There might be room for more. Even after recent adds, exposure sits in just the 46%ile going back more than a decade. “Systematic strategies continue to increase equities exposure so far in 2023, revers[ing] last year’s FCI tightening-driven shorts and Underweights,” Nomura’s Charlie McElligott said Tuesday.
Meanwhile, the decline in three-month realized vol helped spur more than $25 billion in added equities exposure from the vol-control universe over the past three months, on Nomura’s data. Overall, vol-control’s equity exposure has almost tripled versus three months ago, but remains relatively low. “If the current vol compression holds, there would be further substantial buying from vol-control looking out two weeks to a month” assuming stocks stay a semblance of well-behaved, McElligott remarked. Of course, it’s earnings season and the tech titans will report over that two-week period, starting on Tuesday with Microsoft. If daily swings at the index level average 2% or more, the latent vol-control bid could morph into lurking sell pressure.
And while flows into the SPX have been positive in January, it appears they may be decelerating.
Yet a peek into the trading activity behind the benchmark suggests the bullish run lacks conviction. Flows into the SPDR S&P 500 ETF Trust (ticker SPY) show that, while the fund is on pace to see net inflows in January after two straight months of investors taking assets out, the total amount of money coming in weekly has been steadily declining this month. Flows into two other major funds tracking the S&P 500 — the Vanguard S&P 500 ETF (VOO) and IShares Core S&P 500 ETF (IVV) — tell a similar story.
Earnings
As earnings are a direct input into stock prices, these along with multiples are the two direct determinants into where a stock is priced. So as those go so will the market all else (the multiple) equal (see chart).
And here has been my overall message since the start of 4Q earnings season:
As I have been writing for the last couple of months,
So far there’s been been some degradation in [4Q22 and2023 earnings expectations], but they’ve held up much better than what you’d typically see in a recessionary period as we’re still talking earnings growth at this point (although decelerating).
And as I noted three weeks ago the total deterioration in estimates for 2023 has been around -8.5% from the peak, and 4Q has seen some deterioration as well. But, importantly, earnings are still forecast to be UP in 2023(by 4%, although it’s all back half loaded). That is not anything like what would be expected in a recession (and why many analysts have 2023 earnings expectations forecast to be more around the $200 mark, meaning the “feared number” is certainly lower than the $230 or so that’s estimated, setting us up for the potential for more “better than feared” earnings seasons in coming quarters). This will be one of the key questions of 2023. Do earnings hold up or don’t they. I have been in the more positive camp all year despite those who predicted an “earnings disaster” this year, and I continue to think they’ll come in at least better than feared, especially after 20% of the SPX has already preannounced (a very high rate) as noted last week. I also think there will be some good support from the weaker dollar (it was down 10% in the 4th quarter), that will hopefully offset the the impact of the 2022 tax increases (buyback tax, minimum corporate tax, etc.). Currently, expectations are for a -3.9% y/y drop in 4Q earnings which I think we’ll beat.
And while earnings have come in “better than feared” (as evidenced by the climb in equities since the start of earnings season, it has not been by much, with one of the weaker beat rates we’ve seen, and unusually seeing expectations fall for the current reporting quarter (4Q) after the start of reporting (expectations are now down to -5% y/y drop from -3.2% ahead of the season starting). Still, it’s relatively early with just 29% of companies reporting (although higher in terms of market cap). Factset updates through Thursday’s earnings:
The Q4 earnings season for the S&P 500 continues to be subpar. While the number of S&P 500 companies reporting positive earnings surprises increased over the past week, the magnitude of these earnings surprises decreased during this time. Both metrics are still below their 5-year and 10-year averages. As a result, the earnings decline for the fourth quarter is larger today compared to the end of last week and compared to the end of the quarter. If the index reports an actual decline in earnings for Q4 2022, it will mark the first year-over-year decline in earnings reported by the index since Q3 2020.
Overall, 29% of the companies in the S&P 500 have reported actual results for Q4 2022 to date. Of these companies, 69% have reported actual EPS above estimates, which is above the percentage of 67% at the end of last week, but below the 5-year average of 77% and below the 10-year average of 73%. In aggregate, companies are reporting earnings that are 1.5% above estimates, which is below the percentage of 3.3% at the end of last week, below the 5-year average of 8.6%, and below the 10-year average of 6.4%. If 1.5% is the actual surprise percentage for the quarter, it will mark the second-lowest surprise percentage reported by the index since Q3 2012, trailing only Q1 2020 (1.1%).
As a result, the index is reporting lower earnings for the fourth quarter today relative to the end of last week and relative to the end of the quarter. The blended (combines actual results for companies that have reported and estimated results for companies that have yet to report) earnings decline for the fourth quarter is -5.0% today, compared to the earnings decline of -4.9% last week and the earnings decline of -3.2% at the end of the fourth quarter (December 31).
Negative earnings surprises reported by companies in the Financials and Industrials sectors were mostly offset by positive earnings surprises reported by companies in multiple sectors, resulting in a small increase in the earnings decline for the index during the past week. Negative earnings surprises and downward revisions to earnings estimates for companies in the Financials sector have been the largest contributors to the increase in the overall earnings decline for the index since December 31. If -5.0% is the actual decline for the quarter, it will mark the first time the index has reported a year-over-year decrease in earnings since Q3 2020 (-5.7%). Four of the 11 sectors are reporting year-over-year earnings growth, led by the Energy and Industrials sectors. On the other hand, seven sectors are reporting a year-over-year decline in earnings, led by the Materials, Consumer Discretionary, Communication Services, and Financials sectors.
In terms of revenues, 60% of S&P 500 companies have reported actual revenues above estimates, which is below the 5-year average of 69% and below 10-year average of 63%. In aggregate, companies are reporting revenues that are 1.0% above the estimates, which is below the 5-year average of 1.9% and below the 10-year average of 1.3%. The index is also reporting higher revenues for the fourth quarter today relative to the end of last week, but flat revenues relative to the end of the quarter. The blended revenue growth rate for the fourth quarter is 3.9% today, compared to a revenue growth rate of 3.7% last week and a revenue growth rate of 3.9% at the end of the fourth quarter (December 31).
Positive revenue surprises reported by companies in multiple sectors (led by the Energy sector) were the largest contributors to the slight increase in the revenue growth rate for the index during the past week. Since December 31 positive and negative revenue surprises in multiple sectors have offset each other, resulting in no change in the overall growth rate. If 3.9% is the actual growth rate for the quarter, it will mark the lowest revenue growth rate reported by the index since Q4 2020 (3.2%). Eight sectors are reporting year-over-year growth in revenues, led by the Energy and Industrials sectors. Three sectors are reporting a year-over-year decline in revenues, led by the Utilities sector.
Looking ahead, analysts expect earnings declines for the first half of 2023, but earnings growth for the second half of 2023. For Q1 2023 and Q2 2023, analysts are projecting earnings declines of -3.0% and -2.4%, respectively. For Q3 2023 and Q4 2023, analysts are projecting earnings growth of 3.7% and 10.3%, respectively. For all of CY 2023, analysts predict earnings growth of 3.4%.
The forward 12-month P/E ratio is 17.8, which is below the 5-year average (18.5) but above the 10-year average (17.2). It is also above the forward P/E ratio of 16.7 recorded at the end of the fourth quarter (December 31), as the price of the index has increased while the forward 12-month EPS estimate has decreased since December 31.
During the upcoming week, 107 S&P 500 companies (including six Dow 30 components) are scheduled to report results for the fourth quarter.
Guidance though continues to be weak as “17 S&P 500 companies have issued negative EPS guidance and 2 S&P 500 companies have issued positive EPS guidance.” This has the forward 12-month EPS continuing its decline since peaking last year, although, again, the overall decline has been much less severe than what we would expect to see in a recession scenario.
And some more granular data on forward earnings from Brian Gilmartin consistent with the foregoing. That 18x P/E is starting to seem a little rich to me and while the earnings yield remains above Treasuries for now, the spread is pretty narrow. As I’ve noted many times if earnings hold up, I think we’ve likely put in durable lows at 3500ish in the SPX (which we may revisit) but if earnings continue to crack it will be more problematic. I’m particularly concerned about the expectations for a very strong 4Q23 and 2024.
The forward 4-quarter estimate (FFQE) slid again this week to $225.02 from last week’s $225.23 and the 9/30/22 $230.43;
The PE ratio on the S&P 500 jumped to 18x this week after the weekly 2.5% rally, up from the 17.5x last week, and the 15.5x from 9/30/22;
The 5.53% S&P 500 earnings yield has declined for 4 straight weeks after peaking near 5.86% on January 6th, 2023;
The Q4 ’22 bottom-up estimate slid one single penny this week to $53.26 from $53.27 a week ago. The same estimate was $57.91 on 9/30/22;
Note how 2023’s expected S&P 500 EPS growth rate has slid to just 2.8% as of this week.
….
this table is catching my interest since it a.) looks at the forward S&P 500 EPS estimates, and b.) measures the rate-of-change for said estimates over time. The 12-week rate-of-change shows the negative EPS estimate revisions becoming less severe, but note how sequential and 4-week rates of change the last two weeks have become a little more severe.
And per my comment about not being very comfortable with an 18x forward P/E, Jurrien Timmer provides some support (for not being comfortable). “At a forward P/E of 17.55x (as of last Friday), the market is trading several points above its fair value, as has been the case for a while. During last year’s bear market, the S&P 500 rarely traded below its fair value, depriving contrarians of a bell-ringing buy signal.”
And in line with most analyst expectations, margins have become to come in from record levels, although remain healthy historically, although it is the sixth straight quarter of declines. Factset.
The (blended) net profit margin for the S&P 500 for Q4 2022 is 11.4%, which is below the previous quarter’s net profit margin of 11.9% and below the year-ago net profit margin of 12.4%. However, it is equal to the 5-year average net profit margin (11.4%).If 11.4% is the actual net profit margin for the quarter, it will mark the sixth straight quarter in which the net profit margin for the index has declined quarter-over-quarter. It will also mark the lowest net profit margin reported by the index since Q4 2020 (10.9%).
At the sector level, four sectors are reporting a year-over-year increase in their net profit margins in Q4 2022 compared to Q4 2021, led by the Energy sector (to 13.4% vs. 9.3%). On the other hand, seven sectors are reporting a year-over-year decrease in their net profit margins in Q4 2022 compared to Q4 2021, led by the Materials sector (10.1% vs. 13.2%) and Financials sector (15.5% vs. 18.5%). Four sectors are reporting net profit margins in Q4 2022 that are above their 5-year averages, led by the Energy sector (13.4% vs. 7.4%). On the other hand, seven sectors are reporting net profit margins in Q4 2022 that are below their 5-year averages, led by the Communication Services sector (9.6% vs. 11.7%).
Only two sectors are reporting a quarter-over-quarter increase in their net profit margins in Q4 2022 compared to Q3 2022, led by the Financials sector (to 15.5% vs. 14.2%). On the other hand, seven sectors are reporting a quarter-over-quarter decrease in their net profit margins in Q4 2022 compared to Q3 2022, led by the Real Estate sector (35.1% vs. 37.7%). Two sectors (Communication Services and Information Technology) are reporting no change in net profit margins quarter-over-quarter.
What is driving the continuing decline in net profit margins for the S&P 500? Higher costs are likely having a negative impact on net profit margins. Producer prices increased by 6.2% in December. Again, although the number has been falling over the past several months, the percentage has exceeded 6.0% (year-over-year) for 21 straight months. During the previous earnings season, 402 S&P 500 companies cited “inflation” on earnings calls for the third quarter, which was the third-highest number in more than 10 years. Companies may be having more difficulty raising prices to offset higher costs, as the S&P 500 is reporting its lowest revenue growth for Q4 2022 (3.7%) since Q4 2020 (3.2%).
In addition, companies are facing a difficult year-over-year comparison to unusually high net profit margins in 2021. In Q4 2021, the S&P 500 recorded the fourth-highest net profit margin (12.4%) reported by the index since FactSet began tracking this metric in 2008. It is interesting to note that analysts believe net profit margins for the S&P 500 will be higher going forward. As of today, the estimated net profit margins for Q1 2023, Q2 2023, Q3 2023, and Q4 2023 are 11.9%, 12.1%, 12.3%, and 12.2%, respectively.
And Mike Wilson continues to think it’s just the start for the “profit reckoning”. HR.
“Suffice it to say, we’re not biting on this recent rally because our work and process are so convincingly bearish on earnings,” he wrote, reminding investors that the bank’s conviction doesn’t hinge on the timing of any US economic recession. Indeed, it doesn’t even hang on a recession happening in 2023 at all. Instead, it’s all about margins and negative operating leverage. In that regard, “the evidence is mounting,” Wilson said. Revenue could “fall off quickly and unexpectedly, while costs remain sticky in the short-term,” he warned, pointing to bloated inventories and “less productive headcount” as “the primary culprits.” That deleterious conjuncture is already visible in some industries even before the onset of an economic downturn. “It’s simply a matter of timing and magnitude, and we think the earnings recession is imminent,” he said, encouraging market participants to “stay focused on fundamentals and ignore the false signals and misleading reflections in this bear market hall of mirrors.” Morgan Stanley expects new lows for the S&P, after which the bear market should come to an end “later this quarter or early in Q2.”
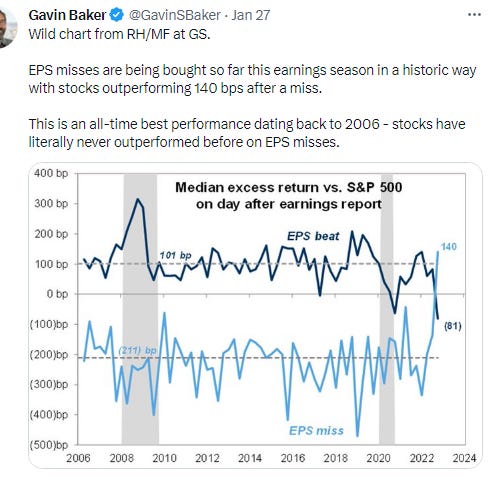
And while again it’s early, we’re seeing a weird divergence between companies that beat and those that miss.
Companies in the S&P 500 that have exceeded projections on both earnings per share and sales have outperformed the benchmark by an average of 1.45% within a day of reporting, exceeding the norm of the past six years, according to data compiled by Bloomberg Intelligence.
And those that fell short underperformed by just 1.7%, the least negative reaction in eight quarters, as many companies report taking steps to adjust to shifting business conditions.
And as a reminder here was Goldman’s estimates, a little below the median (although those have been revised down somewhat as we enter the season with expectations for a -4.6% y/y drop according to Factset as of this week.
And the reports will continue fast and furious next week. SA.
Earnings spotlight: Monday, January 30 - NXP Semiconductors (NXPI) and Whirlpool (NYSE:WHR).
Earnings spotlight: Tuesday, January 31 - Exxon Mobil (XOM), General Motors (GM), UPS (UPS), Pfizer (PFE), Caterpillar (CAT), McDonald's (MCD), Amgen (AMGN), AMD (AMD), Electronic Arts (EA), and UBS (UBS)
Earnings spotlight: Wednesday, February 1 - AmerisourceBergen (ABC), Altria (MO), Peloton Interactive (PTON), and Meta Platforms (META).
Earnings spotlight: Thursday, February 2 - ConocoPhillips (COP), Merck (MRK), Eli Lilly (LLY), Amazon (AMZN), Apple (AAPL), Alphabet (GOOG), Starbucks (SBUX), Ford Motor (F), and Qualcomm (QCOM).
Earnings spotlight: Friday, February 3 - Cigna (NYSE:CI), Regeneron Pharmaceuticals (REGN), and Church & Dwight (NYSE:CHD).
And I’ll keep these charts up for now.
Major Market Technicals
I said last week,
So another chance to move through the MOAT as it’s been described (Mother Of All Trendlines)). The good news is we’re a little less overbought than this time a week ago.
And for the first time since the start of the bear market, the SPX (and Nasdaq it turns out) was able to punch firmly above the MOAT (the RUT was already above its).
Which set it up to run to my target of 4100, which it did during the week. As with crossing the MOAT (pun intended) I don’t have firm feelings on whether the SPX can punch above 4100. That I think is more about the data in this data-heavy week than anything. Daily technicals remain very positive.
And as noted the Nasdaq (and NDX) also pushed through their MOATs as well as their 200-DMAs. Unlike the SPX though they are also above their highs from December giving them considerable room to run. Daily technicals very positive here as well.
And as noted the RUT was already above its MOAT (and 200-DMA), and now is just over its September and November highs appearing to give it a lot of room as well. Daily technicals very positive here as well.
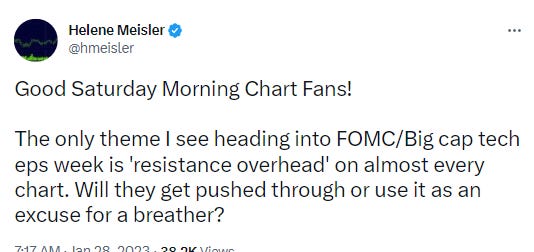
Helene’s take.
Breadth
Breadth continued to be good but not great. But good is still better than poor, and that has been enough to keep the indices moving higher. It also ended in a positive note. Here was Friday’s report:
Breadth was good, maybe the best since Monday taking both indexes together. The numbers softened from Thursday (except Nasdaq volume which improved), but the decline was modest compared with the difference in the index gains. 59% of volume was positive on the NYSE (after 64% yesterday), while the Nasdaq had 66% (after 59% yesterday). Issues were 56 and 55% (after 66 and 57%). Again, considering the index gains were much less today, those are pretty decent numbers, although nothing to write home about.
But interesting overall volumes have been weak on the NYSE while strong on the Nasdaq.
While the McClellan Summation Index (what the average stock has been doing), continues moving higher which is supportive to equities.
As does the volume based version of the Nasdaq.
While the % of stocks above 200-DMAs remains the highest its been since the start of the bear market
And new highs over lows has been strongly positive.
SPX Sectors
Sector performance last week was solidly to the upside for the third week in the last four. Only utilities and healthcare were down for the week. Consumer discretionary led on the back of a huge week for Tesla along with gains for other heavyweights (AMZN, DIS, etc.).
As you know if you read regularly, my sector theme the last few months as been around a dispersion between sectors (strong vs week).
Ten weeks ago I noted:
We’re starting to see a clearer discrepancy growing between some sectors that are below their 200-DMA and trendlines from the beginning of the year (tech, discretionary, communications, real estate), and others that are above those and are showing strong relative strength (industrials, materials, financials, staples, utilities, and energy).
Since that time, as noted last week, outside of a short consolidation by the leading sectors, not much changed except for utilities, which was unable to make headway, and staples and healthcare also started to pull back last week, although they remained above their 200-DMAs. But financials and materials had very good weeks to join industrials, staples, and energy as the clear leaders.
Last week, though, I noted
we’re seeing more glimmers of potential change as those “weakest” sectors (mostly the growth names plus real estate) outperformed. Now most of them are up to around their 200-DMAs and downtrend lines (communications still has some ground to travel). A break above those would be notable. On the flip side, the “strongest” sectors consolidated this week, but those same five sectors remain the leaders for now. Staples and utilities remain below their 200-DMAs, while health care remains above although has been declining steadily for a month.
And with the positive weeks noted above, we did in fact see tech and communications break above their 200-DMAs, while real estate and discretionary touched them on Friday but could not close over. Tech and discretionary also broke above their bear market downtrend lines while the other two are just below. So, in summary, we continue to see the lagging sectors catch up to the previous leaders who outside of utilities remain leaders.
In terms of the MACD which is my favorite technical trigger, as with last week all of the growth sectors (communications, tech, discretionary), most of the cyclicals (financials, materials, energy (industrials are neutral)), but just one defensive (real estate) are in bullish configurations (“go long” and rising). Staples, healthcare, and utilities are all in the weakest configuration (“go short” and falling). Discretionary and communications are overbought though and in need of a consolidation.
And some more charts and tweets on sectors (most from last week, just leaving up):
Economy
This week it was hard to spin reports as positive or negative for the most part. GDP beat expectations but due to a big inventory build, personal income and spending showed incomes holding up but spending weakening with prices in line but services prices accelerating, PMI’s increased but remained in contraction, durable goods were a big beat but due to aircraft with core business spending contracting for a second month, jobless claims fell but continuing claims increased, new home sales increased but only after downward revisions to previous months, pending home sales increased but remain down over 30% y/y, consumer sentiment improved but remains historically very low. The only unambiguous report (negatively) was LEI’s which continued to fall deeper into recession territory.
And the standard boilerplate on why I care about the economic indicators:
And, again, I follow the economic indicators because stock investing for me (as is probably also the case for most of you) is not my main “job” day-to-day, so I want to be apprised of what’s happening on “Main Street” as much as “Wall Street”. But, also, as I’ve noted too many times to mention, the economy has a direct feed through to stock prices via earnings. Given what you’re buying is a stream of earnings discounted at some multiple, that stream of earnings is pretty important. And every recession has seen actual earnings (not just expectations) decline at least low double digits (even the “mild” recessions and deeper recessions see the -30% or more area). So that’s why it’s important for us to pay attention to whether a recession is coming (unless this time is different). What we’ve seen so far does not qualify as a recession to me (or most economists). But if we do enter into a recession, it’s important to note that not only have stocks never bottomed in advance of a recession, but on average they don’t bottom until nine months after one has started. Of course, we’ve never seen a recession forecast so far in advance as this one, so it’s also possible, like most things this cycle, that you can throw the history book out the window in terms of when the bottom will (or has) occur vis-à-vis the recession starting.
As the Atlanta Fed GDPNow model, which did a decent job of tipping a strong 4Q number has turned to 1Q23 with a small increase.
While the Weekly Economic Index (WEI), an index of ten daily and weekly indicators of real economic activity scaled to align with the four-quarter GDP growth rate, which had fallen for the most part since February until Dec 10th when it started moving higher, getting up to 2.05% in GDP growth over the next 12 months three weeks ago but plummeted last week to +0.87%, fell further to +0.71%, the lowest since March 2021. It remains well below the 13-week trendline of 1.46%. It was 2.35% end of October, 6.16% February 19th (the peak in 2022), and 4.94% a year ago.
The decrease in the WEI for the week of January 21 (relative to the final estimate for the week of January 14) is due to falls in retail sales, railroad traffic, electricity output, and fuel sales, which more than offset increases in steel production, tax withholding, and consumer confidence and a decline in initial unemployment insurance claims.
And here’s is Goldman’s latest.
While it looks like some economists might be coming around to my thinking that a recession isn’t a done deal. Argus.
According to Reuters, the latest survey of businesses by the National Association of Business Economics (NABE) indicated a 56% possibility that the economy was in, or will be in, a recession this year versus a nearly two-thirds possibility at the time of the last survey.
The report also showed labor pressures easing and more optimism on profits. BBG.
A new survey of business economists suggests US job market conditions are beginning to soften, with firms indicating an easing of labor shortages and a pullback in hiring expectations. A National Association for Business Economics survey showed about a third of respondents say their firms are not facing any labor shortages, and nearly 20% expect employment at their company to fall in the coming months. “For the first time since 2020, more respondents expect falling rather than increased employment at their firms in the next three months,” NABE President Julia Coronado, founder and president of MacroPolicy Perspectives LLC, said in a statement. “Fewer respondents than in recent years expect their firms’ capital spending to increase in the same period.” Only 12% of those surveyed think headcount will rise in the next three months — less than half the share that said their companies had increased employment over the past three months. The survey of 60 NABE members was conducted Jan. 4-11. That said, respondents are slightly more optimistic about future profits, with over half expecting margins to remain unchanged in the next three months, and a smaller share expecting them to decline.
Up Next
But others agree the risk seems to be falling.
As do markets (also seem to agree the risk of recession has fallen).
Although that’s not atypical heading into a recession (“one final bounce”).
And even the more bearish are acknowledging the strength in pushing out their recession calls.
Morgan Stanley economists are sticking by their call for a “softish” landing in the US and reckon even if there is a recession it will be milder than most. In a Monday report to clients, economists led by Seth Carpenter said “it is far too soon to declare victory” given higher Federal Reserve interest rates take time to bite. But the US labor market has proved stronger than anticipated and “inflation has turned down decisively,” they said. “We continue to think that even if our baseline view is wrong, any recession that might come this year would likely be shallow,” the economists wrote. “A far cry from the 2008 recession to be sure, and probably mild even relative to the 1991 and 2001 recessions.” Among the reasons for that optimism: Businesses are loathe to lay off workers after discovering how hard it is to hire and corporate balance sheets are in strong shape so a credit crunch can be avoided. While a global slowdown is also underway, “it’s not looking like a disaster,” the Morgan Stanley economists said.
And we got some more regional PMI reports.
The Richmond Fed Mfg index fell under expectations with new orders falling sharply. Each of its three component indexes: shipments, new orders, and employment declined, with the index for new orders plummeting from −4 to −24 in January. Employment also turned mildly negative (orange line). More positively, prices continued to decelerate.
Fifth District manufacturing firms reported some deterioration in business conditions in January, according to the most recent survey from the Federal Reserve Bank of Richmond. The composite manufacturing index fell noticeably into negative territory, decreasing from 1 in December to −11 in January. Each of its three component indexes: shipments, new orders, and employment declined, with the index for new orders plummeting from −4 to −24 in January. Alongside a slightly negative employment index, the wage index increased from 37 to 41 in January. The local business conditions index also decreased somewhat, moving further into negative territory with a reading of −13 in January. Although the local business conditions expectations index rose slightly from December, firms generally reported pessimism about conditions over the next six months. January survey results indicated continued easing of supply chain constraints. The index for order backlogs retreated further into negative territory, indicating that businesses continued to see declining backlogs. Meanwhile, the index for vendor lead time also remained well below 0, suggesting a continued decline in lead times. The average growth rates of both prices paid and prices received decreased in January. Expectations for both price growth measures over the next 12 months also decreased to a level much lower than last year.
While the service sector report also remained in contraction territory but in this case improving slightly. Employment was positive here but prices paid also accelerated slightly.
Fifth District service sector activity improved slightly but remained soft in January, according to the most recent survey by the Federal Reserve Bank of Richmond. The revenues and demand indexes both rose to −6 from −12 and −8, respectively, in December. Firms' expectations for revenues and demand over the next six months also improved somewhat in January. Similarly, firms' assessments of current and anticipated local business conditions improved slightly but remained low. Most firms reported continued spending in capital, equipment/ software, and services, but the share of firms increasing capital and equipment/software spending decreased from last month. A larger share of firms reported increased hiring in January, with the employment index rising from −2 to 9. Nonetheless, firms' ability to find workers with the necessary skills saw little improvement as the index remained unchanged at −10 in January. Firms continued to increase wages and expect further wage increases in the near term. Average growth in prices paid increased slightly in January, while growth in prices received decreased somewhat. Firms expect both to moderate over the coming year.
And we also got the Philly Fed services index which also improved to +12.7 from +8 in December. The indexes for general activity at the firm level, sales/revenues, new orders, and full-time employment all rose. Firms continued to report overall increases in both prices paid and received; however, increases in prices paid were less widespread than in recent months. The respondents continue to anticipate growth over the next six months.
And the Chicago Fed does a sort of PMI on economic conditions which improved in January from its most negative since the pandemic but remaining well under the 0 dividing line of increasing versus decreasing economic activity. The outlook though deteriorated with 59% of respondents expecting lower economic activity over the next year.
The Chicago Fed Survey of Economic Conditions (CFSEC) Activity Index increased to –27 in January from –40 in December, suggesting that economic growth was well below trend. The CFSEC Manufacturing Activity Index increased to –16 in January from –44 in December, and the CFSEC Nonmanufacturing Activity Index increased to –31 in January from –38 in the previous month.
• Respondents’ outlooks for the U.S. economy for the next 12 months deteriorated slightly, and remained pessimistic on balance. Fifty-nine percent of respondents expected a decrease in economic activity over the next 12 months.
• The pace of current hiring decreased, as did respondents’ expectations for the pace of hiring over the next 12 months. Both hiring indexes remained negative.
• Respondents’ expectations for the pace of capital spending over the next 12 months increased, but the capital spending expectations index remained negative.
• The labor cost pressures index increased, as did the nonlabor cost pressures index. The labor cost pressures index moved into positive territory, while the nonlabor cost pressures index moved up to a neutral value
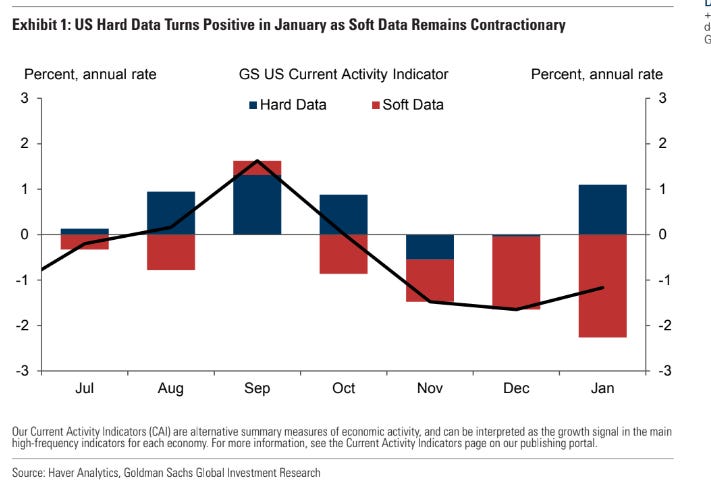
But overall according to Goldman forward looking components are “firmly in expansion territory”.
And I like to look at the credit card company reports. Here’s some takeaways. BBG.
Visa Inc. and Mastercard Inc. saw purchase volumes on their cards climb less than expected in the final three months of the year, a sign that historic levels of inflation have begun to put a damper on consumer spending. Spending on Visa’s cards climbed 1.7% to $3.01 trillion in the company’s fiscal first quarter, missing the $3.16 trillion average of analyst estimates compiled by Bloomberg. At Mastercard, volumes jumped 11% to $1.73 trillion, also missing estimates. So far, both companies have said inflation hasn’t weighed on consumers’ overall spending patterns. Instead, card customers have shifted their spending to lower-cost items or generic brands. The two companies have said they continue to get a boost from spending on travel and dining out with pandemic-related restrictions easing globally. “As we look at the broader economy, we see the continued recovery of cross-border travel, with volumes up 59% versus a year ago and we’re encouraged by Asia opening up further,” Mastercard Chief Executive Officer Michael Miebach said in a statement announcing his company’s fourth-quarter results earlier Thursday.
While total volume on AmEx’s network increased less than expected in the final three months of last year, the record number of new cardholders AmEx added in 2022 should help revenue climb as much as 17% in 2023, the company said. That’s higher than the 11% analysts in a Bloomberg survey were expecting. “It’s a premium customer base, and that premium customer base, while not immune to economic downturns, certainly right now is spending on through,” Chief Executive Officer Stephen Squeri said on a call with analysts Friday. “This is a premium card member base that appreciates premium products and is spending.”
And in a sign of the pressures of high interest rates and a cooling economy, more Americans are falling behind on their car payments than during the financial crisis. I think this is being exacerbated by last year’s sky-high prices which resulted in many car owners now underwater on their loans. BBG.
In December, the percentage of subprime auto borrowers who were at least 60 days late on their bills rose to 5.67%, up from a seven-year low of 2.58% in April 2021, according to Fitch Ratings. That compares to 5.04% in January 2009, the peak during the Great Recession. The average new auto loan rate was 8.02% in December, up from 5.15% a year earlier, according tao Cox Automotive. The rate can be much higher for subprime borrowers. While the number of vehicle repossessions is rising, it’s still below pre-pandemic levels. At Manheim, an auto auction company, the number of repossessed cars increased 11% in 2022 compared to the prior year, but that was still down 26% from 2019.
Real Estate
As Mike Simonsen after seeing glimmers of hope in his data last week sees more this week.
And the largest homebuilder is optimistic.
And even John Burns who has been pretty bearish almost sounded constructive.
And building costs are also coming down.
And I also noted in the Economic section the housing reports which had some indications of potential stabilization in the housing market. Redfin also reports signs of recovery.
The housing market has begun to recover after hitting a low point in the second week of November. We’re not out of the woods yet, but homebuyers are coming off the sidelines: The number of Redfin customers requesting first tours has improved 17 percentage points from the November trough, and the number of people contacting Redfin agents to start the homebuying process has improved 13 points. Compared with a year ago, home tours and requests for service are down 23% and 27% respectively, but that’s an improvement from the November trough, when both were down 40%. This is already translating into more home sales. Redfin agents report that bidding wars are back in some markets, including Seattle, central Florida and Richmond, VA. Homebuyer demand remains down from its early 2022 highs, but the market has shifted into a new phase and well-priced listings are selling quickly.
Buyers have acclimated to the 6% mortgage rate, which feels like a relief after watching affordability erode as rates surpassed 7% in the fall. Some buyers are even scoring a rate that starts with a five, an important psychological threshold, while others are opting for an adjustable-rate mortgage or getting a rate buydown as a seller concession. While demand is coming back in some pockets of the country, it’s selective: Homes that are eliciting bidding wars tend to be affordable, suburban, single-family, move-in ready and most importantly, priced competitively. Most everything else is sitting. Even though homebuyer demand is improving, the main factor driving bidding wars is low inventory. It’s not surprising that sellers are slower to embrace the shifting market, as buyers tend to react first to falling mortgage rates, with sellers following suit months later. This effect is likely to be pronounced in 2023: Would-be sellers are more sensitive to elevated rates because 85% of mortgage holders have a rate far below today’s level of roughly 6%. This “lock-in” effect and still-high rental prices are motivating many potential move-up buyers to become landlords instead of home sellers. Redfin agents have also observed in their conversations with homeowners that there’s fear around listing at a time when home-price growth has been shrinking and buyers are regaining power.
Condos and higher-priced homes are still a struggle to sell. Redfin agents report that sellers of expensive homes and condos are offering buyers incentives to close deals.
The factor most likely to slow or reverse the housing market recovery is that there are too few homes for sale, which could hold back total sales volumes and price people out of homebuying. Even though housing costs are declining, they remain significantly higher than they were two years ago. Home prices will likely be sticky this year in many places where there are still plenty of stale listings; once they finally sell they will hold back price growth while overall low inventory keeps prices from going down much.
And after the huge jump (28%) in the prior week, the weekly MBA Mortgage Applications Index saw another fairly large jump in the third week of January (+7%) led by refis (+15%). Purchases though fell -1% w/w. They are down -77% and -39% y/y respectively. This week’s results included an adjustment for the observance of Martin Luther King, Jr. Day.
US MBA Mortgage Applications Jan 20: 7.0% (prev 27.9%) - US 30-Yr MBA Mortgage Rate Jan 20: 6.20% (prev 6.23%)
“Mortgage rates declined for the third straight week, which is good news for potential homebuyers looking ahead to the spring homebuying season. Mortgage rates on most loan types decreased last week and the 30-year fixed rate reached its lowest level since September 2022 at 6.2 percent,” said Joel Kan, MBA’s Vice President and Deputy Chief Economist. “Overall applications increased with both gains in purchase and refinance activity, but purchase applications remained almost 39 percent lower than a year ago. Homebuying activity remains tepid, but if rates continue to fall and home prices cool further, we expect to see potential buyers come back into the market. Many have been waiting for affordability challenges to subside.” Added Kan, “Despite a 15 percent increase in refinances, they were still 77 percent behind last year’s pace, as rates remained more than two percentage points higher, thus providing very little refinance incentive for most borrowers who are locked into lower rates.” ... The average contract interest rate for 30-year fixed-rate mortgages with conforming loan balances ($726,200 or less) decreased to 6.20 percent from 6.23 percent, with points increasing to 0.69 from 0.67 (including the origination fee) for 80 percent loan-to-value ratio (LTV) loans.
And some charts from Goldman on the housing market.
And more evidence of the convergence of low and high priced sales.
And apartment leasing perhaps has bottomed as well.
As delinquencies remain low.
While over in the commercial area the Architecture Billings Index (ABI) from the American Institute of Architects (AIA) remained in contraction territory in December although improving slightly to 47.5 from 46.6 (any score below 50 indicates a decline in firm billings). Inquiries into new projects posted a positive score of 52.3, however new design contracts remained in negative territory with a score of 49.4.
“Despite strong revenue growth last year, architecture firms have modest expectations regarding business conditions this coming year,” said AIA Chief Economist Kermit Baker, PhD, Hon. AIA. “With ABI scores for the entire fourth quarter of 2022 in negative territory, a slowdown in construction activity is expected later this year, though the depth of the downturn remains unclear.”
Regional averages: Midwest (49.4); South (48.6); Northeast (46.5); West (45.5)
Sector index breakdown: mixed practice (54.8); institutional (47.3); commercial/industrial (45.2); multi-family residential (44.3)
The regional and sector categories are calculated as a three-month moving average, whereas the national index, design contracts and inquiries are monthly numbers.
Subscribe for free to receive new posts and support my work.
Commodities/Currencies/Bonds
Bonds/Rates/Credit
The big events for the bond markets this week were the GDP and PCE reports (and perhaps the inflation expectations) which all came in pretty much as expected (although services prices in the PCE report were a little elevated as discussed in that report). So it’s not a big surprise that yields didn’t do much this week. The 10-yr ended at 3.52%, and the 2-yr 4.21%.
Which saw the 2-10 curve remain inverted but off the most negative levels (but still the lowest since the ‘80’s , while the 3 mos/10 yr curve (generally considered a better recession indicator than 2/10), remained at “since-1981” extremes and will continue to become more inverted as short rates will continue to climb until the market is convinced the Fed is done hiking.
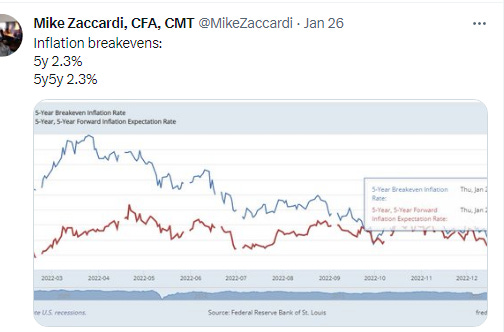
And breakevens continue to remain very subdued.
But not all are so sanguine. BBG.
Some of the world’s largest asset managers such as BlackRock Inc., Fidelity Investments and Carmignac are warning markets are underestimating both inflation and the ultimate peak of US rates, just like a year ago. “Inflation is here to stay,” said Frederic Leroux, a member of the investment committee and head of the cross asset team at €44 billion ($47 billion) French asset manager Carmignac in a phone interview. “After the crisis central bankers thought they could decide the level of interest rates. In the past two years they realized they don’t: inflation does.” He added that one of the biggest mispricings in the market today is the expectation that inflation will come down to 2.5% next year, before adding that the world is entering a macroeconomic cycle comparable to between 1966 and 1980. That period saw energy shocks that drove US inflation into double digits twice.
Analysts at BlackRock’s Investment Institute also see high inflation persisting, with little hope that a recession will spur the Fed to cut rates. Instead, they expect the Fed to taper its outsized hikes into smaller ones as the pain of the economic slowdown becomes clear, even if inflation stays above the bank’s 2% target. “Central banks are unlikely to come to the rescue with rapid rate cuts in recessions they engineered to bring down inflation to policy targets. If anything, policy rates may stay higher for longer than the market is expecting,” a team of analysts including Jean Boivin, the head of the Institute, wrote last week. BlackRock is underweight developed market equities and it prefers investment-grade credit to long term government bonds.
Not all funds agree of course. Dutch asset manager Robeco, with €246 billion under management, takes the view that 2023 will be the peak for rates, the dollar and also inflation. This is mainly because of its expectations for a recession and policy makers’ inability to engineer a soft landing, which it thinks will spark rate cuts.
Personally, I think this (whether inflation continues to head lower and can crack under the 3-4% area) along with earnings are the biggest stories for 2023 outside of the Ukraine war (due to its global implications). I had been saying for much of December that I thought yields were too low if the Fed is going to 5%. I had said I would not be surprised to see the 10-year hit 4% and the 2-year at least 4.75 if not 5%. Remember the 2-year has never peaked below the ultimate terminal rate. The peak in the 2-year so far has been 4.73%. That said, as I noted two weeks ago Bloomberg Intelligence believes if the terminal rate were to be 5.5% their model says fair value on a two-year would be 4.6%. That combined with market expectations that the Fed won’t get over 5% has me starting to think we might have seen the peaks in rates. And as I noted last week more strategists agree with that view. Bloomberg sees 3% in the 10-year by year-end and Morgan Stanley now 3.15%. That would be great, but as of now I remain unconvinced, and I think it’s not unlikely the Fed holds rates at or around 5% through 2023 which I think will at some point pull up those rates. This is why inflation reports will remain a top data point this year.
In terms of expectations regarding the Fed, the expected terminal rate pricing remained around 4.9% this week. Swap traders continue to see a peak in March, although the percentage seeing no hike in March fell slightly to 15% from 20% last week although up from 10% two weeks ago. The first cut though remains in November, something I’m quite sure Jerome Powell will be looking to push out Wednesday. The February meeting is a done deal on a 25bps hike as I noted last week. More interesting will be the press conference and the discussion around “how high” and for “how long” (in particular will Powell commit to another hike at this point or keep it “data dependent”). In terms of how long as noted he’ll try to make it clear the Fed has no intention of cutting anytime soon to try to talk down the markets. For sure he will be looking to avoid anything that will further rally the stock and bond markets further loosening financial conditions (noted later). You’re likely well apprised of the run equities have had in January, but bonds have as well with benchmark 5- and 10-year yields having dropped around 40 basis points in January.
And as we move through the year, here are a couple of Fed cheat sheets that I’ll keep up.
And this is an interesting development. We’ll have to see how it unfolds.
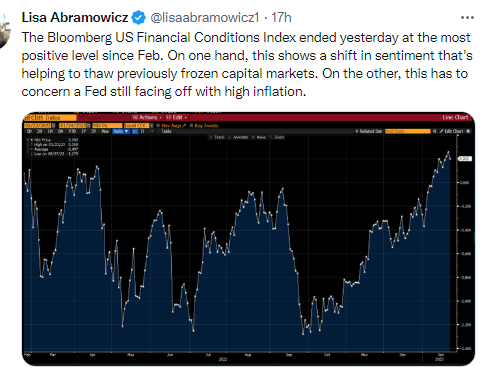
And financial conditions continue to ease.
Something Larry Summers says the Fed should be concerned about. HR.
Summers … flagged the recent easing in financial conditions documented above. “In a way, the monetary impulse that’s coming into the economy is much less contractionary than you would think just looking at Fed funds,” he said, calling that something the Fed may want to be concerned about.
As interest rate volatility continues to move lower which should hopefully help liquidity.
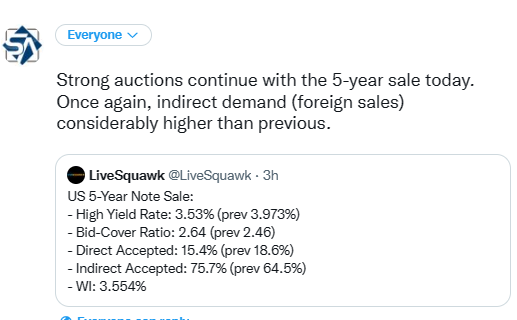
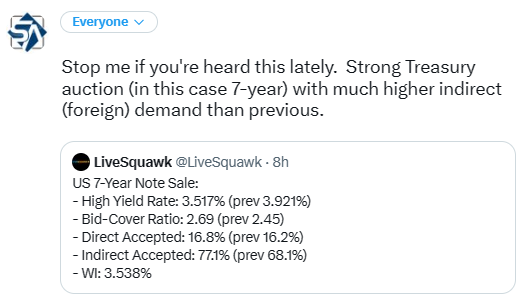
And the strong Treasury auctions continued this week.
And saw this interesting chart this week. I hadn’t realized how much Chinese holdings of Treasuries had dropped in 2022. Would argue that this is likely closer to the end than the beginning of this process (and perhaps them coming back into the market is part of what we’re seeing commensurate with their reopening).
The data on China’s Treasury holdings isn’t complete given the role of custody accounts, but the trend is certainly lower. At $870 billion, the total pile attributed to China by the Treasury department is down by a third over the past decade.
But some of that buying is also from pension funds. This though could be a headwind for equities. BBG.
“Asset managers came into the year with large cash balances and there is a little bit of a ‘get in now before its too late’ sentiment,” said Alexandra Wilson-Elizondo, head of multi-asset retail investing at Goldman Sachs Asset Management. Investors are seeing global disinflation signs, some weaker data and “if history is a guide it shows that turning points can be abrupt.” That bullish mood was underscored this week when investors bought much bigger slices of new Treasury debt sales than is typically seen, locking in yields that remain near the higher end of the range seen over the past 15 years. At current levels, Treasuries are seen as an attractive hedge against a recession That macroeconomic outlook is expected to keep benchmark yields rangebound, supported by the twin forces of moderating price pressures and employment growth.
“The pensions are in good shape. They can now essentially immunize — take out the equities, move into bonds and try to have assets match liabilities,” Mike Schumacher, head of macro strategy at Wells Fargo, said in an interview. “That explains some of the rallying of the bond market over the last three or four weeks.” An irony of pension accounting is that a year like last year, with its twin routs in stocks and bonds, can be a blessing of sorts to some benefit plans, whose future costs are a function of interest rates. When rates climb, their liabilities shrink and their “funded status” actually improves. Even as markets suffered their worst year since the financial crisis, corporate plans reaped a windfall as aggregate liabilities fell by $493 billion, more than enough to offset investment losses of $321 billion. The largest 100 US corporate pension plans now enjoy an average funding ratio of about 110%, the highest level in more than two decades, according to the Milliman 100 Pension Funding index. That’s welcome news for fund managers who suffered years of rock-bottom interest rates and were forced to chase returns in the equity market. Now, they have an opportunity to unwind that imbalance and Wall Street banks pretty much agree on how they’ll use the extra cash to do it: buying bonds, and then selling stocks to buy more bonds.
Pension funds need to keep some exposure to stocks to boost returns, but that equation is changing. Once a corporate plan reaches full funding, their aim is often to derisk by jettisoning stocks and adding fixed income assets that line up with their liabilities. With the largest 100 US corporate defined benefit funds riding a cash pile of $133 billion after average yields on corporate debt more than doubled last year, their path is wide open. JPMorgan’s strategist Marko Kolanovic estimates derisking will lead pension managers to buy as much as $1 trillion of bonds; Bank of America’s Braizinha says a $500 billion buying spree is closer to the mark. If pension fund managers increase their allocation by 3% to 4% it would translate into $1 trillion of bond purchases, according to JPMorgan calculations. Even a 6% increase isn’t out of the question, according to the firm’s strategists.
And PIMCO also likes bonds. BBG.
There’s “a strong case for investing in bonds” as a recession looms this year, fixed-income investing giant Pacific Investment Management Co. says in a new report. The bond manager has a baseline outlook for “a modest recession and moderating inflation,” an environment in which bonds have “the potential for both attractive returns and mitigation against downside risks.” US core bond funds that yield 5.1% or higher “may offer additional downside mitigation versus outer-circle assets in the event of worse outcomes,” Pimco says. Pimco advocated being neutral on interest-rate risk and expects a yield range of about 3.25% to 4.25% for the 10-year US Treasury. The outlook for US mortgage backed securities is solid, and “an expected decline in interest rate volatility would support MBS.”
As the NY Fed’s latest corporate bond indicators continues to see a healthy market.
Corporate bond market functioning appears healthy, with the overall market-level CMDI around its historical 30th percentile.
Market functioning in the investment-grade segment continued to improve in January and is now below its historical 75th percentile.
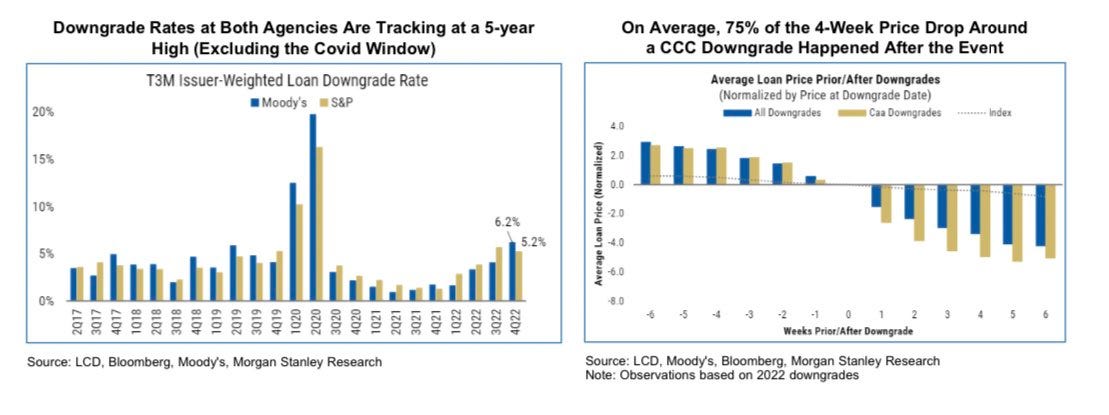
As Morgan is cautious on junk debt (as am I).
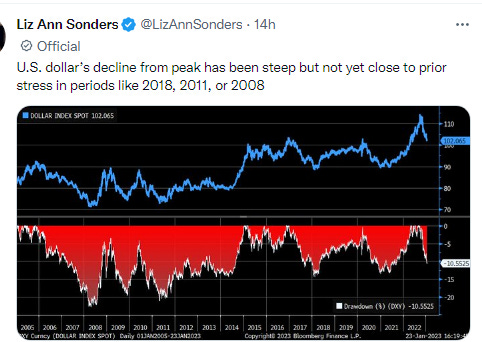
Dollar (DXY)
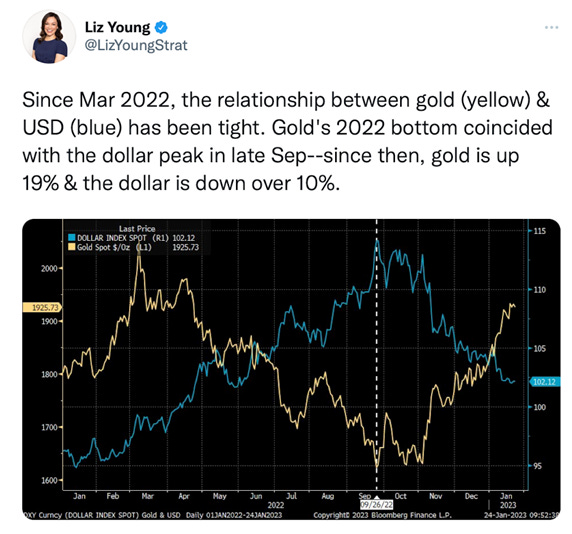
The dollar finished the week just above its 6-month closing low reached earlier in the week remaining at the bottom of its recent range and just above my target. That said, the daily technicals are showing signs of turning more supportive. It’s coming up on a key trendline if it can continue moving sideways. A lot of resistance overhead though, and for now the overall trend is down.
VIX
The VIXfell for most of the week again at one point touching the lowest level in over a year before recovering to close around the 52-week closing lows.
Crude (/CL)
I noted a week ago that WTI had gotten to my $83 area target but had stalled. I said “for now, I think it has a decent chance to move through that resistance. If not it might pull back to the uptrend line.” And so it did neither instead continuing to pound against the 100-DMA but not above to close above it. Daily technicals remain positive, but they’re starting to weaken, so now I’m starting to wonder if it will get through as I had been more confident about earlier in the week. The 100-DMA is proving very difficult to crack.
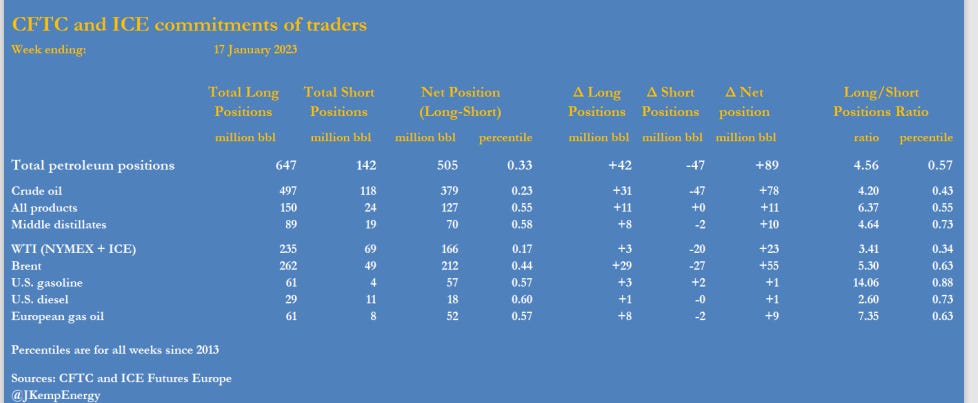
And for a third week money managers were buying although also for a third week it was mostly Brent (which now has the net positioning in Brent well above WTI as discussed below).
Overall positioning still remains historically (last 10 years) low although now definitely off the bottom. Coming into the week net positioning (longs minus shorts) was in the 44th percentile of all years since 2013 for Brent and 17th for WTI. But long/short positioning (my gauge of bullishness) was in the 63rd percentile for Brent and 34th for WTI so a relatively bullish positioning in Brent but no so much WTI.
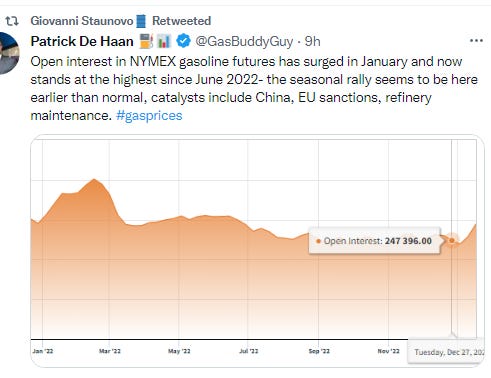
And open interest continues to rebuild which should hopefully dampen volatility (which we saw this week).
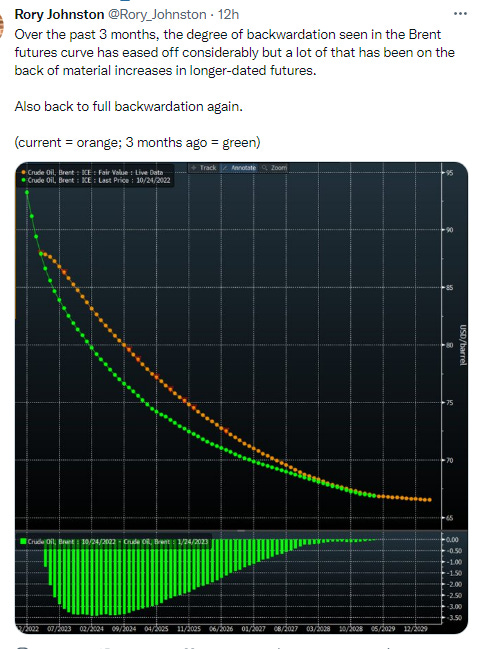
And a more bullish posture was also evidenced by calendar spreads which got back to backwardation across the curve.
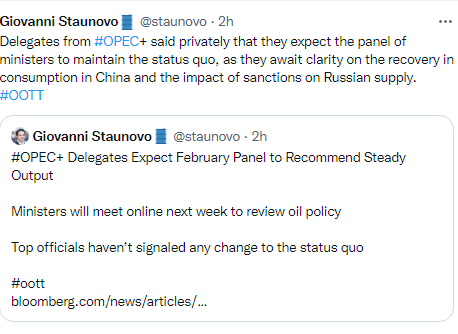
But not all are so bullish.
Tuesday - “Crude has been the laggard recently,” while products have been strong, with Europe’s diesel market hit $1,000 yesterday, he said. “Diesel and other products are likely to drag crude up.”
And an interesting catalyst for oil of late.
As Goldman reiterates their bullish call.
As gas prices have moved higher, although some of this is likely due to the refinery issues which should be cleared out over coming weeks.
And jet fuel as well (primarily same issues).
And in advance of the upcoming Russian oil products ban in Europe (I’ll have more on that next weekend as it starts on Feb 5th), traders continue to add to supplies. It is thought that the disruption from this ban will be greater as a ready market for Russian refined products outside Europe simply doesn’t exist in the way it did for crude.
And one way to avoid disruption may be a price cap. BBG.
The Group of Seven has signaled that it’s comfortable with the European Union setting a price cap for exports of Russian diesel between $100 and $110 per barrel as the US and its allies try to avoid a major disruption in the market, according to a G-7 official. The G-7’s preferred range suggests it would prefer a higher price — driven by concern that setting too low a level risks causing price spikes or supply glitches in Europe — but that it could live with $100. The official notes a lack of spare capacity in the diesel market, as well as a number of maintenance-related outages. Headline diesel futures, which don’t include Russian supply, stood at about $125 a barrel on Friday, according to ICE Futures Europe data. The EU, which is discussing the prices level over the coming days, needs to reach unanimous agreement in order to set a cap. For discounted products like fuel oil, the EU is exploring a cap of $45 per barrel. Those two ceilings would apply from Feb. 5, but a grace period would be granted to vessels carrying products purchased and loaded before that date and unloaded by April 1, according to a draft EU regulation seen by Bloomberg News.
As Israel takes “containment” of Iran into their own hands.
Nat Gas (/NG)
On nat gas, as a reminder after breaking my “must hold” level last week I said “it will bounce somewhere, but where is the question.” Since then I have thought if it can just stabilize a few days we could see it move higher, and the first couple of days this week it did that (stabilize), but Wednesday it took another leg lower breaking below $3 for the first time since May 2021. The fact that it couldn’t bounce despite a letter Thursday by the Federal Energy Regulatory Commission authorizing Freeport LNG, the terminal operator, to resume some activities before a full reopening and a larger than expected storage draw I said spoke volumes, as does the fact that the key March/April spread - essentially a bet on how tight supplies will be at winter’s end — has reversed to a discount. Friday was no relief with prices edging to new 20-month lows. The daily technicals are ready to be supportive, though, if it can just stabilize. It seems fundamentally too low so I’m quite sure we’re closer to the bottom than we were a couple of weeks ago, but I’ll be looking for it to get back over $3.80 though before I’m comfortable a short term bottom has been put in.
As hedge funds have turned the most bearish on US gas prices in almost three years, according to data released by the US Commodity Futures Trading Commission last week. BBG.
The latest revisions to the weather forecast were “absolutely brutal,” indicating a looming cold shot in the US won’t last much and leading traders to bet on mostly mild February temperatures, said Gary Cunningham, director of market research at risk management firm Tradition Energy. The premium typically commanded for gas delivered in March rather than April — essentially a bet on how tight supplies will be at winter’s end — has reversed to a discount. “That alone tells you that traders have given up on winter,” Cunningham said. “The bears are ruling the market and the bulls have been chased into the shadows.” Inventories are now almost 5% above the average for the past five years, the Energy Information Administration said Thursday.
And an interesting technical take from Fairlead (Katie Stockton’s outfit) based on DeMark indicator (I don’t utilize in my work).
And on gold as a reminder I have been calling for a consolidation for a couple of weeks, but since we turned the calendar into 2023, it has not taken more than a couple of days off in between gains. I noted Monday it had been two days in a row of muted action, and the pattern repeated with gold moving to a new 7-month high Tuesday and Wednesday. It’s fairly overbought again, but that hasn’t mattered for a couple of weeks. It did take another breather Thursday and Friday so we’ll see if we get the normal jump Monday after two consolidation days. The one thing to note, though, is the technicals are the weakest since it started the most recent run.
Other commodities
Copper held on to its fifth weekly increase in London, its best run since May 2021, although didn’t make much headway overall this week (see chart), with global supply risks persisting and inventories near historic lows.
And more on Goldman’s view on commodities (via Doug Kass)
Goldman's observations about commodities, and the lack of long-term cap ex directed at expanding supply coupled with China's speedy reopening, coincides with my concern that, around mid year 2023, the U.S. is likely to experience a resumption of commodities and broader inflation gauges:
Real Asset Investing: Macro and micro re-align, pushing commodities higher
Macro headwinds lifting quickly. Commodities have staged a remarkable rally from the weather-driven lows at the start of the year, coinciding with a fundamental shift in the global macro landscape. With the macro backdrop moving from headwind to tailwind and the micro fundamental environment putting almost all markets into deficit, alongside very low starting inventories, we believe the next quarters will see synchronized support. With macro and micro dynamics re-aligning again, investors are likely to take a fresh look at the commodity sector given the severe lack of long-term capex. Even a small shift in positioning can go a long way in creating commodity reflation, in our view, given the extent to which investors are under-allocated.
China's re-opening is a game-changer. Despite the rally, our bullish reopening expectations in China are nowhere near reflected in current market prices especially if international travel continues to open up. Further, the sharp fall in EU nat gas prices has substantially improved the outlook for Europe's industrial economy, offering a further tailwind to key commodity consuming sectors such as construction and transport. Plus, US economic data continues to point to a slowing but non-recessionary growth profile while inflation data has improved. In that context, it is important to realize that YoY comparisons are favorable during 2Q as long as oil remains below $112/bbl, allowing the Fed to slow its tightening path.
The USD, too, should be a tailwind again rather than a headwind, reinforcing the upside in commodities. Industrial metals like copper or aluminum are likely to benefit most in the short-term after underperforming over 2022 on macro headwinds. While tactical trends suggest a risk of near-term consolidation in gold, we believe the medium-term story is the most bullish since 2Q20 and expect gold to outperform.
Overweight crude, copper, gold. The lack of supply is apparent in every market, other than European natural gas but even that seems temporary, as stocks are at critical levels or productive capacity is exhausted. In our view, oil markets are not pricing the expected uplift in demand combined with the downturn in Russian production. On net, we think commodities are set to generate superior total returns this year (+30% S&P GSCI on a 12 month outlook), again outperforming other asset classes.
And rice prices are also climbing, a sign that food inflation is not necessarily a thing of the past even as many prices such as wheat are declining. BBG.
Thai rice, a benchmark for Asia, has soared to the highest in almost two years. Strong demand lies at the heart of the rally, with some importers buying more of the grain to replace wheat after the war in Ukraine disrupted supplies. Some consumers have also been stocking up ahead of festivals, while a strengthening Thai currency has also helped to push up dollar-denominated prices. Rice is a staple for half the world, and while wheat soared to a record in March last year, rice was relatively subdued for most of 2022, constraining food inflation in Asia. Costlier rice now will be unwelcome news for billions of people from China to India and Vietnam. The United Nations has flagged the rise in prices as a risk, saying it’s important to stay vigilant on food security.
And just for fun.
Subscribe for free to receive new posts and support my work.
Asia
I have a relatively low exposure to Asian stocks currently (just some small positions in some Chinese tech companies (which I have mostly sold out of at this point) and a few Japanese industrials and banks as well as country ETF positions in VNM and INDA).
With Covid Zero now a thing of the past, as I noted in this space last year, we should expect a lot of fiscal support to get things moving, which we’re starting to see, and I expect more of. I, like everyone else, had thought this all would be much slower, but so far they’re going pedal to the metal, although a big test will be how things look this week after the Lunar New Year. From official and anecdotal reports just about everyone in China either has been vaccinated or has caught it, so we could move past Covid much faster than many anticipate. As I’ve reported, Beijing has also been making mostly the right noises as it relates to a better relationship with tech firms, etc., which is also very positive. I think all this means that China could be a very good place to be invested in 2023 if you can deal with the political risk (although a lot of that may now be in the prices, and I have basically sold out of my positions at this point).
India is also region I am very interested in as I talk about more below. Their data of late has been much better than most of the rest of Asia, and they overtook the UK last year as the 5th largest world economy. I have been meaning to do a little longer write-up on them but keep running out of time. I’ll get it out at some point.
Finally, I also think Japanese stocks are set for a nice rebound at some point. They are very “cheap” with the index trading around 9x P/E. That said, Japan remains in a tricky situation with yield curve control, but it appears they’re on a path to let that go by mid-year impressively without much dislocation. I’d imagine we’ve seen a peak in weakness for the yen. Data in Japan also has generally been more positive than the rest of Asia, although it’s been more mixed the last couple of months.
China
On Thursday, the first trading day following the Lunar New Year break, the benchmark Hang Seng Index jumped 2.4% to close at its highest since March 1. The Hang Seng China Enterprises Index, which tracks mainland companies listed in Hong Kong, rallied almost 3%. The offshore yuan also strengthened against the dollar as onshore markets remain closed for the week. Traders were emboldened by China’s holiday travel and box office data, which showed a strong revival in demand and suggested the nation has emerged from the worst of a Covid Zero exit wave. Investors have been keeping a keen eye on consumption figures from the nation’s most important holiday to gauge the strength of China’s economic recovery. The holiday period also saw tourism rebound in Hong Kong and Macau as cross-border travel revved up. The gaming hub greeted almost 40,000 mainland visitors on the second day of the holiday, the most since the start of the pandemic, while Hong Kong’s daily passenger arrivals also jumped (more later). The global equities backdrop is also supportive. Tech stocks drove US equities higher earlier this week as investors await the release of key earnings, and as comments by Federal Reserve officials dialed back fears of overly aggressive policy moves. And adding to the positive mood music, state-run news agency Xinhua reported that Chinese President Xi Jinping said relations between Australia and China are proceeding in “the right direction,” another sign of thawing relations between the two countries ahead of a meeting of top trade officials expected within months. With Thursday’s gains, the Hang Seng Index as well as the Hang Seng China gauge are set to rally for six straight weeks, boosted by the economic reopening and pro-growth policies. That would be the longest streak of weekly gains since January 2020, just before global markets started to collapse as the pandemic took hold. The CSI 300 benchmark will reopen on Monday.
About 95.9 million trips were made by road, rail, air and waterways during the first four days of the week-long public holiday, which began Saturday, according to Bloomberg calculations from data released by the Ministry of Transport. That’s a daily average of roughly 24 million trips, compared with an average of just 18.6 million over the course of the week in 2022. Box office during the first four days of the Lunar New Year holiday totaled 3.62 billion yuan ($533 million), according to figures from online ticketing platform Maoyan Entertainment. That’s higher than the 3.5 billion yuan recorded during the same period last year and the 3.4 billion in 2019, before the pandemic. Bookings of hotels, guest houses and scenic spot tickets on Jan. 21 through Jan. 24 exceeded the comparable period in 2019, the National Business Daily reported, citing figures from online travel agency Trip.com Group.
The temperature in Mohe, a city in northern China’s Heilongjiang province, dropped to -53C (-63.4F) on Jan. 22, according to a post published on the official social media account of the Heilongjiang Meteorological Bureau. That beat the country’s previous record low of -52.3C (-62.1F), which occurred in 1969.
Japan
Japanese government representatives at the Bank of Japan’s December policy meeting requested an urgent time out in a likely sign of their surprise at planned adjustments to the bank’s yield curve control program. The December meeting was adjourned from 10:51 a.m. to 11:28 a.m. before concluding at 11:54 a.m., according to minutes of the meeting released Monday. The suspension was the first since June 2021. The request suggests the tweaks that went on to roil global financial markets prompted an unplanned discussion among senior government officials before the BOJ announced them.
The Bank of Japan should consider boosting flexibility in long-term yields as rising inflation risks call for securing more room for policy maneuvering, according to the International Monetary Fund. Options include raising its 10-year yield target, widening the yield trading band, switching back to a quantity goal for bond buying and aiming at a shorter-maturity yield, the fund said in an Article IV report published Thursday. The fund made the recommendations amid “exceptionally high uncertainty” around inflation with risks tilted to the upside.
Growing expectations that the Bank of Japan will drop its yield-curve control policy sooner rather than later are triggering a 94% surge in sales of yen bonds with shorter maturities that are less vulnerable to future interest-rate action.
A possible future BOJ policy change would lead to bigger losses for debt with longer maturities. Sales of Japanese corporate bonds maturing in more than five years have plunged by more than half so far this month.
Japan cut its view on the overall economy for the first time in 11 months in January, as China's COVID-19 infections and a slowdown in global demand for tech and semiconductors hurt exports, especially to Asia. The government expects the economy, the world's third largest, will pick up going forward but Japan needs to pay full attention to the impact from China's spreading infections after it dropped stringent pandemic curbs, the report said. The authorities slashed its assessment on exports for the first time since November 2021, while it also cut its view on imports for the first time in three months. The January report said both exports and imports are "weakening recently" compared with its previous view of "almost flat" last month.
Japan's flash January Manufacturing PMI 48.9 (expected 49.4; last 48.9) and flash Services PMI 52.4 (expected 51.4; last 51.1). Commenting on the latest survey results for Japan, Laura Denman, Economist at S&P Global Market Intelligence, said: “Japan’s private sector kicked off 2023 on a more positive note, as signalled by activity returning to growth territory in January. However, similar to trends recorded over much of the past six months, a divergence between the manufacturing and services sectors has remained. While manufacturing firms continued to face muted customer demand, service providers made sustained gains from the travel subsidy programme and recent relaxation of COVID measures. That said, there were some positive developments for manufacturing firms. Rates at which output and new orders declined softened and firms registered a relatively elevated degree of confidence. Input costs and selling prices also increased at the slowest paces in 17- and 16-months, respectively. Conversely, the service sector displayed mixed trends in terms of pricing. While input costs increased at a faster pace, the rate at which firms hiked their prices was the weakest since last August. As such, firms were more cautious about their predictions for the year ahead and registered the lowest level of business sentiment in two years.”
Japan's December Leading Index -1.2% m/m (last 0.4%) and Coincident Indicator -0.3% m/m (last -1.2%)
Japan's December Corporate Services Price Index 1.5% yr/yr (expected 1.6%; last 1.7%)
Japan's January Tokyo CPI 4.4% yr/yr (last 4.0%) and Core CPI 4.3% yr/yr (expected 4.2%; last 4.0%) Inflation in Tokyo continued to outpace expectations, jumping above 4% and underscoring how price gains may be stronger than the Bank of Japan’s current view. Consumer prices excluding fresh food rose 4.3% in the capital in January, accelerating from December’s revised figure of 3.9%, according to the ministry of internal affairs Friday. The reading was the strongest since 1981 and beat analyst estimates, rising further beyond the central bank’s 2% target. Hotel prices were the biggest driver behind the acceleration. The stronger than expected reading prompted the yen to gain to around 129.50 against the dollar from just below 130 immediately before the data was released. “Economists including myself have to admit the fact that the results have been beating our expectations, which means our views are influenced by the past norm of inflation,” said Nobuyasu Atago, chief economist at Ichiyoshi Securities and a former BOJ official. “Now I see a chance that inflation may peak at a higher level and become stickier than I had expected.” Tokyo’s data is a leading indicator of the national trend, and its acceleration implies that the country’s price growth will also strengthen further. Still, many economists see January as the peak of the current inflation wave and expect prices to begin slowing again from February, when the effects of Prime Minister Fumio Kishida’s latest stimulus measures gain further traction. That helps explain why the BOJ continues to insist that price growth will cool. In its latest outlook report released last week, the central bank kept its inflation forecast for the next two years below 2%, maintaining the idea that the current cost-push price hikes will not stick. Japan's Prime Minister Kishida said that inflation driven by domestic demand remains "feeble" and that a return to deflation should not be ruled out. Still, utility companies are now requesting the government to raise power prices in response to surging fuel costs and a weak yen, complicating the outlook. Tokyo Electric Power Co. announced earlier this week that it had applied to lift household electricity prices by about 30% from June, an increase that would outweigh the impact of the latest government subsidies if approved. Processed food continued to be the single largest contributor to price growth, followed by energy prices. Accelerating price growth has been gradually eroding consumer appetite. Household spending fell for the first time in three months in November, and retail sales in the same month also declined despite a rebound in demand from foreign tourists.
Goldman Sachs Group Inc. raised its forecasts for Japan’s upcoming spring wage negotiations, expecting the highest base pay hike in three decades as inflation continues to surprise on the upside. The brokerage now sees a base wage increase of 1.2% in the annual negotiations between labor unions and companies, up from its previous forecast of 0.9%. When combined with scheduled, seniority-based raises, Goldman expects an increase of 2.8% as a result of the wage negotiations, up from its former view of 2.5%. While the new forecast would bring wage gains closer to the key 3% level flagged by the Bank of Japan as necessary to achieve its inflation goal, the brokerage didn’t expect the new numbers to have a major impact on monetary policy. Overall wage increases for the next fiscal year will likely be 2.1%, Goldman economists Yuriko Tanaka, Naohiko Baba and Tomohiro Ota wrote.
India
India’s Nifty 50 index was dragged to three-month lows on the back of the continued rout in companies linked to Indian billionaire Gautam Adani. His corporate empire has shed some $50 billion of market value in two sessions following an explosive report from short seller Hindenburg Research on Jan. 24, making wide-ranging allegations of corporate malpractice at firms controlled by Asia’s richest man. Adani Group’s flagship company Adani Enterprises Ltd. fell as much as 20% on Friday, trading below the price band for its key share sale. Adani Ports and Special Economic Zone Ltd. slumped as much as 25%.
S Korea
South Korea's Q4 GDP -0.4% q tr/qtr (expected -0.3%; last 0.3%); 1.4% yr/yr (expected 1.5%; last 3.1%).
South Korea's February Manufacturing BSI Index 66 (last 71)
Australia
Australia's flash January Manufacturing PMI 49.8 (last 50.2) and flash Services PMI 48.3 (last 47.3).
December NAB Business Confidence -1 (expected 3; last -4) and NAB Business Survey 12 (last 20)
Australia's Q4 PPI 0.7% qtr/qtr (expected 1.7%; last 1.9%); 5.8% yr/yr (expected 6.3%; last 6.4%).
Q4 Import Price Index 1.8% qtr/qtr (last 3.0%) and Export Price Index -0.9% qtr/qtr (last -3.6%)
Australia's Q4 CPI 1.9% qtr/qtr (expected 1.6%; last 1.8%); 7.8% yr/yr (expected 7.5%; last 7.3%). Australian inflation accelerated to the fastest pace in 32 years in the final three months of 2022, exceeding forecasts and prompting money markets to price in an interest-rate hike at next month’s central bank meeting. Bond yields and the currency gained as the consumer price index advanced 7.8% from a year earlier, exceeding economists’ 7.6% estimate, official data showed Wednesday. The result indicates inflation remains very strong even after 3 percentage points of rate increases between May and December. While the headline number came in slightly below the Reserve Bank’s forecast 8%, it shows Australia is lagging behind its developed-world counterparts where the inflation impulse has begun to ease. Core inflation, a measure preferred by the RBA, accelerated to 6.9% last quarter from a year earlier, exceeding economists’ forecast of 6.5%. That reading of the trimmed-mean measure was the strongest since the series began in 2003. The services component of the CPI recorded its largest annual rise since 2008, the ABS said. “Inflation has probably peaked but remains far too high,” said Su-Lin Ong, head of fixed-income strategy at Royal Bank of Canada. “The data likely seal the case for a 25-basis-point hike in February and the prudent approach would also be a final 25-bps in March to see terminal at 3.6%.” Australian stocks erased gains and fell as much as 0.5%, trailing peers in the region.
December MI Leading Index -0.1% m/m (last -0.1%)
Russia
Russia is at the center of a rail cargo route supplying Western arms manufacturers with a steady supply of metals needed to make the microchips, electronics and ammunition used in modern weaponry. Most of the so-called rare earth elements are mined in China. Russian Railways JSC and other carriers are hauling a rising volume of critical metals needed for Europe’s defense industry. The volume of Chinese rare earth metals shipped on trains across Russia surged to 36,074 tons in the first nine months last year, more than double the amount transported in all of 2021, according to European Union data seen by Bloomberg News. The value of that trade rose by more than fourth-fifths, to €377 million ($408 million) through September. China supplies more than 90% of rare earth elements used in Europe, and the latest EU data show Russia railway lines remain a busy shipping lane and a key leg of Beijing’s “Belt and Road” initiative.
And I think this is a big step forward (although 100 tanks doesn’t change the huge discrepency in firepower). I hope at some point we allow them to have jets.
Germany pledged to supply Ukraine with more than 100 Leopard 2 battle tanks in a joint effort with allies, providing Kyiv’s forces with a significant upgrade in firepower and earning effusive praise from President Volodymyr Zelenskiy.
In a first step, Germany will make a company of 14 Leopard 2 A6 tanks available from stocks held by its armed forces, Chancellor Olaf Scholz’s government said Wednesday in an emailed statement. Defense Minister Boris Pistorius told reporters in Berlin that the first German tanks could arrive in Ukraine within three months, possibly too late to counter a Russian offensive that defense officials have warned could come as soon as next month.
Europe
I like European stocks longer term, but in the near term they obviously have some near term issues, particularly if they have to continue to cut industrial production due to energy costs, although those have come down to “high” from “outrageous” levels which has supported their economies. The data of late has been much more encouraging. It looks more and more like recessions may be off the table entirely outside of the UK. As I said all through 2022, longer term I think there’s a lot to like, including energy companies (on a pullback), automakers, and European banks that have strong financial positions and pay good dividends. There are quality companies in other areas as well of course (pharma, etc.). I have positions in many of those companies currently although I have been more of a seller than a buyer this year (particularly I have been trimming back high flying European banks). Like in the US, balance sheets are in much better shape than previous recessions.
And blessed with much warmer than normal temperatures and strong winds, the chances of Europe getting through this winter without huge issues looks almost certain (next winter could be a different story if Russian flows remain shut off). In that, this week Germany released estimates that it will take until 2026 to install 56 billion cubic meters of domestic LNG import capacity, about the same it imported by pipe from Russia in 2021. And that ignores the issue whether there will even be enough LNG available. “The truth is, there won’t be enough in the next three to four years of LNG production capacity in the world to meet the growing demand,” Christian Leye, a Left Party lawmaker told Bloomberg. “So the unspoken strategy is that Germany will continue to pay crazy prices and other, less rich countries go empty-handed.”
But after the rapid runup in European equities, analysts are becoming more cautious.
European shares have started the year with a rally, poised for the best January since 2015 on easing gas prices, cooling consumer inflation and China’s lifting of Covid-19 restrictions. That briefly pushed the Stoxx 600’s 14-day relative strength index into ‘overbought’ territory last week. However, now focus is turning to the impact of the expected recession on corporate profits and how resilient some industries can be. “There’s going to be quite a lot of downward pressure on earnings expectations because the economy has been quite difficult,” Anna Macdonald, a fund manager at Amati Global Investors Ltd, said in an interview. Macdonald says many analyst forecasts have not yet fully factored in the added cost of servicing debt at higher interest rates, and says markets are punishing those that give disappointing earnings updates. “We’ve seen companies continue to get pretty sold off when they haven’t met expectations,” she added.
Other top investors including BlackRock Inc. and Amundi SA also warn that markets are being too sanguine about risks ahead. “It’s dangerous to think just because stocks are going up that things are okay,” said Kasper Elmgreen, head of equities at Amundi. “We’ve now got a very high conviction that 2022’s resilience will break. The market has not yet appreciated the magnitude of earnings downgrades ahead.” BlackRock Investment Institute strategists have said stock-market optimism has come too soon, while [as I noted last week], those at Goldman Sachs Group Inc. and Bank of America Corp. warn that the best part of the 2023 rally could be over already.
EU
Eurozone Consumer Confidence Jan: -20.9 (est -22.0; prev -22.2) Consumer sentiment in the euro area rose to the highest level since last February, a sign of resilience as the region seeks to dodge recession this year. The gauge of confidence increased to -20.9 in January from -22.2 the previous month, according to the European Commission. That’s slightly weaker than the median forecast of economists, who anticipated a pickup to -20.
Eurozone's flash January Manufacturing PMI 48.8 (expected 48.5; last 47.8) and flash Services PMI 50.7 (expected 50.2; last 49.8) The private-sector economy in the euro area unexpectedly returned to “tentative” and “marginal” growth at the start of 2023 following six months of contraction, offering further signs the region may avoid a recession and comforting the European Central Bank’s focus on underlying inflation risks. S&P Global’s flash Purchasing Managers’ Index rose to 50.2 in January, better than the 49.8 reading predicted in a Bloomberg survey and the first time since June that the gauge was above the 50 threshold that separates expansion from contraction. “The survey suggests a nadir was reached back in October,” Chris Williamson, Chief Business Economist at S&P Global Market Intelligence, remarked. “Since then, fears over the energy market in particular have been alleviated by falling prices, helped by the warmer-than-usual weather and generous government assistance.” While the steadying of the economy does add to evidence the region might escape a recession, “the region is by no means out of the woods yet,” said Chris Williamson, chief business economist at S&P Global Market Intelligence. And readings for the euro area’s two biggest economies remained below 50, though the German services and French manufacturing sectors saw surprise expansions. “Demand continues to fall — merely dropping at a reduced rate — and an upturn in the rate of inflation of selling prices for both goods and services will add encouragement to the hawks to push for further monetary policy tightening,” Williamson said. “The case for higher interest rates is fueled further by the upturn in employment growth recorded during the month and signs of higher wages driving the latest upturn in price pressures,” Williamson said. Still, firms’ outlook improved materially. “Business confidence jumped higher to hint at markedly improving prospects for the year ahead,” the color accompanying the release said. “Employment growth also picked up momentum as firms prepared for a better-than-expected year ahead.”
Eurozone's December loans to nonfinancials 6.3% yr/yr (expected 8.6%; last 8.4%) and private sector loans 3.8% yr/yr (last 4.1%)
Germany
Germany's flash January Manufacturing PMI 47.0 (expected 47.9; last 47.1) and flash Services PMI 50.4 (expected 49.6; last 49.2). In Germany, the composite gauge printed a seven-month high, even as it remained just short of the expansion line. The services sector expanded and manufacturing contracted at about the same pace as last month. “Alongside easing supply-chain strains, January’s preliminary survey also pointed to a continued slowdown in rates of inflation,” S&P Global’s Phil Smith said. “However, while underlying cost pressures [are easing] quite rapidly in manufacturing, it’s a different story in services where inflation remains far stickier thanks in large part to the influence of growing wage demands.”
The German government expects Europe’s biggest economy to grow by 0.2% this year instead of the 0.4% contraction it predicted in October, according to people familiar with new forecasts to be published Wednesday. The government downgraded its growth forecast for next year to 1.8% from 2.3%, according to the people, who asked not to be identified ahead of official publication.
February GfK Consumer Climate -33.9 (expected -33.0; last -37.6)
Germany's January ifo Business Climate Index 90.2, as expected (last 88.6). - Current Assessment 94.1 (expected 95.0; last 94.4) - Business Expectations 86.4 (expected 85.0; last 83.2) Germany’s business outlook brightened further as the recession many had feared after Russia attacked Ukraine looks increasingly likely to be avoided. A gauge of expectations by the Ifo institute rose to 86.4 in January from 83.2 the previous month. That’s the fourth consecutive improvement and a bigger increase than economists had anticipated. A measure of current conditions slipped, however. “Companies are telling us they are optimistic regarding the next six months, and that suggests overall we will avoid a technical recession,” Ifo President Clemens Fuest told Bloomberg TV’s Tom Mackenzie on Wednesday. Fuest expects a shrinking economy in the first quarter, followed by an improvement toward the summer. “The most important risk for the German economy was a gas-rationing scenario,” he said. “That risk is off the table now due to the mild weather and gas storages being full.” As natural gas prices moderate, one major concern in Germany is dissipating. But inflation remains high, and monetary policymakers are trying to tame it, with 50-basis point rate hikes expected in both February and March from the ECB. “Not falling off the cliff is one thing, staging a strong rebound, however, is a different matter,” wrote Carsten Brzeski, head of global macroeconomics at ING Bank. “And there are very few signs pointing to a healthy recovery of the German economy any time soon. Like every Eurozone economy, the German economy still has to digest the full impact of the ECB rate hikes.”
France
France's flash January Manufacturing PMI 50.8 (expected 49.6; last 49.2) and flash Services PMI 49.2 (expected 49.8; last 49.5).
French Business Confidence Jan: 102 (est 102; prevR 103) - Manufacturing Confidence Jan: 103 (est 102; prevR 102) - Production Outlook Indicator Jan: -8 (est -7; prevR -6) - Own-Company Production Outlook Jan: 17 (prevR 17) - Business Survey Overall Demand Jan: 5 (prev 13)
France's December jobseeker total 2.817 mln (last 2.810 mln)
France's January Consumer Confidence 80 (expected 83; last 81)
Italy
Italy's Q3 Public Debt 4.7% (last 3.1%)
Italy's January Consumer Confidence 100.9 (expected 102.7; last 102.5) and Business Confidence 102.7 (expected 101.8; last 101.5)
Spain's Q4 Unemployment Rate 12.87% (expected 12.50%; last 12.67%)
Spain's Q4 GDP 0.2% qtr/qtr (expected 0.1%; last 0.2%); 2.7% yr/yr (expected 2.2%; last 4.8%) Spain reported better than expected growth for Q4, fueling more hopes that the region could avoid a recession.
U.K.
U.K.'s flash January Manufacturing PMI 46.7 (expected 45.4; last 45.3) and flash Services PMI 48.0 (expected 49.6; last 49.9). The above 50 reading in the EU flash composite PMI contrasts with the UK where where companies signaled that output fell at the steepest pace in two years. S&P Global’s reading fell to 47.8 in January from 49 in the previous month, well below the 48.8 estimate in a Bloomberg survey, led by a sharp deterioration in services, which fell to a 2-year low, that had previously propped up the economy. “Service providers experienced a marked loss of momentum since December, with survey respondents citing higher interest rates and low consumer confidence as key factors that held back business activity,” S&P Global said. The pound retreated and gilts rallied. The pace of downturn in manufacturing eased slightly. “Industrial disputes, staff shortages, export losses, the rising cost of living, and higher interest rates all meant the rate of economic decline gathered pace again,” Chris Williamson, chief business economist at S&P Global Market Intelligence, said in a statement Tuesday, “jobs also continued to be lost as firms tightened their belts, though many other firms reported being constrained by an ongoing lack of available labor.” He said the UK is also facing “ongoing damage to the economy from longer-term structural issues such as labor shortages and trade woes linked to Brexit.” In a mixed message for inflation, average prices charged by private sector companies rose “sharply,” and were “driven by historically strong inflationary pressures and efforts to pass on rising staff wages,” although the increase was the slowest in 17 months.
December Public Sector Net Borrowing GBP26.58 bln (expected GBP22.30 bln; last GBP18.82 bln) The UK’s budget deficit stood at £27.4 billion ($34 billion), a record for the month of December and almost triple the £10.7 billion shortfall a year earlier, the ONS said today. Economists had forecast a reading of £17.3 billion. “Today’s worse-than-expected public finances figures will only embolden the Chancellor in the budget on 15th March to keep a tight grip on the public finances,” Ruth Gregory at Capital Economics wrote in a note to clients. It means he’ll “waits until closer to the next general election, perhaps in 2024, before announcing any significant tax cuts.” The figures also show that soaring prices and tax rates are bringing more money into the Treasury. The cost of subsidizing gas and electricity is taking a toll, amounting to £7 billion in December alone. Total receipts leaped 11% to £658 billion in the financial year to December. VAT and income tax receipts grew at a double digit pace last month.
UK CBI Trends Total Orders Jan: -17 (est -8; prev -6) - UK CBI Trends Selling Prices Jan: 41 (prev 52) - UK CBI Business Optimism Jan: -5 (prev -48)
U.K.'s December Input PPI -1.1% m/m (expected -0.6%; last 0.6%); 16.5% yr/yr (expected 18.0%; last 19.2%). - December Output PPI -0.8% m/m (expected 0.3%; last 1.0%); 14.7% yr/yr (expected 16.4%; last 17.5%) UK factories’ fuel and raw material costs are rising at their slowest pace in almost a year, further evidence that pipeline inflationary pressures are easing. Input prices rose 16.5% in December from a year ago, down from a peak of 24.6% in June, Office for National Statistics figures published Wednesday show. That was the slowest pace since February 2022. There were widespread falls in raw material costs, led by imported food, chemicals, parts and equipment, and oil. That suggests some of the supply chain bottlenecks that appeared after the pandemic have started to ease. The figures may fan speculation that the central bank is close to completing its fastest rate-hiking cycle since the 1980s. On a monthly basis, producer input prices fell for a second consecutive time in December, declining 1.1% as the cost of crude oil fell. Output prices, the cost of goods leaving factory gates, fell 0.8% in the month of December and were up 14.7% from a year earlier. That was the slowest annual pace since March. Another promising development was a slowing in the pace of input costs growth for services companies. Services producer price inflation fell from 6.2% to 5.2% between the third and fourth quarters and is now the lowest it has been since the first three months of 2022. There were though still signs of price pressures feeding through in food supply chains as shoppers face accelerating costs on their weekly shop. The cost of food products leaving factories picked up to 17.1% compared to a year earlier, the most since records started in 1997.
U.K.'s January CBI Distributive Trades Survey -23 (expected -5; last 11). Business confidence in Britain has sunk to its lowest level since the global financial crisis, according to a survey of accountants, amid persistently high inflation and fears that the country is already in a recession. The Institute of Chartered Accountants in England and Wales said Thursday that its latest monitor of business sentiment dropped to an index reading of -23.4, the weakest since 2009. The last survey, published in November, stood at -16.9. Companies in the retail, property and manufacturing sectors were particularly downbeat and reported problems accessing capital, the group said. Construction firms had the lowest confidence. The survey included 1,000 chartered accountants and was conducted between Oct. 17 and Dec. 16. Its findings were echoed by a separate survey, also published Thursday, which found morale plummeting among small firms. The Federation of Small Businesses’ confidence index dropped to -46 points in the final quarter of 2022 from -36 in the third quarter. The FSB said it’s now almost as low as during the UK’s second Covid lockdown. Its survey began in 2014. According to the FSB, retail businesses were among the most pessimistic, along with hospitality firms like pubs and restaurants. More than 1,000 small firms were surveyed between Dec. 7 and Dec. 23.
Q3 Labour Productivity 0.1% (last 0.1%)
Chancellor of the Exchequer Jeremy Hunt dismissed calls for tax cuts and pushed back against green energy subsidies, warning that “sound money must come first” as he argued that Brexit will drive UK economic growth. In an interview with Bloomberg TV, Hunt said: “At the moment, we don’t have the headroom for major cuts. Businesses want that, who wouldn’t? But what businesses want even more is stability.” Tax-cuts though would be his priority if the Treasury finds any headroom, Hunt said. “Lower taxes are part of the vital incentives to encourage people to set up companies and invest,” Hunt said, adding: “We want to go there.” He said that would require “restraint on spending” and signs of better economic growth. With no money available for giveaways, the chancellor also pushed back against US and European plans to subsidize green industry, which threaten to divert investment from the UK. Hunt’s words will disappoint right-wing Tories, who remain vocal even after Liz Truss’s unfunded £45 billion September giveaway sank the pound, destabilized the bond market and ultimately ended her premiership. The chancellor made no specific policy pledges, prompting criticism from business lobby groups.
As traders are now pricing in rate cuts by year end for the BoE.
Other Int’l
At a peak and then a pause before a cut
ING - As widely expected, the Bank of Canada raised the overnight rate 25bp to 4.5%. We had suspected that this would be the last hike of the cycle and this has seemingly been agreed by officials. The accompanying statement indicated that “if economic developments evolve broadly in line with the MPR outlook, Governing Council expects to hold the policy rate at its current level while it assesses the impact of the cumulative interest rate increases". They mention the tight labour market and “persistent excess demand” as justification for the latest move, but acknowledge "there is growing evidence that restrictive monetary policy is slowing activity". They expect the economy to "stall" through mid-2023 with full year growth of around 1% while "inflation is projected to come down significantly this year", hitting the 2% target in 2024.
Given Canada's high household debt exposure and greater vulnerability to rising interest rates via the mortgage market structure we think the economy and inflation could slow more rapidly than the BoC is currently projecting. Consequently, we think the next move will in fact be an interest rate cut with the potential first easing coming as soon as late in the third quarter. Markets interpreted the BoC announcement as a dovish surprise, not because the pricing suggested more tightening, but because of the quite explicit reference to rates being kept at this level open up some room for earlier/more rate cut speculation.
And Ex-US is now up 25% from the lows.
Next Week
SA - A blockbuster week ahead includes the FOMC meeting, a key OPEC gathering, and a flurry of heavyweight earnings reports. The Federal Reserve is largely anticipated to fire off a 25-point rate hike to take the target federal funds rate to 4.50% to 4.75%. The consensus view is that the Fed will continue with its tightening policy and signal more rate hikes are still in the mix. Seeking Alpha author Bill Conerly said in his Fed preview article that the transitory elements of inflation have come down, but the underlying problem of excessive stimulus remains. OPEC oil ministers will meet online during the week to review levels of output. The Joint Ministerial Monitoring Committee of OPEC+ is expected to endorse the current oil output policy of the group. Also on the macroeconomic calendar, the unemployment report at the end of the week is expected to show a rise in nonfarm payrolls of 225K with the end of a strike by University of California workers in late December a positive factor. Private payrolls are forecast to rise by 200K following a 220k increase in December. Bank of America thinks behind the strong payroll print, some details will show cracks in the foundation, particularly in manufacturing. The heavy earnings slate includes reports from tech heavyweights Amazon (AMZN), Apple (AAPL), Alphabet (GOOG), and Meta Platforms (META). Investors are looking to see the focus return back to growth after recession worries, high-profile job layoffs and supply chain snarls dented sentiment. Other big reports include the quarterly updates from Exxon Mobil (XOM), Starbucks (SBUX), and Merck (MRK).
A packed data week next week starting Tuesday. Key reports are the Employment Cost Index on Tuesday, productivity on Thursday, and the monthly employment report on Friday. The former is the Fed’s favorite wage inflation report, and it comes a day before their rate decision. Any other week highlights would be ISM PMI’s (we got the S&P flash version last week), JOLTS, consumer confidence, etc. And of course get the Fed decision on Wednesday. So a lot that can move markets next week.
Here is ING’s take on the Fed meeting. As I noted in the Bonds section, 25bps is a lock. All of the drama will be in the press conference absent something out of left field in the statement.
The Fed has also been quite quiet on the balance sheet roll-off programme. It seems that’s the way it likes it – churning away quietly in the background, and not causing too many market ripples. The big question in this space is whether the Fed could consider outright selling some bonds off its books, and thereby engage in a harder version of quantitative tightening. It would be huge if it did. There is certainly an appetite for bonds in the market if the recent Treasury auctions are anything to go by.
However, such selling of bonds outright would likely be a step too far at this juncture, as it would likely generate a tantrum. But it's always there should the Fed start to feel that the fall in longer-dated market rates is acting contrary to its hiking efforts on the front end. Even a mention that it is looking at this down the line would have a material effect. Not expected, but these are potential market movers that we need to cross off as the meeting outcome unfolds.
Importantly, any mention of potentially upsizing the bond roll-off in the future or considering any bond selling (e.g. of the longer-dated mortgage portfolio) would signal it was uncomfortable with where longer-dated market rates are at.
And, the day after the Fed, the European Central Bank and the Bank of England will each probably raise rates by a half point, after euro-zone data are likely to show slowing inflation and a stagnating economy. Meanwhile, surveys from China might reveal improvement, Brazil’s central bank may keep borrowing costs unchanged, and the International Monetary Fund will publish its latest global economic forecasts.
China returns to work after the Lunar New Year holiday with the strength of its economy in close focus. Official PMIs due on Tuesday are likely to improve sharply from December’s dismal readings, but the manufacturing sector is still not expected to return to a clear expansion. They’ll be followed by PMIs from across Asia on Wednesday.
Japan releases factory output, retail sales and jobless figures that may cast doubt on the strength of the economy’s rebound from a summer contraction.
India unveils its latest budget in the middle of the week as policy makers there try to keep growth on track while reining in the deficit.
Export figures from South Korea will provide a pulse check on global commerce on Wednesday, while inflation figures the next day will be closely scrutinized by the Bank of Korea.
The Reserve Bank of Australia will be keeping an eye on house prices and retail sales data in the run-up to its rate decision the following week.
Before the ECB on Thursday, key data will draw attention for clues on the path for policy. Economists are split on whether GDP for the euro area on Tuesday will show a contraction in the fourth quarter — potentially heralding a recession — or whether the region avoided a slump. The next day, euro-zone inflation in January is anticipated to have slowed for a third month, though a small minority of forecasters predict an acceleration. The ECB decision itself is almost certain to feature both a half-point rate increase and more details of the plan to wind down bond holdings built up over years of quantitative easing. Given President Christine Lagarde’s penchant for hinting at future decisions, investors may focus on any outlook she divulges for March in her press conference, at a time when officials are increasingly at odds over whether to slow tightening.
Growth and consumer-price data from the region’s three biggest economies — Germany, France and Italy — are also due in the first half of the week, making it a busy few days for investors. The so-called core underlying measure of inflation may show just a slight weakening. That gauge is drawing more focus from officials justifying further aggression on policy tightening.
Mexico this week becomes the first of the region’s big economies to post Oct-Dec output. Most analysts see GDP grinding lower for a third straight quarter, and more than a few forecast a mild recession some time in 2023.
In Brazil, look for the broadest measure of inflation to have slowed in January while industrial output continues to struggle. With inflation now only making glacial progress back to target, Brazilian central bankers this week have little choice but to keep the key rate at 13.75% for a fourth meeting. Economists surveyed by the bank see just 229 basis points of slowing over the next four years, which would mean missing the target for a seventh straight year in 2025.
And if all of that wasn’t enough, we have an OPEC+ meeting. No change is expected. The tip off is the fact it’s virtual.
And here’s a nice trading calendar I came across from NYSE that I’ll just leave up for the year.
Misc.
As reverse repo use remained in the $2T - $2.5T range it’s been in for the past year or so, although it just made it above that number this week, the lowest it’s been this year. For now it continues to evidence plenty of liquidity looking for a safe home.
Although for now as noted there is plenty of liquidity and bank reserves.
But one place liquidity is not quite so overflowing is with smaller banks who have lost deposits since 4Q21 and are now turning to the home-loan bank system for cash. WSJ.
Facing a wave of customer withdrawals, banks are turning to government-sponsored lenders in droves for cash, often at a steep cost. Bank borrowings from Federal Home Loan Banks surged to $661 billion in the third quarter last year, the latest period for which data are available. That's up from $344 billion a year earlier and rapidly approaching a recent peak of nearly $800 billion in the first quarter of 2020. The home-loan bank system provides funding to thousands of lenders, thrifts, credit unions and insurers. Rates on the loans—known as advances—were below 1% for short-term borrowings a year ago. Now, many breach 5%. Eye-catching yields on Treasurys and money-market accounts are pulling customers away from low-yielding deposit accounts at banks. The Federal Reserve's tightening is further draining cash, forcing banks to tap their local home-loan bank for funding.
Through the first three quarters of 2022, cash balances at small banks, or those with less than $3 billion in assets, fell to 6% of total assets, down from more than 13% just nine months earlier, according to the Federal Reserve Bank of New York. Among those taking out multibillion-dollar loans are two of the biggest banks to crypto companies.
Overall
So let’s go through the list of items that I think are most important to the direction of markets:
The Fed - From two weeks ago:
As long as inflation continues to decelerate, the tension between the Fed and markets will be eased as we have been seeing. In addition, just the simple fact that Fed has already raised rates to current levels makes the difference between market pricing and the Fed dot plot relatively insignificant. After 450 basis points of rate rises, whether you do another 25 or 75 is relatively minor. Going a lot higher than 75bps or holding a lot longer (past the end of 2023) than the market expects will matter, but there is no reason for that to occur as long as inflation continues to cooperate. And as to the latter, that’s something the Fed will continue to say (that they’re holding into 2024) but until we get there the market will likely continue to fade (again assuming that inflation continues to decelerate). So while the Fed might cause some wobbles, I am thinking they will become less front and center, again, as long as inflation continues to cooperate (have I said that enough times?). That said, they will continue to want to avoid big market rallies which substantially loosen financial conditions, so you can expect the language to remain towards the hawkish side for now. They also are deathly afraid of a resurgence in inflation. So as you can tell my focus will be squarely on the data and less on what the Fed says for the next few months.
And as I noted last week the Fedspeak has started to diverge a little, with a growing minority who think we need to start to pay more attention to the impacts of the rate rises more generally (“look around corners” as Esther George put it). As noted in the Bonds section, we’re also seeing more members thinking that a rise in unemployment may not be necessary (there was even a Fed paper to this effect that I’ll try to discuss at some point), an idea that I think will attract more followers as we move through 2023. This could set the stage for some interesting internal conversations starting as early as the March meeting (I think the February meeting they’ll all be singing from the same hymn sheet).
Earnings - This is now center stage. As I noted four weeks ago,
Along with the path of inflation this is the critical point for 2023. Do earnings hold up or do they crack? I think they will continue to be “better than feared”, but if not we’re likely looking at a new low for this bear market or at least a revisit to the lows.
So far they’ve mostly held up, although as noted in that section the beat rate remains very low and expectations are declining, something that doesn’t normally happen once earnings season has started. Hopefully things improve as we move forward. Still as I noted expectations for the next couple of quarters have come down considerably. It will be more as we move to the end of the year and that big jump in 4Q23 earnings expected that we will perhaps see some bigger repricings.
Technicals - As I have said the last three weeks, the technical situation is very positive, and this week it was enough to conclusive push past some important resistance. Now the SPX faces another challenge, but technically there’s no reason for things to stall out here. But this week won’t be about the technicals as discussed below.
Breadth - This continues to be a tailwind.
Institutional Flows - Given that institutional flows dwarf all other flows when they are moving in and out of the market, these always have to be taken into account. As noted in the Flows section, I now have confirmation in what I had suspected would be coming last weekend and noted I thought was occurring in the nightly summaries - that systematic traders have jumped on board, particularly CTA’s who have greatly expanded their exposure. Volatility traders have as well but not to the same extent, while hedge funds appear to not yet have embraced the rally. So the fastest traders (CTA’s) have moved but the slower ones are just starting to or haven’t really started. The vol-strats will continue to engage if the rally progresses but I don’t know if we’ll get hedge fund buy in. If we did, this could go a lot further than people expect. And that may be the “pain trade” at this point.
This reengagement will only last, though, as long as the conditions remain right (i.e., inflation continues to behave and the overall growth trajectory remains supportive) as Charlie McElligott noted last week.
“Funds are moving much faster to grab into ‘risk-on‘ expressions and/or unwind legacy ‘risk-off‘ positioning in order to not start the year in a hole,” McElligott said, noting that performance betas versus a month ago suggest re-risking. Macro funds’ beta to equities and crude is up markedly, and a short-dollar preference is evident in higher betas to the euro, lower dollar-yen betas and a higher beta to gold. Charlie attributed that to an “ahead-of-schedule disinflationary regime change hit[ting] simultaneously in conjunction with a better-than-feared global growth trajectory.”
Retail - As noted periodically in the flows section retail had a rough year in 2022. Positioning here remains much more full than hedge funds, although they also do have a lot of cash on the sidelines to put to work at some point. Flows have been negative every week this year, so it doesn’t appear they’ve caught this rally. Will they jump on just as it turns like they did over and over in 2022?
Sentiment - As noted last week, sentiment has improved off the lows but isn’t fully buying in just yet.
Peter Bookvar on Institutional Investors’ survey- II said Bulls fell 1.4 pts w/o/w to 45.1 off the highest level in more than a year but Bears fell to 28.2 from 29.6 and that is the least since September.
AAII said Bulls fell 2.6 pts w/o/w to 28.4 after rising by 10.5 pts in the two weeks prior. Bears rose 3.6 pts w/o/w to 36.7 after falling by almost 20 pt since the end of December.
NAAIM (more active traders) are the most bullish since early 2022 though.
But this week Helene’s followers turned bearish after being are bullish for five straight weeks. As I said three weeks ago, they have generally been right when bullish readings cluster, we’ll see if they’re right about a turn this week.
Seasonality -As you know at this point, history continues to dictate a strong first quarter, but February is normally a weaker month than January or March. First we can talk about January:
BBG - S&P 500 is on pace for its second-best January since the turn of the century, trailing only the 7.9% jump in 2019. If history is any guide, the gauge is also likely to be in the green on Dec. 31, as the direction in the first month — a gain or loss — has matched the annual result two-thirds of the time since 1973. The positive-positive periods delivered a full-year average gain of 20%, while the negative-negative years saw a typical decline of 17%.
And from Jeff Hirsch (via Doug Kass).
January Trifecta More Bullish After Bear
We invented our January Indicator Trifecta in 2013 by combining our Santa Claus Rally and January Barometer, both invented by our late-founder Yale Hirsch in 1972 published in the 1973 Almanac, with the age-old First Five Days Early Warning System.Our analysis dictates that the bear market bottomed in October 2022. NASDAQ did have a lower closing low on December 28, 2022, but it made its intraday low on October 13 along with DJIA, S&P 500 and Russell 2000. DJIA made a closing low on September 30, S&P on October 12 and R2K back on June 16. Bottom line 2022 was a bear market year.
Our January Indicator Trifecta January is off to a great start this year with the Trifecta 2-for-2 so far. Our Santa Claus Rally (2023 STA, page 118) and the First 5 Days (2023 STA, page 16) logged S&P 500 gains earlier this month. With three days left it appears our January Barometer (2023 STA, page 18) will be positive and the Trifecta will be 3-for-3, which as you may remember is rather bullish. When there is a bear market low the prior year it's even more bullish for the year.
Using the Ned Davis Research bull and bear market definitions there were thirteen years since 1949 with bear market bottoms preceding a positive January Indicator Trifecta. S&P 500 was positive in all 13 years with double-digit gains every year, up 22.1% on average. The next 11 months have also never been down, up 16.8% on average.
When you take a look at the aggregate cycle charts of these 13 year (7 for NASDAQ) in the chart below of DJIA, S&P and NASDAQ it may be hard to contain yourself. NASDAQ and the techs may have been in the doghouse in 2022, but if this Trifecta after a bear market cycle follows the average course NAS could be up over 30% in 2023.
And FWIW Hirsch upgraded his assessment for the SPX.
The bears may be grabbing all the headlines and soundbites, but we have history and a host of data points that support our bullish outlook. History teaches us that all indexes do not bottom out at the same time when bear markets end, take 1974 for example. Market turns are not always accompanied by some Eureka moment or a blatantly obvious capitulation V-bottom. We expect the bull market we have forecasted to continue to be choppy through Q1, but it is unfolding.
It was a tech boom during Covid-19 and 2022 was the tech recession. It is not apparent to us that tech will sink the rest of the economy into recession. Q4 GDP was solid and employment data remains robust - even with the recent big tech layoffs. Big tech is returning to more appropriate staff sizing. They had ramped up for 30-50% growth, but now it's more like 0-10%. They are trimming the fat.
The market continues to confirm our bullish outlook. S&P is heading towards important resistance at the December high around 4100 after that it's the August high around 4300. We will be keeping an eye on the December Low Indicator (2023 STA, page 36) with the line in the sand at the Dow's December Closing Low of 32757.54 on 12/19/2022. But we want to be clear we are shifting our outlook to our Best-Case Scenario for above average pre-election-year gains of at least 15-20%.
But January will be so yesterday’s news soon, so let’s talk about February. First the bad.
And now the better (although still not great). Also from Jeff Hirsch.
Although February is right in the middle of the Best Six Months, its long-term track record, since 1950, is rather tepid. February ranks no better than sixth and has posted meager average gains except for the Russell 2000. Small cap stocks, benefiting from “January Effect” carry over; historically tend to outpace large cap stocks in February. The Russell 2000 index of small cap stocks turns in an average gain of 1.1% in February since 1979—just the sixth best month for that benchmark. Even with the market struggling the past two trading sessions Russell 2000 has maintained a performance lead this January compared to DJIA and S&P 500. This does bode well for the continued outperformance in February by small-cap stocks.
In pre-election years, February’s performance generally improves with average returns all turning positive. NASDAQ performs best, gaining an average 2.8% in pre-election-year Februarys since 1971. Russell 2000 is second best, averaging gains of 2.7% since 1979. DJIA, S&P 500 and Russell 1000, the large-cap indices, tend to lag with average advances ranging from 1.2% to 1.7%.
And in terms of all years the upcoming week is very strong on average.
So, a very busy week. Catch your breath on Monday because starting Tuesday between earnings and data it’s a firehose. So while I could point to positive technicals, breadth, seasonality, and/or institutional flows as conducive to the rally continuing, I think this week will be more about the fundamentals (earnings, economic data, and the Powell’s press conference). If those items continue to broadly cooperate (earnings come in “better than feared”, economic data supports a continued slowing in inflation and the economy without it (the economy) falling into more than a potential mild recession, and the Fed continues to stick to their current messaging (expecting to go a little over 5% and holding for 2023 but remaining data dependent)) we could see this rally continue much further than people expect. If you remember, I noted at the beginning of the year, “the consensus for 2023 is a poor first half with a better second half. Makes me think it’s unlikely that’s what we get.” In that regard I think most were not expecting a 10% up January (Doug Kass, Ed Yardeni, and Charlie McElligott are three who did call for it), so it’s likely many are already offsides (the flows out of US equities this month support that). That makes further gains even more “painful” for those out of position which could create a late “scramble in” to the rally. But, again, that requires the fundamentals to cooperate.
As Nomura’s Charlie McElligott described those dynamics behind the January rally this week (HR),
“Besides the obvious under-positioning dynamic, the key macro inputs behind the renewed re-risking confidence are about a re-pricing lower in left-tails and a re-pricing higher in right-tails,” Nomura’s Charlie McElligott said Friday. He called the Bank of Canada’s surprisingly explicit forward “hold” guidance (which accompanied Wednesday’s 25bps hike) material for the “macro vol compression story.”
“They’re the first major central bank to transition from the prior outsized hikes to now into the final ‘pause and reassess’ phase,” Charlie said, calling that a scenario that’s potentially “in play” for the Fed after next week’s move which, obviously, is locked on 25bps. It’s worth noting that McElligott preemptively sketched the contours of the current market and macro conjuncture on several different occasions earlier this year and late last. He reiterated the point on Friday.
“The consensus view is and was ‘recession / trough / bottom in H1,’ before later we then see a ‘Fed easing / market stabilizing and recover[y] in H2’ mindset,” he remarked, before noting that instead, resilient US services, labor and wages have helped “to offset the obvious recession already underway in housing and manufacturing,” while the outlook for global growth is being re-priced for the better “in real-time.” The takeaway, Charlie said, is that it’s “early in the year where I think we see risk surprise to the upside, holding off the ‘hard landing-istas,’ before you get that come-to-Jesus moment sequenced thereafter.”
One final note is I have gotten a number of “pledges” for a possible subscription model. I’m not sure why I’m getting them all of a sudden, I assume it is something that Substack changed. I want to be clear I did not change anything or have any current plans for a subscription tier. But I do want to emphasize that I appreciate the gestures and moreso the encouraging words that have accompanied them. That has helped add some fuel to the fire to keep this going. That said, if I was going to make one request it would be that you share the blog with others who would like it. It’s seeing the new subscribers (as well as getting the notes of appreciation) that really make this worthwhile.
Portfolio Notes
Sold out of BABA, ADBE, INCY, WCC, NLY, AAPL, LEN/B, BYND, SONY, TEAM, one-half of TTWO, one-third of META, elsewhere heavy trimming and call selling just about everywhere. I also reduced my shorts early in the week.
Cash = 60% (this is much higher than I held pre-3Q21, 30% above average since then (cash is held mostly in shorter term CD’s with some in MINT)).
Shorts: SPX (1%), QQQ (2%), XLE (2 %)
Positions (after around the top 20 I don’t keep track of their order on a frequent basis as they’re all less than 0.5% of my portfolio).
Core positions (each 3% or more of portfolio, total around 25%) Note the core of my portfolio is energy infrastructure, specifically petroleum focused pipelines (MLP’s due to the tax advantages). If you want to know more about reasons to own pipeline companies this is a decent primer, but I’m happy to answer questions or steer you in the right direction. https://spac.tortoiseadvisors.com/resources/insights/commentary/the-case-for-energy-infrastructure-as-a-real-asset/
EPD, ET, MMP, PAA
Secondary core positions (each at least 0.5% of portfolio, total around 25%)
GOOGL, ENB, AMZN, KMI, WFC, MSFT, CTRA, MPLX
For the rest I’ll split based on how I think about them (these are all less than 0.5% of the portfolio each)
High quality, high conviction (long term), roughly in order of sizing
Higher risk due to business or sector issues; own due to depressed valuation or long term growth potential (secular tailwinds), but at this point I am looking to scale out of these names on strength. These are generally much smaller positions outside of the top three below.
Note: CQP, EPD, ET, MMP, MPLX, PAA, WES all issue K-1s (PAGP is the same as PAA but with a 1099).
Reminder: I am generally a long term investor (12+ month horizon) but about 20% of my portfolio is more short term oriented (just looking for a retracement of a big move for example). This is probably a little more given the current environment. I do like to get paid while I wait though so I am a sucker for a good well supported dividend. I also supplement that with selling calls and puts. When I sell a stock, I almost always use a 1-2% trailstop. If you don’t know what that is, you can look it up on investopedia. But that allows me to continue to participate in a move if it just keeps going. Sometimes those don’t sell for days. When I sell calls or puts I go out 30-60 days and look to buy back at half price. Rather than monitor them I just put in a GTC order at the half price mark.
Thanks for reading Neil’s Newsletter! Subscribe for free to receive new posts and support my work.
To see more content, including summaries of most major U.S. economic reports and my morning and nightly updates go to Neil’s Newsletter Substack for newer posts or https://sethiassociates.blogspot.com for the full history. You can also follow me on Twitter at @neilksethi